. 2020 Jan;24(1):1099-1115.
doi: 10.1111/jcmm.14846. Epub 2019 Nov 21.

LncRNA H19 ameliorates myocardial infarction-induced myocardial injury and maladaptive cardiac remodelling by regulating KDM3A

Affiliations

LncRNA H19 ameliorates myocardial infarction-induced myocardial injury and maladaptive cardiac remodelling by regulating KDM3A

Bo-Fang Zhang et al. J Cell Mol Med. 2020 Jan.

Erratum in

Abstract

Myocardial infarction (MI) remains the leading cause of morbidity and mortality worldwide, and novel therapeutic targets still need to be investigated to alleviate myocardial injury and the ensuing maladaptive cardiac remodelling. Accumulating studies have indicated that lncRNA H19 might exert a crucial regulatory effect on cardiovascular disease. In this study, we aimed to explore the biological function and molecular mechanism of H19 in MI. To investigate the biological functions of H19, miRNA-22-3p and KDM3A, gain- and loss-of-function experiments were performed. In addition, bioinformatics analysis, dual-luciferase reporter assays, RNA immunoprecipitation (RIP) assays, RNA pull-down assays, quantitative RT-PCR and Western blot analyses as well as rescue experiments were conducted to reveal an underlying competitive endogenous RNA (ceRNA) mechanism. We found that H19 was significantly down-regulated after MI. Functionally, enforced H19 expression dramatically reduced infarct size, improved cardiac performance and alleviated cardiac fibrosis by mitigating myocardial apoptosis and decreasing inflammation. However, H19 knockdown resulted in the opposite effects. Bioinformatics analysis and dual-luciferase assays revealed that, mechanistically, miR-22-3p was a direct target of H19, which was also confirmed by RIP and RNA pull-down assays in primary cardiomyocytes. In addition, bioinformatics analysis and dual-luciferase reporter assays also demonstrated that miRNA-22-3p directly targeted the KDM3A gene. Moreover, subsequent rescue experiments further verified that H19 regulated the expression of KDM3A to ameliorate MI-induced myocardial injury in a miR-22-3p-dependent manner. The present study revealed the critical role of the lncRNAH19/miR-22-3p/KDM3A pathway in MI. These findings suggest that H19 may act as a potential biomarker and therapeutic target for MI.

Keywords: KDM3A; LncRNA H19; miR-22-3p; myocardial infarction.


Conflict of interest statement

The authors declare that they have no competing interests.

Figures

Figure 1
Figure 1
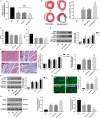
Enforced H19 expression prominently alleviated AMI‐induced myocardial injury and ensuing maladaptive cardiac remodelling. A, qRT‐PCR analysis of H19 levels in normal myocardial tissue or in the infarction border zone. (B, C, D) Transfection efficiencies of adenoviruses were determined by qRT‐PCR, # P < .05. E, Representative Masson's staining images at the heart papillary muscle cross‐sectional scan and the infarct rate of the different groups. F, LVEF and LVFS 4 wk after AMI in the different groups. G, Western blot analysis of the expression of ANP and BNP 4 wk after AMI in the different groups. H, Representative images of Masson's staining (scale bar = 50 μm) and mRNA expression of collagen I, collagen III and TGF‐β in the different groups. I, Western blot analysis of the expression of IL‐6 and TNF‐α in the different groups. J, Representative images of TUNEL staining in the different groups (scale bar = 50 μm): DAPI‐labelled nuclei of cardiomyocytes (blue); ɑ‐actinin‐labelled cardiomyocytes (green); TUNEL‐labelled nuclei of apoptotic cardiomyocytes (red). K, Western blot analysis of the expression of Bax and Bcl‐2 in the different groups is shown. The values were expressed as the mean ± standard deviation (SD). *P < .05 versus the SO group; **P < .05 versus the MI + Ad‐NC group
Figure 2
Figure 2
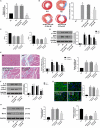
H19 knockdown exacerbated AMI‐induced myocardial injury and the ensuing maladaptive cardiac remodelling. A, The transfection efficiency of Ad‐shH19 was determined by qRT‐PCR. B, Representative Masson's staining images of the heart papillary muscle cross‐sectional scan images and the infarct rate of the different groups. C, EF and FS 4 wk after AMI. D, The expression of ANP and BNP 4 wk after AMI. E, Representative images of Masson staining (scale bar = 50 μm) and the mRNA expression of collagen I, collagen III and TGF‐β in the different groups. F, The expression of IL‐6 and TNF‐α. G, Representative images of TUNEL staining and AI in the different groups (scale bar = 50 μm). H, The expression of apoptosis‐related protein in the different groups. The values are expressed as the mean ± SD. *P < .05 versus the SO group; **P < .05 versus the MI + Ad‐Scr group
Figure 3
Figure 3
miRNA‐22‐3p is a direct target of H19 in cardiomyocytes. A, The miRNA‐22‐3p levels were measured by qRT‐PCR after up‐regulation of H19 expression by adenovirus infection. *P < .05 versus the SO group; **P < .05 versus the MI + Ad‐NC group. B, Levels of miRNA‐22‐3p after down‐regulation of H19 expression by adenovirus infection. *P < .05 versus the SO group; **P < .05 versus the MI + Ad‐Scr group. C, H19 contains a site complementary to miRNA‐22‐3p. D, Luciferase activity in HEK293T cells cotransfected with pmirGLO‐H19‐Wt or pmirGLO‐H19‐Mut and miRNA‐22‐3p measured by a dual‐luciferase reporter assay. # P < .05. (E, F) The levels of H19 and miRNA‐22‐3p in RNA immunoprecipitates are presented as the fold enrichment in Ago2 relative to IgG immunoprecipitates. # P < .05. (G, H) H19 is associated with miRNA‐22‐3p. H19 was pulled down by miRNA‐22‐3p, and the levels of H19 were analysed by RT‐PCR. # P < .05. I, miRNA‐22‐3p is associated with H19. miRNA‐22‐3p could be pulled down by the H19 probe in cardiomyocytes, and the levels of miRNA‐22‐3p were analysed by qRT‐PCR. # P < .05. The values are expressed as the mean ± SD
Figure 4
Figure 4
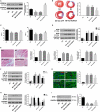
miRNA‐22‐3p knockdown ameliorated AMI‐induced myocardial injury and the consequent maladaptive cardiac remodelling. A, The transfection efficiency of Ad‐(anti‐miR‐22‐3p) was determined by qRT‐PCR. B, Representative Masson's staining images and the infarct rate of the different groups. C, EF and FS 4 wk after AMI in the different groups. D, The expression of ANP and BNP in the different groups. E, Representative images of Masson's staining (scale bar = 50 μm) and the mRNA expression of collagen I, collagen III and TGF‐β. F, The expression of IL‐6 and TNF‐α in the different groups. G, Representative images of TUNEL staining and AI in the different groups (scale bar = 50 μm). H, The expression of Bax and Bcl‐2 in the different groups. The values are expressed as the mean ± SD. *P < .05 versus the SO group; # P < .05 versus the Ad‐NC‐(anti‐miR‐22‐3p)+MI group. The values are expressed as the mean ± SD
Figure 5
Figure 5
KDM3A is a direct target of miRNA‐22‐3p. A, KDM3A levels in normal myocardial tissue or in the infarction border zone. B, KDM3A levels after down‐regulation of the expression of miRNA‐22‐3p by adenovirus infection. *P < .05 versus the SO group; # P < .05 versus the Ad‐NC‐(anti‐miR‐22‐3p)+MI group. (C, D) Western blot analysis of KDM3A levels after up‐regulation and down‐regulation of H19 expression by adenovirus infection. *P < .05 versus the SO group; ** P < .05 versus the control group. E, miRNA‐22‐3p contains a site complementary to KDM3A. F, Luciferase activity of pmirGLO‐KDM3A‐Wt and pmirGLO‐KDM3A‐Mut after miRNA‐22‐3p transfection in HEK293T cells by dual‐luciferase reporter assay. # P < .05. The values are expressed as the mean ± SD
Figure 6
Figure 6
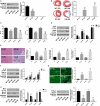
Enforced KDM3A expression obviously mitigated AMI‐induced myocardial injury and subsequent maladaptive cardiac remodelling. A, The transfection efficiency of Ad‐KDM3A was determined by Western blot. B, Representative Masson's staining images of the heart papillary muscle and the infarct rate of the different groups. C, EF and FS of the different groups 4 wk after AMI. D, The expression of ANP and BNP 4 wk after AMI. E, Representative images of Masson's staining (scale bar = 50 μm) and mRNA levels of collagen I, collagen III and TGF‐β. F, The expression of IL‐6 and TNF‐α. G, TUNEL staining and apoptotic index in the different groups (scale bar = 50 μm). (H, I)The expression of Bax, Bcl‐2 and ETS‐1. The values are expressed as the mean ± SD. *P < .05 versus the SO group; # P < .05 versus the MI + Ad‐GFP group
Figure 7
Figure 7
KDM3A knockout obviously aggravated AMI‐induced myocardial injury and the ensuing cardiac remodelling. A, The protein levels of KDM3A in the different groups. B, Representative Masson's staining images of the heart papillary muscle and the infarct rate of the different groups. C, EF and FS in the different groups. D, The levels of ANP and BNP 4 wk after AMI. E, Representative images of Masson's staining (scale bar = 50 μm) and the mRNA expression of collagen I, collagen III and TGF‐β in the different groups. F, The expression of inflammatory cytokines in the different groups. G, Representative images of TUNEL staining and apoptotic index in the different groups (scale bar = 50 μm). (H, I) The expression of apoptosis‐related protein and ETS‐1 in the different groups. The values are expressed as the mean ± SD. **P < .05 versus the WT‐SO group; ## P < .05 versus the WT + MI group
Figure 8
Figure 8
miRNA‐22‐3p overexpression could counteract the beneficial effect of H19 up‐regulation. A, Representative Masson's staining images of the heart papillary muscle cross‐sectional scan and the infarct rate of the different groups. B, EF and FS. C, The expression of ANP and BNP 4 wk after AMI. D, Representative images of Masson's staining (scale bar = 50 μm) and the mRNA expression of collagen I, collagen III and TGF‐β in the different groups. E, The expression of IL‐6 and TNF‐α in different groups. F, Representative images of TUNEL staining and apoptotic index in the different groups. (G, H, I) Western blot analysis of the expression of Bax, Bcl‐2, KDM3A and ETS‐1 in the different groups. The values are expressed as the mean ± SD. *P < .05 versus the MI group; # P < .05 versus the MI + H19 group

References

    1. Hristov M, Weber C. Myocardial infarction and inflammation: lost in the biomarker labyrinth. Circ Res. 2015;116(5):781‐783. - PubMed
    1. Thiele H, Ohman EM, de Waha‐Thiele S, et al. Management of cardiogenic shock complicating myocardial infarction: an update 2019. Eur Heart J. 2019;40(32):2671‐2683. - PubMed
    1. Shah M, Patil S, Patel B, et al. Causes and predictors of 30‐day readmission in patients with acute myocardial infarction and cardiogenic shock. Circ Heart Fail. 2018;11(4):e004310. - PubMed
    1. Mahmoud KD, Zijlstra F. Thrombus aspiration in acute myocardial infarction. Nat Rev Cardiol. 2016;13(7):418‐428. - PubMed
    1. Toldo S, Abbate A. The NLRP3 inflammasome in acute myocardial infarction. Nat Rev Cardiol. 2018;15(4):203‐214. - PubMed

Publication types

MeSH terms