

Improvements in Metabolic Syndrome by Xanthohumol Derivatives Are Linked to Altered Gut Microbiota and Bile Acid Metabolism
- PMID: 31755244
- PMCID: PMC7029812
- DOI: 10.1002/mnfr.201900789
Improvements in Metabolic Syndrome by Xanthohumol Derivatives Are Linked to Altered Gut Microbiota and Bile Acid Metabolism
Abstract
Scope: Two hydrogenated xanthohumol (XN) derivatives, α,β-dihydro-XN (DXN) and tetrahydro-XN (TXN), improved parameters of metabolic syndrome (MetS), a critical risk factor of cardiovascular disease (CVD) and type 2 diabetes, in a diet-induced obese murine model. It is hypothesized that improvements in obesity and MetS are linked to changes in composition of the gut microbiota, bile acid metabolism, intestinal barrier function, and inflammation.
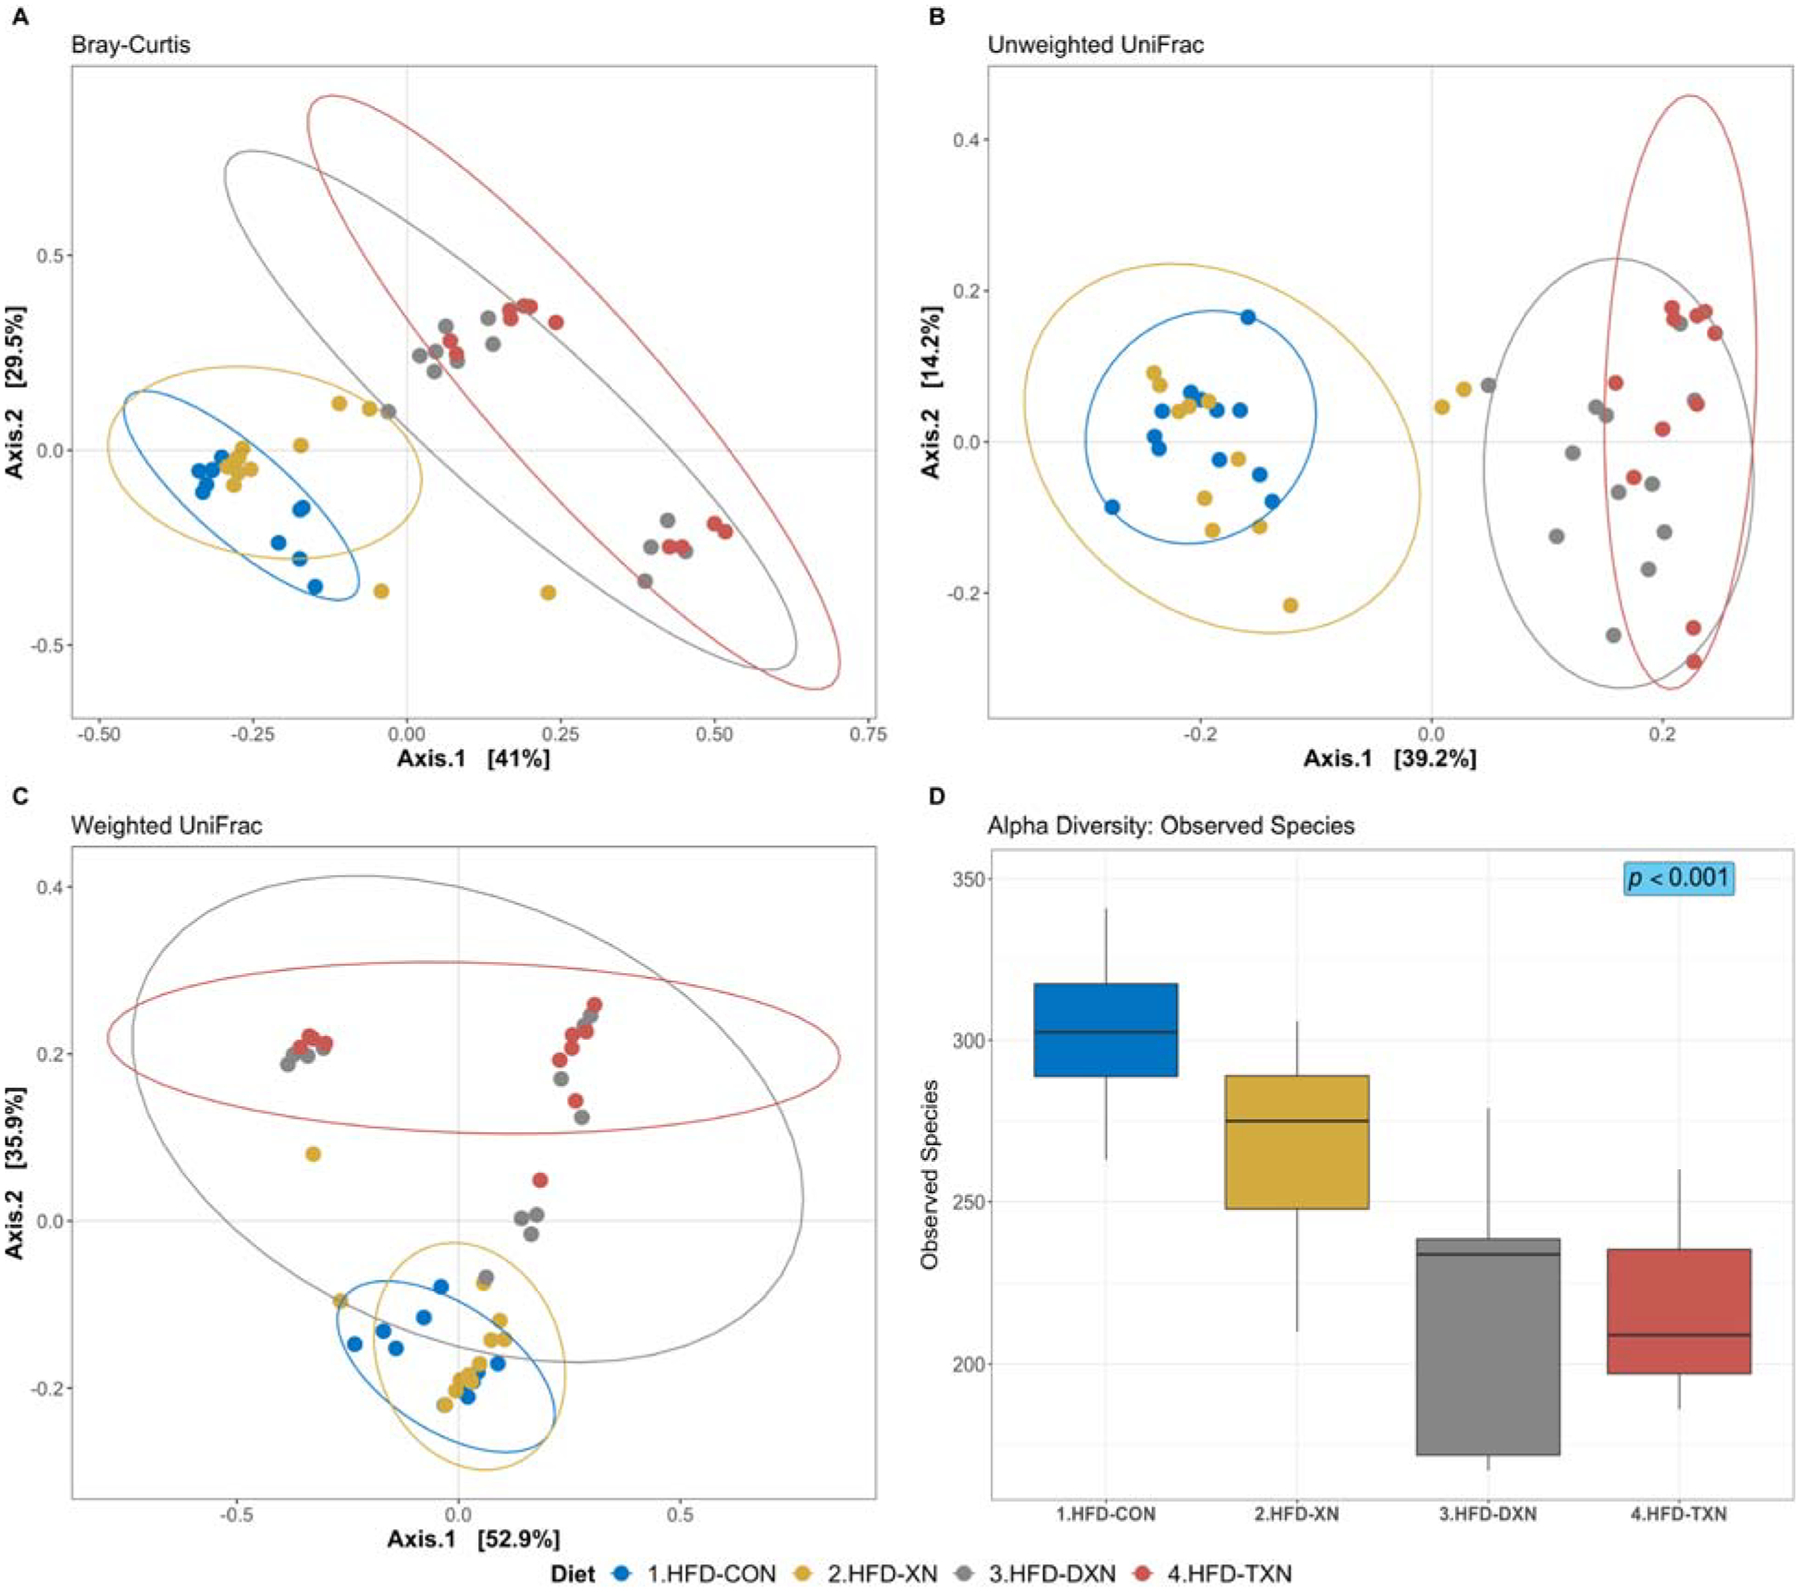
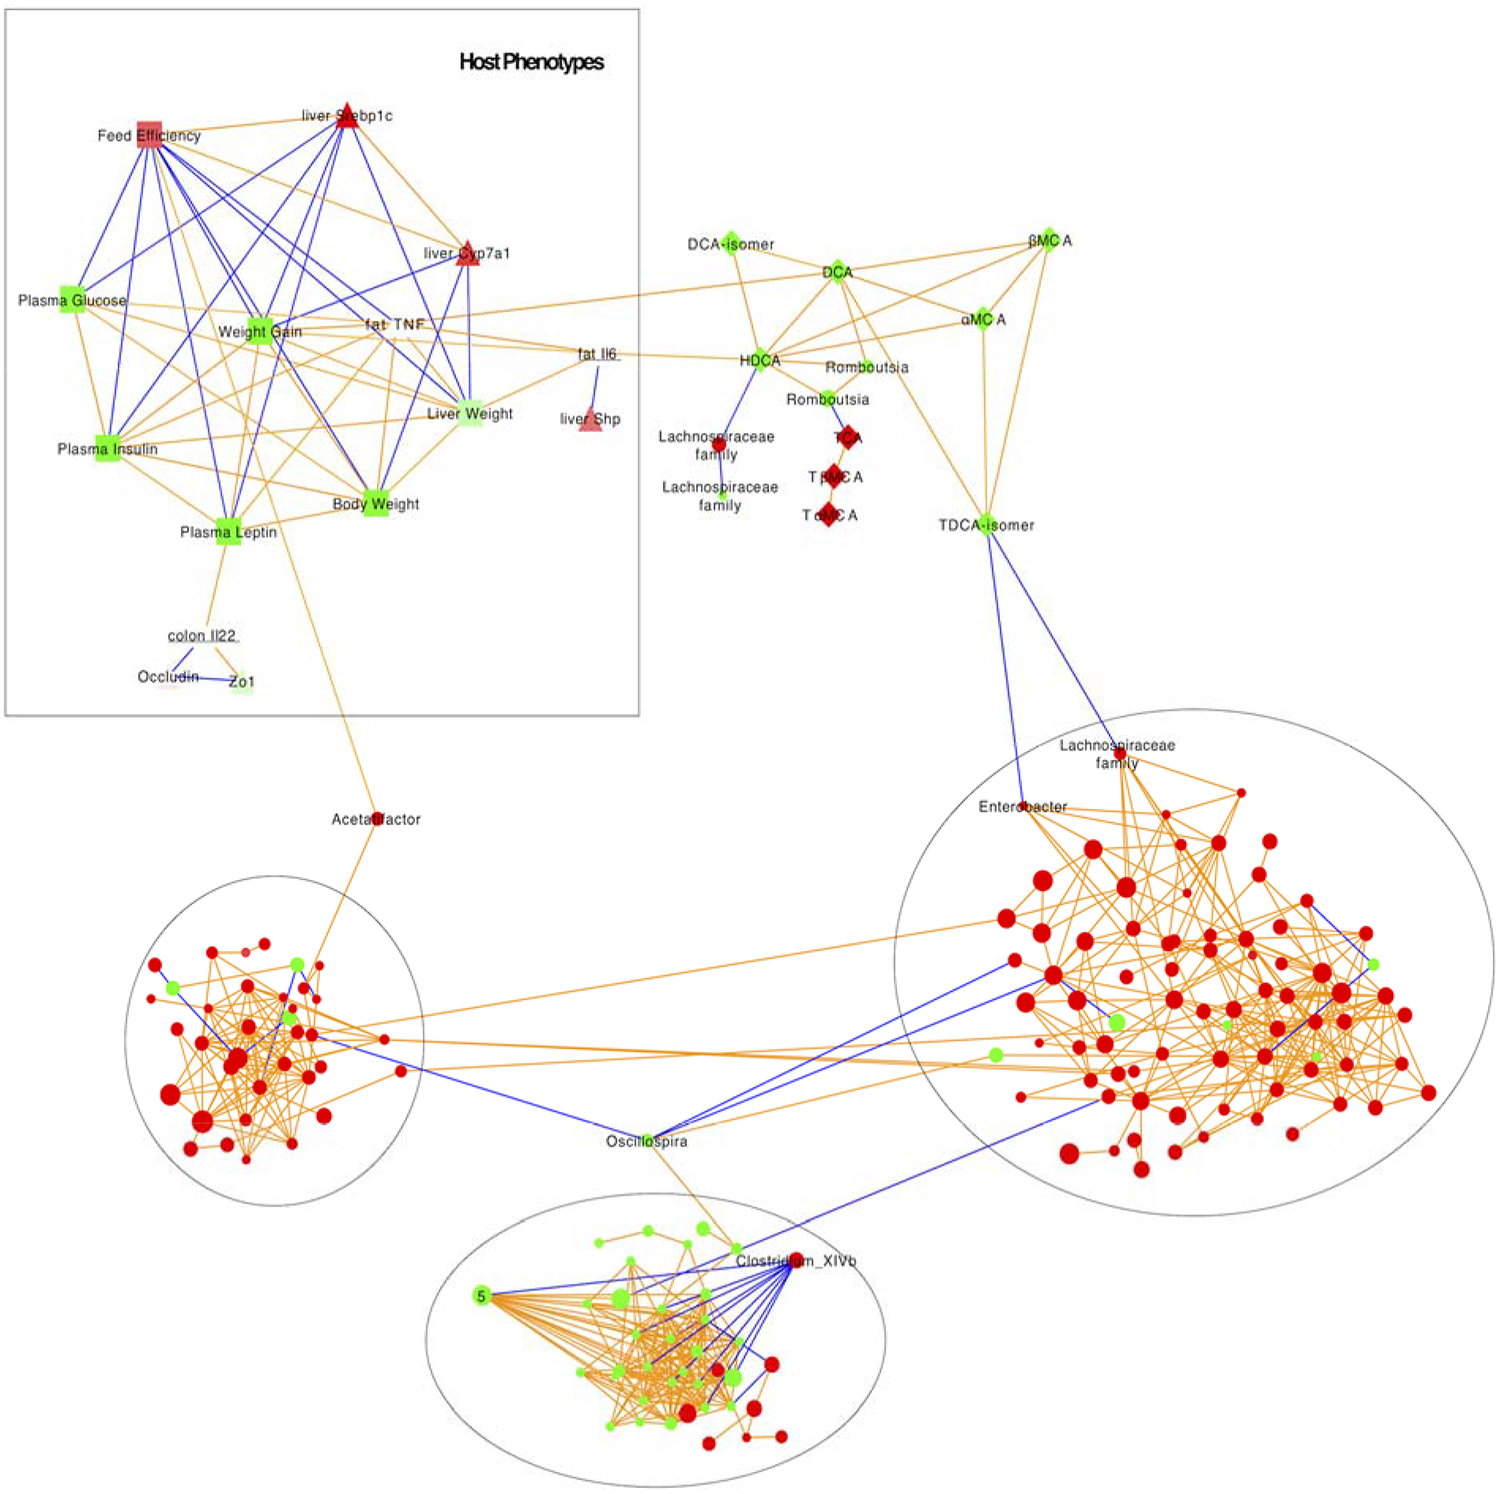
Methods and results: To test this hypothesis, 16S rRNA genes were sequenced and bile acids were measured in fecal samples from C57BL/6J mice fed a high-fat diet (HFD) or HFD containing XN, DXN or TXN. Expression of genes associated with epithelial barrier function, inflammation, and bile acid metabolism were measured in the colon, white adipose tissue (WAT), and liver, respectively. Administration of XN derivatives decreases intestinal microbiota diversity and abundance-specifically Bacteroidetes and Tenericutes-alters bile acid metabolism, and reduces inflammation. In WAT, TXN supplementation decreases pro-inflammatory gene expression by suppressing macrophage infiltration. Transkingdom network analysis connects changes in the microbiota to improvements in MetS in the host.
Conclusion: Changes in the gut microbiota and bile acid metabolism may explain, in part, the improvements in obesity and MetS associated with administration of XN and its derivatives.
Keywords: bile acid; gut microbiota; metabolic syndrome; xanthohumol.
© 2019 WILEY-VCH Verlag GmbH & Co. KGaA, Weinheim.
Conflict of interest statement
Conflict of interest statement
We declare that we have no conflicts of interest.
Figures
References
-
- Legette LL, Luna AYM, Reed RL, Miranda CL, Bobe G, Proteau RR, Stevens JF, Phytochemistry, 2013, 91, 236. - PubMed
Publication types
MeSH terms
Substances
Grants and funding
LinkOut - more resources
Full Text Sources
Medical
Miscellaneous
