

Avian influenza virus prevalence in marine birds is dependent on ocean temperatures
- PMID: 31755623
- PMCID: PMC7317457
- DOI: 10.1002/eap.2040
Avian influenza virus prevalence in marine birds is dependent on ocean temperatures
Abstract
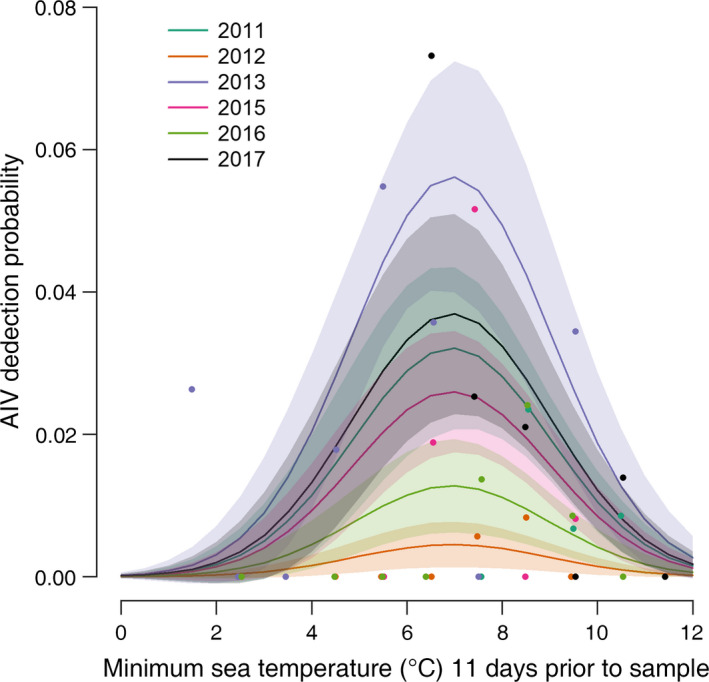
Waterfowl and shorebirds are the primary hosts of influenza A virus (IAV), however, in most surveillance efforts, large populations of birds are not routinely examined; specifically marine ducks and other birds that reside predominately on or near the ocean. We conducted a long-term study sampling sea ducks and gulls in coastal Maine for IAV and found a virus prevalence (1.7%) much lower than is typically found in freshwater duck populations. We found wide year-to-year variation in virus detection in sea ducks and that the ocean water temperature was an important factor affecting IAV prevalence. In particular, the ocean temperature that occurred 11 d prior to collecting virus positive samples was important while water temperature measured concurrently with host sampling had no explanatory power for viral detection. We also experimentally showed that IAV is relatively unstable in sea water at temperatures typically found during our sampling. This represents the first report of virus prevalence and actual environmental data that help explain the variation in marine IAV transmission dynamics.
Keywords: avian influenza; gulls; marine birds; ocean temperature; sea ducks; stability; transmission; virus prevalence.
© 2019 by the Ecological Society of America.
Figures

References
-
- Brown, J. D. , Swayne D. E., Cooper R. J., Burns R. E., and Stallknecht D. E.. 2007. Persistence of H5 and H7 avian influenza viruses in water. Avian Disease (Suppl) 51:285–289. - PubMed
-
- Brown, J. D. , Goekjian G., Poulson R., Valeika S., and Stallknecht D. E.. 2009. Avian influenza virus in water: infectivity is dependent on pH, salinity and temperature. Veterinary Microbiology 136:20–26. - PubMed
-
- Burnham, K. P. , and Anderson D. R.. 2002. Model selection and multimodel inference: a practical information‐theoretic approach, Second edition Springer, Berlin, Germany.
Publication types
MeSH terms
Grants and funding
LinkOut - more resources
Full Text Sources
Medical
