

Effect of a Snack Bar Optimized to Reduce Alcohol Bioavailability: A Randomized Controlled Clinical Trial in Healthy Individuals
- PMID: 31755823
- PMCID: PMC7185312
- DOI: 10.1089/jmf.2019.0228
Effect of a Snack Bar Optimized to Reduce Alcohol Bioavailability: A Randomized Controlled Clinical Trial in Healthy Individuals
Abstract
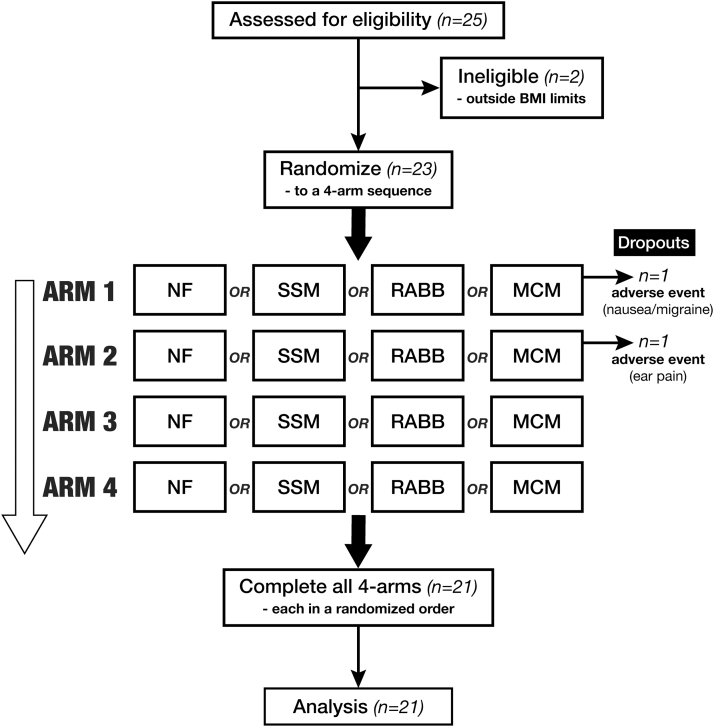
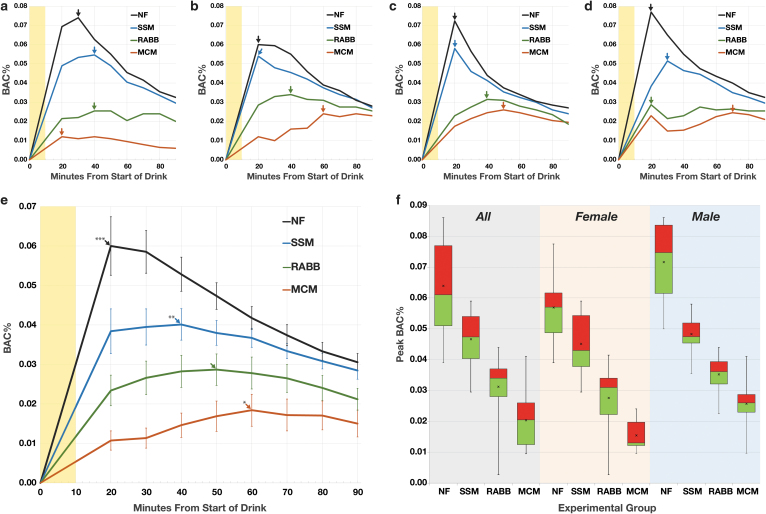
Alcohol intoxication impairs judgment and reaction times and the level of blood alcohol concentration (BAC) is highly correlated with accidents and injury. We hypothesized that a food optimized to delay gastric emptying, a reduced alcohol bioavailability bar (RABB), would decrease postprandial BAC and alcohol bioavailability with greater caloric-efficiency than control foods. Therefore, we evaluated the RABB in a randomized, crossover trial in 21 overnight fasted healthy adults (10 male, 11 female). Just before consuming a moderate dose of alcohol (0.3-0.35 g/kg body weight), participants ate either (1) no food (NF, 0 kcal), (2) the RABB (210 kcal), (3) a savory snack mix (SSM, 210 kcal), or (4) a multicomponent meal (MCM, 635 kcal) and their BAC was measured over 90 minutes using a breathalyzer, the primary endpoint being peak BAC (pBAC). pBACs were analyzed by repeated measures analysis of variance (ANOVA) (F = 107.5, P < .0001) with the differences between means assessed using Tukey's honestly significant difference test. The pBAC of each group was different (P < .001) from all other groups (NF = 0.064 ± 0.003, SSM = 0.047 ± 0.002, RABB = 0.031 ± 0.002, MCM = 0.020 ± 0.002%; mean ± standard error of the mean). Furthermore, the bioavailability of alcohol over 90 minutes (BA90) was reduced compared to the NF group by similar margins (SSM = 22.0 ± 2.2, RABB = 45.0 ± 3.8, MCM = 67.9 ± 3.1%) with the mean BA90 of each group different from all other groups (P < .001). Compared to the NF condition, the average reduction of pBAC per 100 calories of food consumed was higher for the RABB (24.0%) than either the SSM (11.8%) or the MCM (10.7%). This study demonstrates that the RABB can reduce both pBAC and alcohol bioavailability with high caloric-efficiency.
Keywords: BAC; binge drinking; first pass metabolism; food; gastric emptying; intoxication; protein.
Conflict of interest statement
J.M.F. is an employee and part owner of Zeno Functional Foods, LLC (“ZENO”), a privately held company. T.M.S.W. and A.L.J. are employees and part owners and J.E.C., A.E., and J.C.N., are employees of INQUIS Clinical Research, Ltd. with no financial ties to ZENO apart from carrying out this study. ZENO is developing a commercial product (SOBAR) based upon the research presented here as well as associated patent filings.
Figures
Similar articles
-
Lower Blood Alcohol Concentration Among HIV-Positive Versus HIV-Negative Individuals Following Controlled Alcohol Administration.Alcohol Clin Exp Res. 2018 Sep;42(9):1684-1692. doi: 10.1111/acer.13816. Epub 2018 Jul 10. Alcohol Clin Exp Res. 2018. PMID: 29928776 Free PMC article. Clinical Trial.
-
Absorption and peak blood alcohol concentration after drinking beer, wine, or spirits.Alcohol Clin Exp Res. 2014 May;38(5):1200-4. doi: 10.1111/acer.12355. Epub 2014 Mar 21. Alcohol Clin Exp Res. 2014. PMID: 24655007 Free PMC article. Clinical Trial.
-
The effects of a priming dose of alcohol and drinking environment on snack food intake.Appetite. 2015 Dec;95:341-8. doi: 10.1016/j.appet.2015.07.016. Epub 2015 Jul 23. Appetite. 2015. PMID: 26210606 Clinical Trial.
-
The relative reinforcing value of sweet versus savory snack foods after consumption of sugar- or non-nutritive sweetened beverages.Appetite. 2017 May 1;112:143-149. doi: 10.1016/j.appet.2017.01.028. Epub 2017 Jan 23. Appetite. 2017. PMID: 28126491 Clinical Trial.
-
[Alcohol metabolism at moderate drinking in healthy men. Comparison between differences of alcohol beverages, with and without meal, and genetic polymorphism].Nihon Arukoru Yakubutsu Igakkai Zasshi. 2011 Jun;46(3):357-67. Nihon Arukoru Yakubutsu Igakkai Zasshi. 2011. PMID: 21861333 Clinical Trial. Japanese.
Cited by
-
Safer-use strategies in the context of harm-reduction treatment for people experiencing homelessness and alcohol use disorder.Int J Drug Policy. 2024 Jul;129:104448. doi: 10.1016/j.drugpo.2024.104448. Epub 2024 Jun 20. Int J Drug Policy. 2024. PMID: 38905941 Free PMC article. Clinical Trial.
-
Alcohol in Daily Products: Health Risks, Cultural Considerations, and Economic Impacts.Risk Manag Healthc Policy. 2025 Jan 18;18:217-237. doi: 10.2147/RMHP.S495493. eCollection 2025. Risk Manag Healthc Policy. 2025. PMID: 39845405 Free PMC article. Review.
References
-
- Di Castelnuovo A, Costanzo S, Bagnardi V, Donati MB, Iacoviello, de Gaetano G: Alcohol dosing and total mortality in men and women: An updated meta-analysis of 34 prospective studies. Arch Intern Med 2006;166:2437–2445 - PubMed
-
- Rehm J, Taylor B, Mohapatra S, et al. : Alcohol as a risk factor for liver cirrhosis: A systematic review and meta-analysis. Drug Alcohol Rev 2010;29:437–445 - PubMed
Publication types
MeSH terms
Substances
LinkOut - more resources
Full Text Sources
Other Literature Sources
Research Materials