. 2019 Nov 22;17(11):e3000289.
doi: 10.1371/journal.pbio.3000289. eCollection 2019 Nov.

Resolving noise-control conflict by gene duplication

Affiliations

Resolving noise-control conflict by gene duplication

Michal Chapal et al. PLoS Biol. .

Abstract

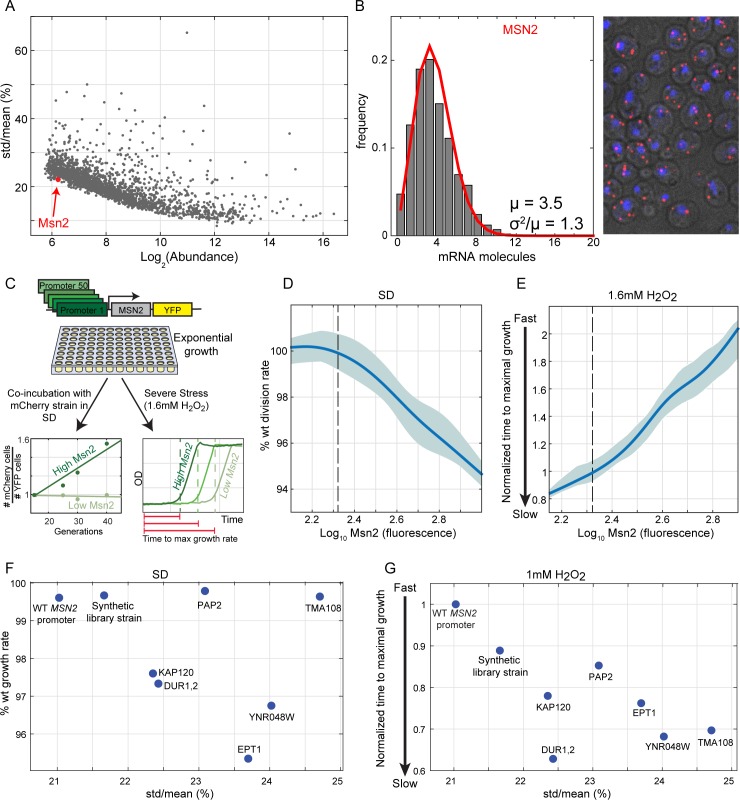
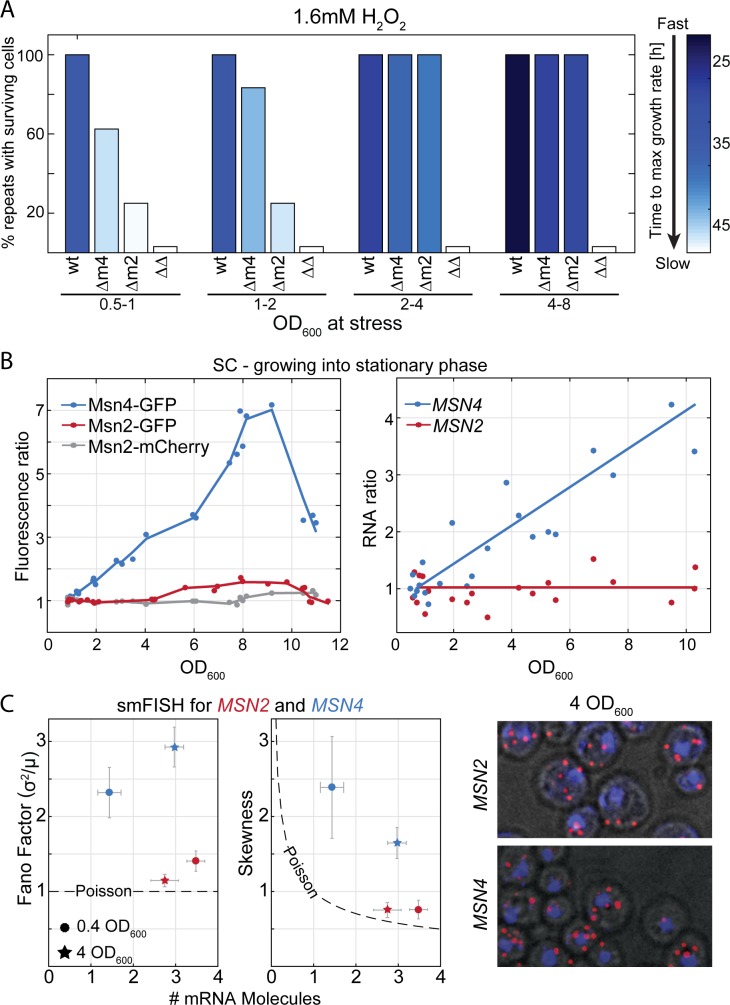
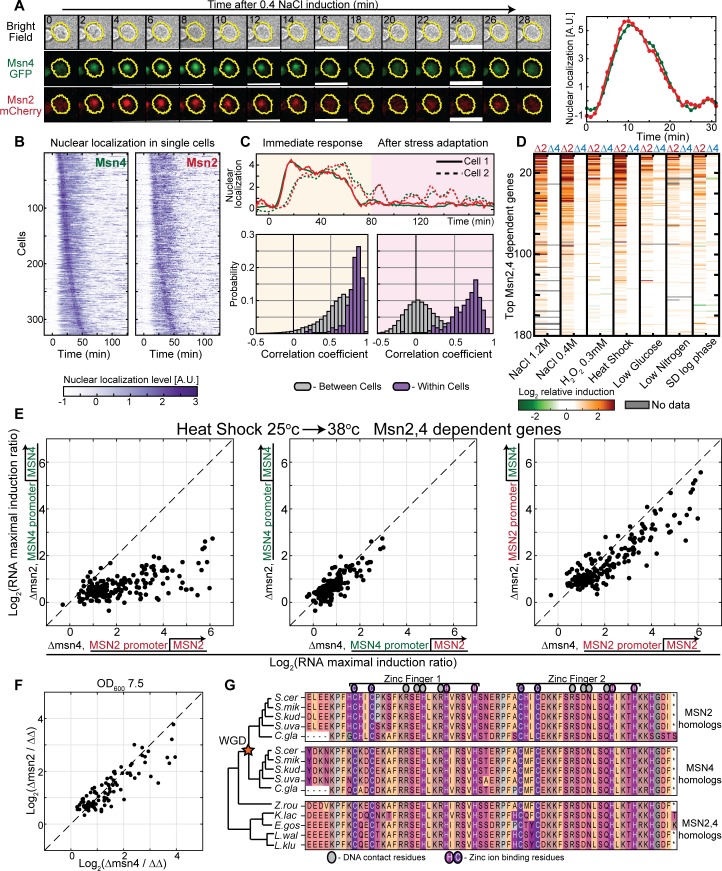
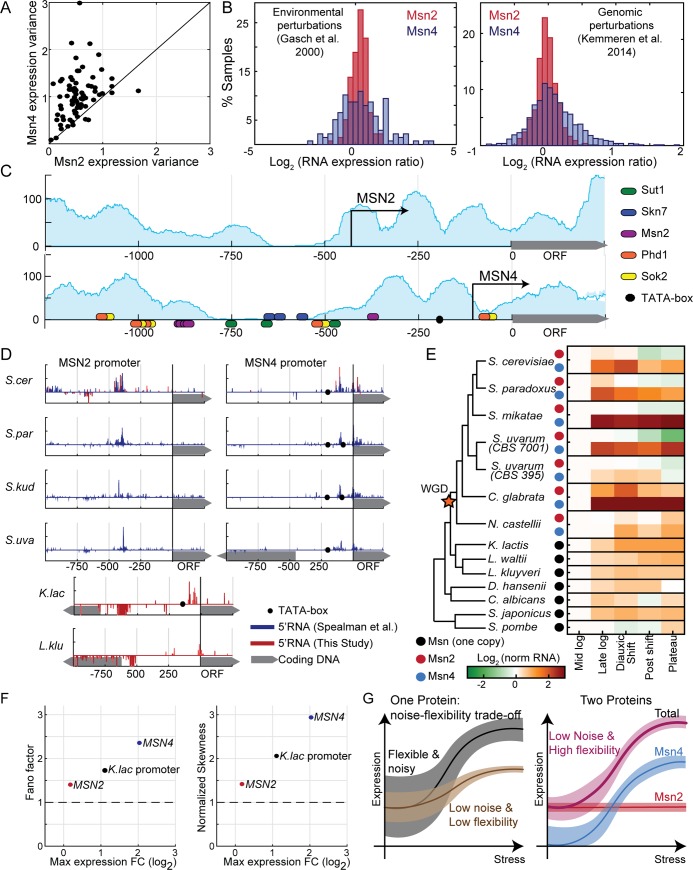
Gene duplication promotes adaptive evolution in two main ways: allowing one duplicate to evolve a new function and splitting ancestral functions between the duplicates. The second scenario may resolve adaptive conflicts that can rise when one gene performs different functions. In an apparent departure from both scenarios, low-expressing transcription factor (TF) duplicates commonly bind to the same DNA motifs and act in overlapping conditions. To examine for possible benefits of this apparent redundancy, we examined the Msn2 and Msn4 duplicates in budding yeast. We show that Msn2,4 function as one unit by inducing the same set of target genes in overlapping conditions. Yet, the two-factor composition allows this unit's expression to be both environmentally responsive and with low noise, resolving an adaptive conflict that limits expression of single genes. We propose that duplication can provide adaptive benefit through cooperation rather than functional divergence, allowing two-factor dynamics with beneficial properties that cannot be achieved by a single gene.


Conflict of interest statement

The authors have declared that no competing interests exist.

Figures

Fig 1
Fig 1. Tuning of Msn2 expression in rapidly growing cells.
(A) Cell-to-cell variability of Msn2-GFP is the lowest of all equally abundant proteins: shown are the noise versus abundance data of approximately 2,500 GFP-fused proteins (data from Newman and colleagues [24]). Msn2 is shown as a red dot. Msn4-GFP was not detected. (B) Low-noise (Poisson) distribution of MSN2 in individual cells: MSN2 expression levels were measured using smFISH. (Left) MSN2 mRNA counts distribution, quantified in >650 single cells. Red line represents Poisson fit to the data. (Right) Fixed cells labeled with MSN2 mRNA in red and DAPI staining in blue, in a maximal z-projection image. (C–E) Msn2 expression increases stress protection but slows growth in the absence of stress: we generated a library of 50 strains with MSN4 deletion and Msn2-YFP expressed under different synthetic promoters (from Keren and colleagues [32]), spanning a range of expression values (C, Materials and Methods). This library was used to measure the effect of Msn2 expression level on growth rate and stress protection. Growth rates were measured using a sensitive competition assay and are shown in (D). Stress protection was measured by subjecting exponentially growing cells to H2O2 (1.6 mM) and identifying the time at which growth was first detected by continuous OD measurements (E). Shown are the median of all strains and repeats in solid line and 25th–75th percentiles in the shaded areas. Dashed lines indicate WT Msn2 level. (F–G) Noisy Msn2 expression decreases stress protection and growth rate: we generated six strains with Msn2-YFP expressed under different promoters, which control genes with noisier expression than Msn2 but have a similar mean abundance (mean abundance in S5 Fig), and deletion of MSN4. These strains, together with an additional strain from the synthetic library (C), were used to measure growth rates (F) and stress protection (G) as described in (D,E) as a function of Msn2 expression noise. Promoter names are indicated in the figure. The raw data for (B) are available in S1 Data, for (D,F) in S2 Data, and for (E,G) in S3 Data. GFP, green fluorescent protein; OD, Optical Density; std, standard deviation; WT, wild type; YFP, yellow fluorescent protein.
Fig 2
Fig 2. Msn4 expression and its contribution to stress preparation increases as cells exit exponential growth.
(A) The contribution of Msn2 and Msn4 to stress preparation changes along the growth curve: cells at different stages along the growth curve (see S6 Fig for growth curve in rich media) were diluted into media containing 1.6 mM H2O2 and were followed by continuous OD measurements to define the time at which growth was first detected. Shown is the percent of repeats with surviving cells of each strain in different cell densities and the time to resume growth (color-coded). (B) Msn4 expression increases along the growth curve in protein and transcript levels, while Msn2 expression remains stable: samples were taken from cells growing along the growth curve. Expression was measured using fluorescent protein fusion (B, left) and transcription profiles (B, right). Shown is the ratio between each measurement to the low OD measurement. (C) MSN4 expression is noisy, while MSN2 expression follows the Poissonian variance: mRNA molecules of MSN2,4 were counted in >4,000 single cells with smFISH in exponentially growing cells (circles) and at OD600 = 4 (stars). Shown are the mean number of molecules at the x-axis and the Fano factor (left) and skewness (middle) of the mRNA distribution at the y-axis. Dashed line represents the Poisson distribution parameters. (Right) smFISH imaging examples. The raw data for (A) are available in S3 Data, for (B) in S4 Data, and for (C) in S1 Data. GFP, green fluorescent protein; OD, Optical Density; SC, synthetic complete; smFISH, single-molecule Fluorescent In Situ Hybridization; WT, wild type.
Fig 3
Fig 3. Redundancy in Msn2 and Msn4 activity.
(A–C) Single cells expressing Msn4-GFP and Msn2-mCherry were visualized using microfluidics-coupled live microscopy. Both proteins were readily visualized when cells were first cultured at intermediate or high OD (because Msn4 is undetectable in low ODs when cells grow exponentially). Cells were tracked as they were exposed to 0.4 M, 1.2 M, or 1.4 M NaCl. Cells were segmented, and the nuclear localization of both proteins was quantified. A representative cell in time in three channels and a quantification of nuclear localization levels of Msn2 (red) and Msn4 (green) are shown in A. Temporal traces of 328 single cells in 1.2 M NaCl, ordered in both columns by the time of Msn4-GFP nuclear localization, are shown in (B) (0.4 M and 1.4 M NaCl in S8 Fig). Correlations between the individual traces of Msn2 versus Msn4 nuclear localization levels in single cells were calculated. Distributions of the correlation coefficients within the same (purple) or in different (gray) cells are shown in C, separately comparing the immediate response (left) and the longer-time dynamics (right). (D) Stress response in rapidly growing cells depends on Msn2 but not Msn4: exponentially growing cells were exposed to the indicated stresses. Genome-wide transcription profiles were measured at 3-minute time resolution following stress induction for the first 60 minutes and 10-minute for the next 30 minutes. The stress response of each gene was summarized by its integrated (log2) change over the time course. The experiment was repeated in wild-type cells, single-deleted cells (Δmsn2, Δmsn4), and double-deleted cells (Δmsn2Δmsn4). Shown are the differences between gene induction of the wild-type versus the single-deletion strains (Δmsn2 or Δmsn4 at the left/right column, respectively). 180 genes are shown, selected and ordered by the average ratio (over all conditions) between wild-type induction and the double MSN2 and MSN4 deletion strain induction. These genes contain stress-induced modules defined by other studies (S10 Fig). (E) Msn2 and Msn4 induce the same set of target genes: during exponential growth, when Msn2 expression is higher than Msn4, deletion of Msn2 results in a significantly stronger effect on stress gene expression (left), but this effect was fully reversed by swapping the Msn2 and Msn4 promoters (middle and right). Each dot represents a target gene and its induction ratio between the indicated strain and the double MSN2 and MSN4 deletion strain. (F) Msn2 and Msn4 in high OD (7.5): when both factors are expressed, stress genes are induced equally. Each dot is an induced target gene. (G) Msn2 and Msn4 bind DNA through a highly conserved DBD: Alignment of Msn2 and Msn4 DBDs and their homologs in 10 species of the Ascomycota phylum that diverged before or after the WGD event (star). Colors indicate amino acid residue types. The raw data for (B,C) are available in S5 Data and for (D–F) are available at SRA under BioProject PRJNA541833. A.U., arbitrary unit; DBD, DNA-Binding Domain; GFP, green fluorescent protein; OD, Optical Density; SRA, Sequence Read Archive; WGD, Whole Genome Duplication.
Fig 4
Fig 4. MSN2 shifted its TSS and gained a stable expression pattern in species that diverged from Saccharomyces cerevisiae following WGD.
(A–B) Three data types were considered. First, we downloaded >230 mRNA expression data sets available in SPELL [44] and compared the variance of MSN2 and MSN4 expression in each data set with more than 20 samples (A, each data set is a dot). Second, we compared the distribution of MSN2 and MSN4 expression levels in two large data sets, representing multiple stress conditions [13] (B, left) or gene deletions [45] (B, right). (C) The MSN2 promoter displays properties of the stable, low-noise type, while MSN4 promoter conforms to the flexible noisy type: the pattern of nucleosome occupancy along the two promoters as defined by Weiner and colleagues [46] is shown in blue shade. Arrows represent TSS positions, as defined by Park and colleagues [47]. Ellipses denote TF binding sites as defined by MacIsaac and colleagues [48]. TATA box (black circles) is defined as TATA[AT]A[AT]. (D) MSN2 promoter displays an uncharacteristically long 5′ UTR that is conserved in all species that diverged after the WGD event: shown are the promoter maps of MSN2,4 homologs in the indicated species. mRNA 5′ end mapping data from Spealman and colleagues [49] are shown in blue, mRNA 5′ end from this study in red. TATA box is defined as in C. (E) MSN2 homologs are stably expressed along the growth curve, while MSN4 homologs show the flexible expression of the single MSN homologs found in species that diverged from S. cerevisiae prior to the WGD event: shown are expression levels of the MSN2,4 homologs in all indicated species, in 5 time points along the growth curve. Data from Thompson and colleagues [50]. (F) Expression of the Kluyveromyces lactis MSN2,4 homolog shows intermediate flexibility and noise. On the x-axis, the maximal fold change expression of MSN2, MSN4, and the K. lactis homolog (data from Thompson and colleagues [50]) is shown. y-Axes show attributes of the expression distribution measured by smFISH, in MSN2, MSN4, and MSN2 in S. cerevisiae driven by the promoter of the K. lactis homolog. Shown are the Fano factor (left) and the skewness of the distribution normalized to the skewness of a Poisson distribution with the same mean as the data (right). (G) Model: duplication of Msn2,4 resolved conflict between environmental responsiveness and noise: single genes whose expression is sensitive to environmental conditions but will suffer from high noise in nonstressed conditions, limiting the ability to precisely tune intermediate expression levels while maintaining environmental-responsive expression. Gene duplication can resolve this conflict. See text for details. The raw data for (F) are available in S1 Data. smFISH, single-molecule Fluorescent In Situ Hybridization; SPELL, Serial Pattern of Expression Levels Locator; TF, transcription factor; TSS, Transcription Start Site; WGD, Whole Genome Duplication.

Comment in

References

    1. Charoensawan V, Wilson D, Teichmann SA. Genomic repertoires of DNA-binding transcription factors across the tree of life. Nucleic Acids Research. 2010;38: 7364–7377. 10.1093/nar/gkq617 - DOI - PMC - PubMed
    1. Weirauch MT, Hughes TR. A Catalogue of Eukaryotic Transcription Factor Types, Their Evolutionary Origin, and Species Distribution. Subcel Biochem. 2011;52: 25–73. 10.1007/978-90-481-9069-0_3 - DOI - PubMed
    1. Lambert SA, Jolma A, Campitelli LF, Das PK, Yin Y, Albu M, et al. The Human Transcription Factors. Cell. 2018;172: 650–665. 10.1016/j.cell.2018.01.029 - DOI - PubMed
    1. Conant GC, Wolfe KH. Turning a hobby into a job: How duplicated genes find new functions. Nature Reviews Genetics. 2008;9: 938–950. 10.1038/nrg2482 - DOI - PubMed
    1. Soskine M, Tawfik DS. Mutational effects and the evolution of new protein functions. Nature Reviews Genetics. 2010;11: 572–582. 10.1038/nrg2808 - DOI - PubMed

Publication types

MeSH terms

Substances