. 2019 Nov 22;14(11):e0224071.
doi: 10.1371/journal.pone.0224071. eCollection 2019.

Integrated analysis of miRNA landscape and cellular networking pathways in stage-specific prostate cancer

Affiliations

Integrated analysis of miRNA landscape and cellular networking pathways in stage-specific prostate cancer

Shiv Verma et al. PLoS One. .

Abstract

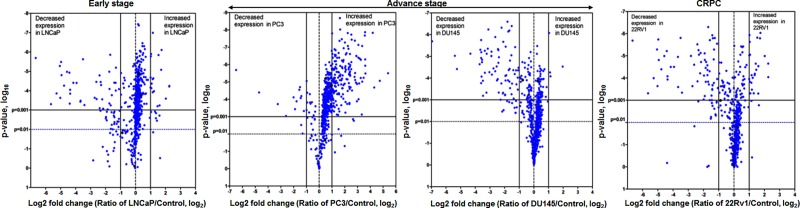
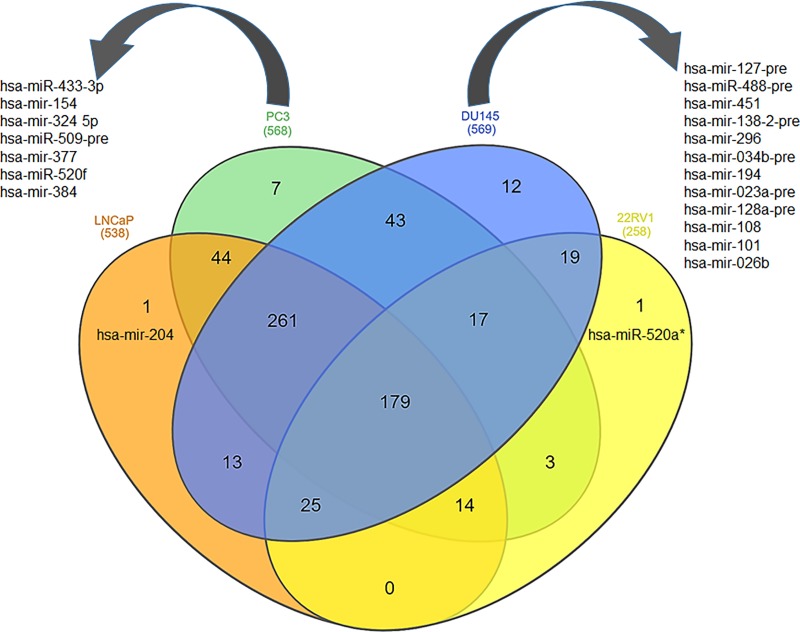
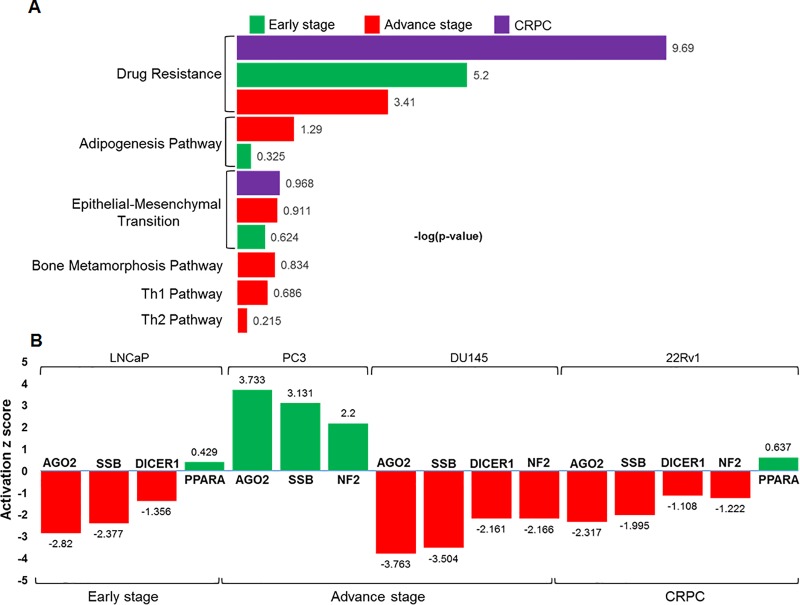
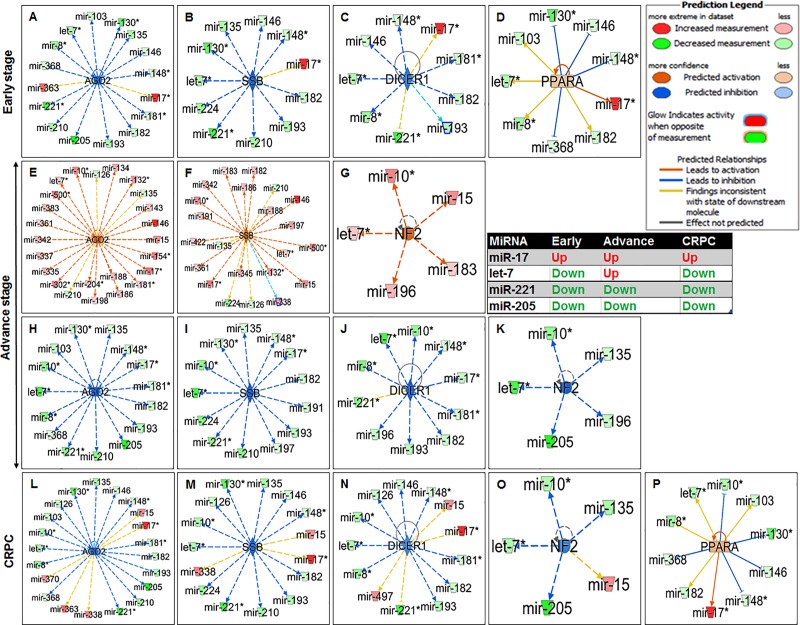
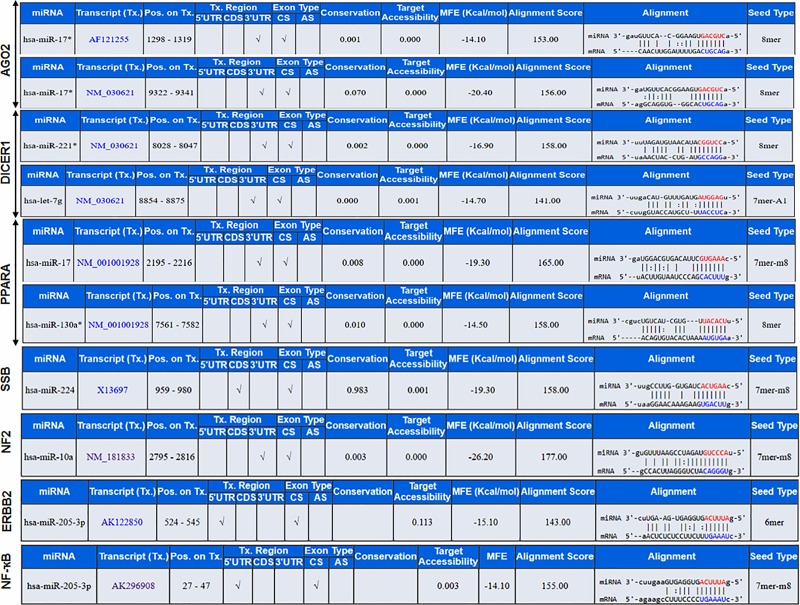
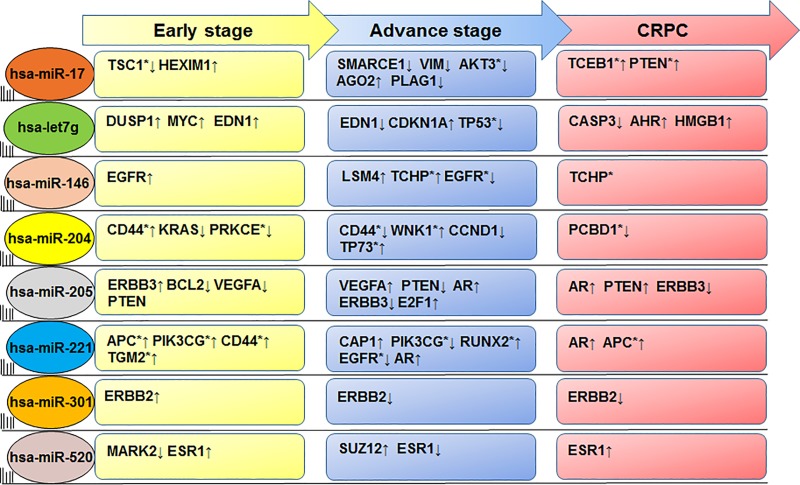
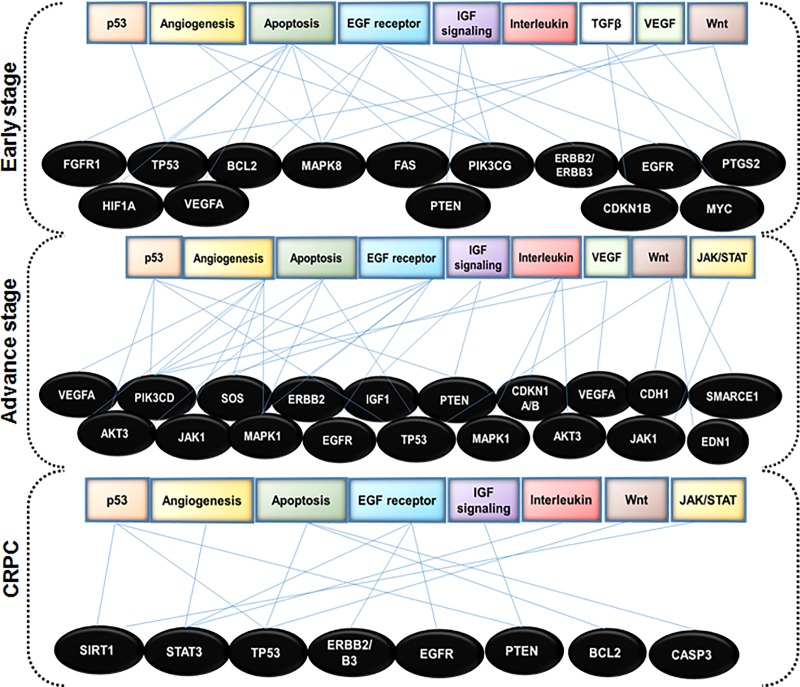
Dysregulation of miRNAs has been demonstrated in several human malignancies including prostate cancer. Due to tissue limitation and variable disease progression, stage-specific miRNAs changes in prostate cancer is unknown. Using chip-based microarray, we investigated global miRNA expression in human prostate cancer LNCaP, PC3, DU145 and 22Rv1 cells representing early-stage, advanced-stage and castration resistant prostate cancer in comparison with normal prostate epithelial cells. A total of 292 miRNAs were differentially expressed with 125 upregulated and 167 downregulated. These miRNAs were involved in pathways including drug resistance drug-efflux, adipogenesis, epithelial-to-mesenchymal transition, bone metamorphosis, and Th1/Th2 signaling. Regulation of miRNAs were interlinked with upstream regulators such as Argonaut 2 (AGO2), Double-Stranded RNA-Specific Endoribonuclease (DICER1), Sjogren syndrome antigen B (SSB), neurofibromatosis 2 (NF2), and peroxisome proliferator activated receptor alpha (PPARA), activated during stage-specific disease progression. Candidate target genes and pathways dysregulated in stage-specific prostate cancer were identified using CS-miRTar database and confirmed in clinical specimens. Integrative network analysis suggested some genes targeted by miRNAs include miR-17, let7g, miR-146, miR-204, miR-205, miR-221, miR-301 and miR-520 having a major effect on their dysregulation in prostate cancer. MiRNA-microarray analysis further identified miR-130a, miR-181, miR-328, miR146 and miR-200 as a panel of novel miRNAs associated with drug resistance drug-efflux and epithelial-to-mesenchymal transition in prostate cancer. Our findings provide evidence on miRNA dysregulation and its association with key functional components in stage-specific prostate cancer.


Conflict of interest statement

The authors have declared that no competing interests exist.

Figures

Fig 1
Fig 1. Volcano plot of miRNA-microarray.
The volcano plot exhibits the relationship between fold-change and significance between the two groups, using a scatter plot view. The y-axis is the negative log2 of P values (a higher value indicates greater significance) and the x-axis is the difference in expression between two experimental groups as measured in log2 space. The blue dots in the figure represents individual miRNAs differentially expressed in four prostate cancer cell lines LNCaP (early-stage), PC3, DU145 (advanced-stage) and 22Rv1 (castration resistant prostate cancer; CRPC). The vertical dotted lines correspond to p value < 0.01 and <0.001, respectively. The horizontal dotted line represents a log 2 fold changes. The left side in the panel corresponds to differentially expressed miRNAs with decreased expression, and the right side in the panel showed miRNA with increased expression.
Fig 2
Fig 2. Prostate cancer disease-specific signature miRNAs.
Venn diagram of the overlapping and unique genes among four prostate cancer cell lines. All four cell lines were represented in orange (LNCaP cells), green (PC3), blue (DU145) and yellow (22Rv1) color and analyzed using p value cut-off < 0.001.
Fig 3
Fig 3. IPA analysis and overrepresented signaling pathways in various prostate cancer cell lines.
(A) The top scored pathways were scrutinized and ranked as per their–log (p-value). (B) Upstream regulators and its activation (green) and inhibition (red) during early-stage, advanced-stage, and CRPC are shown. The values on each bar represent the Z score.
Fig 4
Fig 4. Inhibition and activation state of upstream translational regulators in relation to miRNAs expression in stage-specific prostate cancer.
The red color showed increased expression of miRNA and green showed decreased (glow indicates activity). The orange and blue color showed predicted activation and inhibition. The dashed and bold arrow indicates and predicts whether it leads to activation (orange arrow) or inhibition (blue line and arrow).
Fig 5
Fig 5. Prostate cancer disease specific miRNA-mRNA target interaction.
miRNA: mRNA interaction and its target genes categorized on stage-specific manner viz. early-stage, advance-stage and CRPC progression of prostate cancer. Information in the figure include miRNA:mRNA complex with seed alignment score, binding energy (ΔG) of the hybrid complex.
Fig 6
Fig 6. List of miRNAs and target genes identified using CSmiR-Tar database, miRNAs targets specific genes in prostate tissue and at early, advance and CRPC disease stage.
miRNA regulation of target genes involved in the stage-specific progression of prostate cancer.
Fig 7
Fig 7. Gene ontology analysis of target genes.
Target genes were found to be involved in the molecular function of various signaling pathways in stage-specific prostate cancer progression.

References

    1. Brawley OW. Trends in prostate cancer in the United States. Journal of the National Cancer Institute Monographs. 2012;45:152–6. Epub 09/14. 10.1093/jncimonographs/lgs035 PubMed PMID: 23271766. - DOI - PMC - PubMed
    1. Siegel RL, Miller KD, Jemal A. Cancer statistics, 2019. CA: A Cancer Journal for Clinicians. 2019;69(1):7–34. 10.3322/caac.21551 - DOI - PubMed
    1. Loeb S, Peskoe SB, Joshu CE, Huang W-Y, Hayes RB, Carter HB, et al. Do Environmental Factors Modify the Genetic Risk of Prostate Cancer? Cancer Epidemiology Biomarkers & Prevention. 2015;24(1):213–20. 10.1158/1055-9965.epi-14-0786-t - DOI - PMC - PubMed
    1. Pienta KJ, Bradley D. Mechanisms Underlying the Development of Androgen-Independent Prostate Cancer. Clinical Cancer Research. 2006;12(6):1665 10.1158/1078-0432.CCR-06-0067 - DOI - PubMed
    1. Tindall DJ, Huang H, Grossmann ME. Androgen Receptor Signaling in Androgen-Refractory Prostate Cancer. JNCI: Journal of the National Cancer Institute. 2001;93(22):1687–97. 10.1093/jnci/93.22.1687 - DOI - PubMed

Publication types