. 2020 Jan;24(1):1046-1058.
doi: 10.1111/jcmm.14825. Epub 2019 Nov 22.

CD8+ T cells exhaustion induced by myeloid-derived suppressor cells in myelodysplastic syndromes patients might be through TIM3/Gal-9 pathway

Affiliations

CD8+ T cells exhaustion induced by myeloid-derived suppressor cells in myelodysplastic syndromes patients might be through TIM3/Gal-9 pathway

Jinglian Tao et al. J Cell Mol Med. 2020 Jan.

Abstract

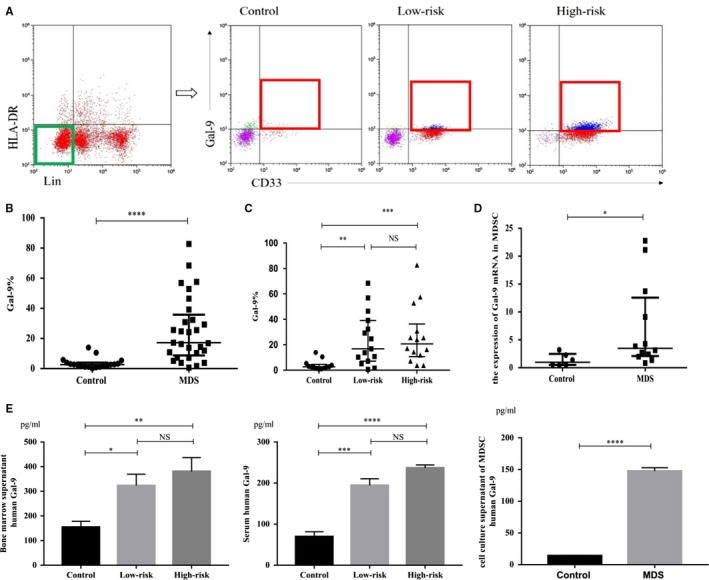
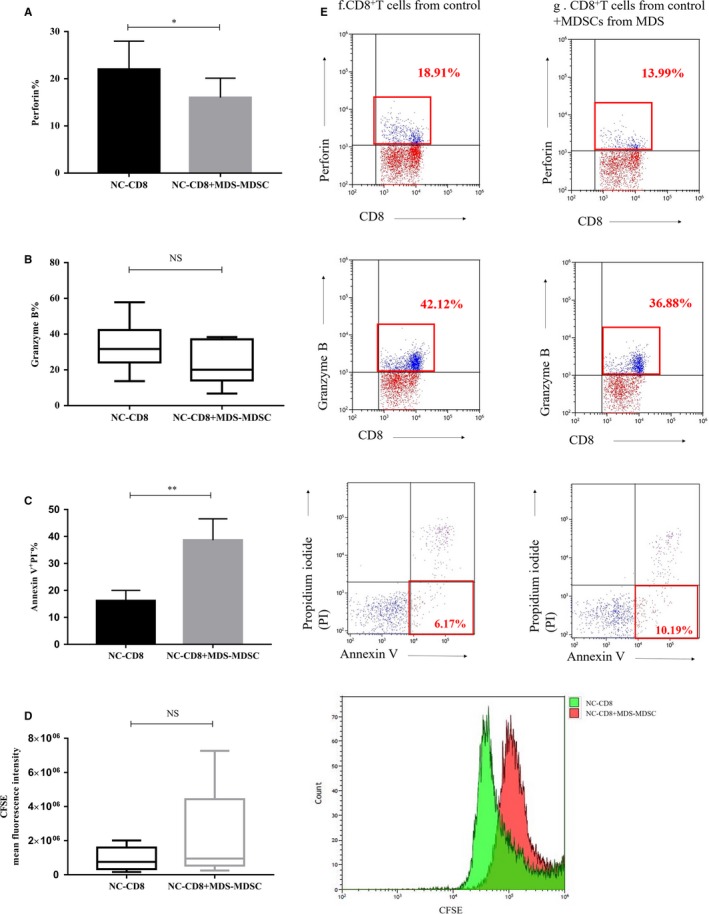
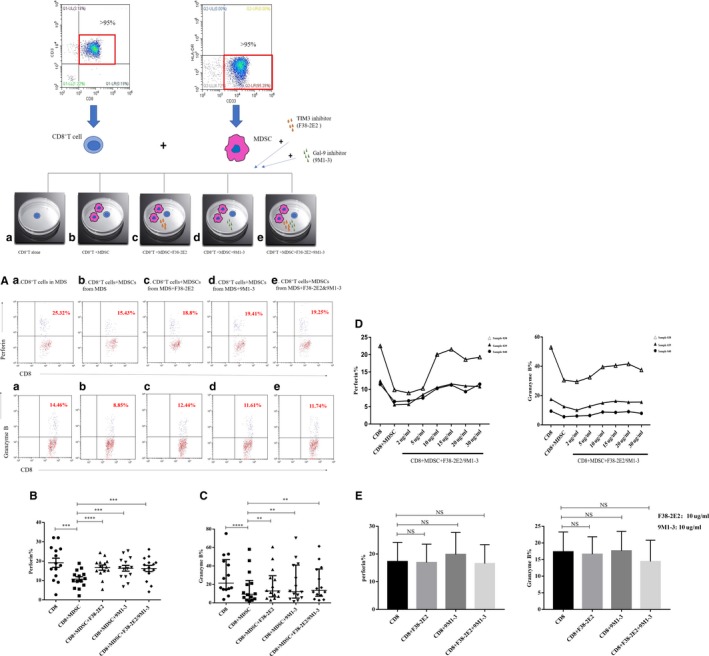
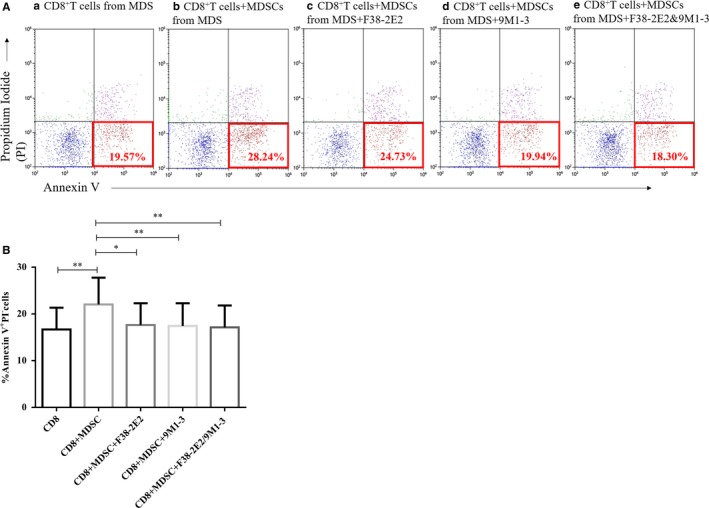
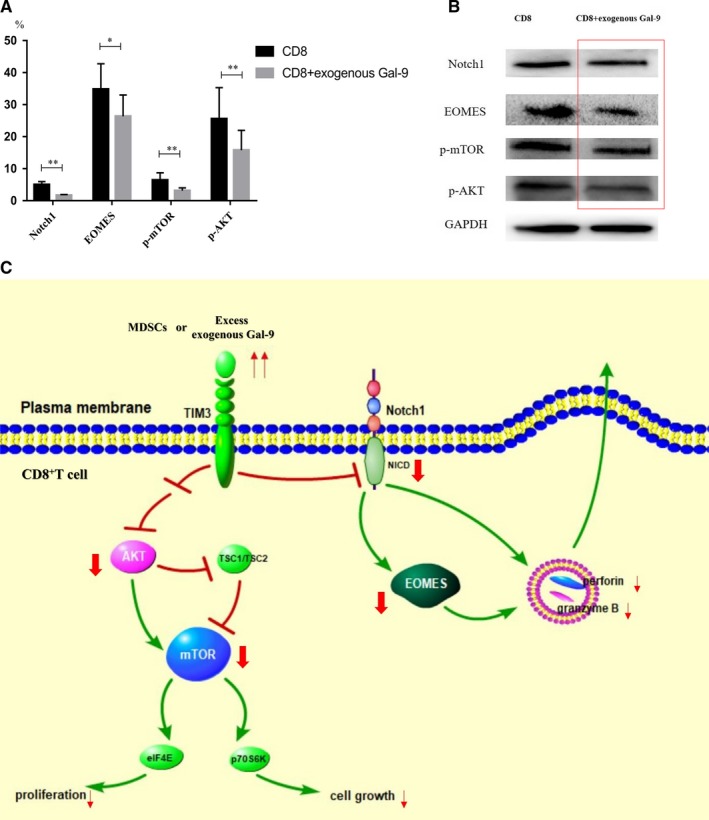
CD8+ T cells play a central role in antitumour immunity, which often exhibit 'exhaustion' in the setting of malignancy and chronic viral infection due to T cell immunoglobulin and mucin domain 3 (TIM3) and myeloid-derived suppressor cells (MDSCs). Our team previously found that overactive MDSCs and exhausted TIM3+ CD8+ T cells were observed in myelodysplastic syndromes (MDS) patients. However, it is not obvious whether MDSCs suppress CD8+ T cells through TIM3/Gal-9 pathway. Here, Gal-9, as the ligand of TIM3, was overexpressed in MDSCs. The levels of Gal-9 in bone marrow supernatants, serum and culture supernatants of MDSCs from MDS patients were elevated. CD8+ T cells from MDS or normal controls produced less perforin and granzyme B and exhibited increased early apoptosis after co-culture with MDSCs from MDS. Meanwhile, the cytokines produced by CD8+ T cells could be partially restored by TIM3/Gal-9 pathway inhibitors. Furthermore, CD8+ T cells produced less perforin and granzyme B after co-culture with excess exogenous Gal-9, and the function of CD8+ T cells was similarly restored by TIM3/Gal-9 pathway inhibitors. Expression of Notch1, EOMES (associated with perforin and granzyme B secretion), p-mTOR and p-AKT (associated with cell proliferation) was decreased in CD8+ T cells from MDS after co-culture with excess exogenous Gal-9. These suggested that MDSCs might be the donor of Gal-9, and TIM3/Gal-9 pathway might be involved in CD8+ T cells exhaustion in MDS, and that TIM3/Gal-9 pathway inhibitor might be the promising candidate for target therapy of MDS in the future.

Keywords: CD8+ T cells; exhaustion; myelodysplastic syndrome.


Conflict of interest statement

The authors confirm that there are no conflicts of interest.

Figures

Figure 1
Figure 1
The expression of Gal‐9 in MDSCs. (A) The cells in the green rectangle are LinHLA‐DR cells, and the cells in the red rectangle are Gal‐9+LinHLA‐DRCD33+ cells. Representative flow cytometry scatter diagrams of Gal‐9 expression in LinHLA‐DRCD33+ cells are shown in control, low‐risk or high‐risk MDS patients. UR upper right quadrant, LR lower right quadrant. Gal‐9+LinHLA‐DRCD33+ cells/LinHLA‐DRCD33+ cells = UR/(UR + LR). (B and C) The dot diagrams present the percentage of Gal‐9+LinHLA‐DRCD33+ cells/LinHLA‐DRCD33+ cells in MDS patients (including low‐risk and high‐risk MDS patients) and in controls. (D) Gal‐9 mRNA in MDSCs by quantitative RT‐PCR. (E) Gal‐9 in bone marrow supernatants, serum and MDSC culture supernatants. *P < .05, **P < .01, ***P < .001, ****P < .0001, NS = not significant
Figure 2
Figure 2
(A‐D) The histogram represents perforin, granzyme B, early apoptosis and the MFI of CFSE in CD8+ T cells from normal controls (NC‐CD8) co‐cultured with MDSCs from MDS patients (MDS‐MDSC) or cultured alone. (E) The cells in the red rectangle represent the expression of perforin, granzyme B and early apoptosis of CD8+ T cells from NC that were cultures alone or co‐cultures with MDSCs from MDS patients. The red flow histogram represents proliferation of CFSE‐labelled NC‐CD8 co‐cultured with MDS‐MDSC, and the green histogram represents NC‐CD8 cultured alone. *P < .05, **P < .01, NS = not significant
Figure 3
Figure 3
Perforin and granzyme B in CD8+ T cells from MDS patients after co‐culture with MDSCs or TIM3/Gal‐9 inhibitors. a: CD8+ T cells alone; b: CD8+ T cells co‐cultured with MDSCs; c: CD8+ T cells+MDSCs+TIM3 inhibitor (F38‐2E2); d: CD8+ T cells+MDSCs+Gal‐9 inhibitor (9M1‐3); e: CD8+ T cells+MDSCs+F38‐2E2+9M1‐3. (A) The upper right quadrant represents the expression of perforin and granzyme B in CD8+ T cells from MDS patients in the five groups. (B) The expression of perforin in the five groups. (C) The expression of granzyme B in the five groups. (D) Effects of different concentrations (2 µg/mL, 5 µg/mL, 10 µg/mL, 15 µg/mL, 20 µg/mL and 30 µg/mL) of inhibitors on perforin and granzyme B expression in CD8+ T cells in three patients (sample 038, 039, and 040). (E) Perforin and granzyme B expression in CD8+ T cells that were cultured without MDSCs in the presence of inhibitors. *P < .05, **P < .01, ***P < .001, ****P < .0001, NS = not significant
Figure 4
Figure 4
Early apoptosis of CD8+ T cells from MDS patients after co‐culture with MDSCs or TIM3/Gal‐9 inhibitors. (A) Scattered dots in the red rectangle represent early apoptosis of CD8+ T cells from MDS patients in the five co‐culture systems. The a. b. c. d. and e. experimental groups represent CD8+ T cells from MDS, CD8+ T cells+MDSCs from MDS, CD8+ T cells+MDSCs+F38‐2E2, CD8+ T cells+MDSCs+9M1‐3 and CD8+ T cells+MDSCs+F38‐2E2+9M1‐3, respectively. (B) The histogram represents early apoptotic cells. *P < .05, **P < .01, NS = not significant
Figure 5
Figure 5
Perforin and granzyme B in CD8+ T cells from MDS patients after co‐culture with excess exogenous Gal‐9 or TIM3/Gal‐9 inhibitors. (A) Flow cytometry scatter diagrams of perforin and granzyme B expression in CD8+ T cells from MDS. a: CD8+ T cells alone; i: CD8+ T cells with excess exogenous Gal‐9; j: CD8+ T cells from MDS with excess exogenous Gal‐9 and F38‐2E2; and k: CD8+ T cells from MDS with excess exogenous Gal‐9 and 9M1‐3. (B and C) The histogram represents the expression of perforin and granzyme B in the four groups. *P < .05, **P < .01, ***P < .001, NS = not significant
Figure 6
Figure 6
The expression levels of Notch1, EOMES, phospho‐mTOR and phospho‐AKT proteins were reduced in CD8+ T cells after co‐culture with exogenous Gal‐9. (A) The histogram representing the expression of Notch1, EOMES, p‐mTOR and p‐AKT by flow cytometry. (B) The expression of Notch1, EOMES, p‐mTOR and p‐AKT by Western blotting. (C) The possible pathogenesis of CD8+ T cells from MDS patients' suppression by MDSCs or excess exogenous Gal‐9. *P < .05; **P < .01

References

    1. Tao J, Li L, Wang Y, Fu R, Wang H, Shao Z. Increased TIM3+CD8+T cells in Myelodysplastic Syndrome patients displayed less perforin and granzyme B secretion and higher CD95 expression. Leuk Res. 2016;51:49‐55. - PubMed
    1. Tao JL, Li LJ, Fu R, et al. Elevated TIM3+ hematopoietic stem cells in untreated myelodysplastic syndrome displayed aberrant differentiation, overproliferation and decreased apoptosis. Leuk Res. 2014;38:714‐721. - PubMed
    1. Jiang H, Fu R, Wang H, Li L, Liu H, Shao Z. CD47 is expressed abnormally on hematopoietic cells in myelodysplastic syndrome. Leuk Res. 2013;37:907‐910. - PubMed
    1. Jan M, Chao MP, Cha AC, et al. Prospective separation of normal and leukemic stem cells based on differential expression of TIM3, a human acute myeloid leukemia stem cell marker. Proc Natl Acad Sci USA. 2011;108:5009‐5014. - PMC - PubMed
    1. Asayama T, Tamura H, Ishibashi M, et al. Functional expression of Tim‐3 on blasts and clinical impact of its ligand galectin‐9 in myelodysplastic syndromes. Oncotarget. 2017;8:88904‐88917. - PMC - PubMed

Publication types

MeSH terms