. 2019 Nov 22;20(Suppl 9):406.
doi: 10.1186/s12859-019-2886-2.

Genes with human-specific features are primarily involved with brain, immune and metabolic evolution

Affiliations

Genes with human-specific features are primarily involved with brain, immune and metabolic evolution

Mainá Bitar et al. BMC Bioinformatics. .

Abstract

Background: Humans have adapted to widespread changes during the past 2 million years in both environmental and lifestyle factors. This is evident in overall body alterations such as average height and brain size. Although we can appreciate the uniqueness of our species in many aspects, molecular variations that drive such changes are far from being fully known and explained. Comparative genomics is able to determine variations in genomic sequence that may provide functional information to better understand species-specific adaptations. A large number of human-specific genomic variations have been reported but no currently available dataset comprises all of these, a problem which contributes to hinder progress in the field.

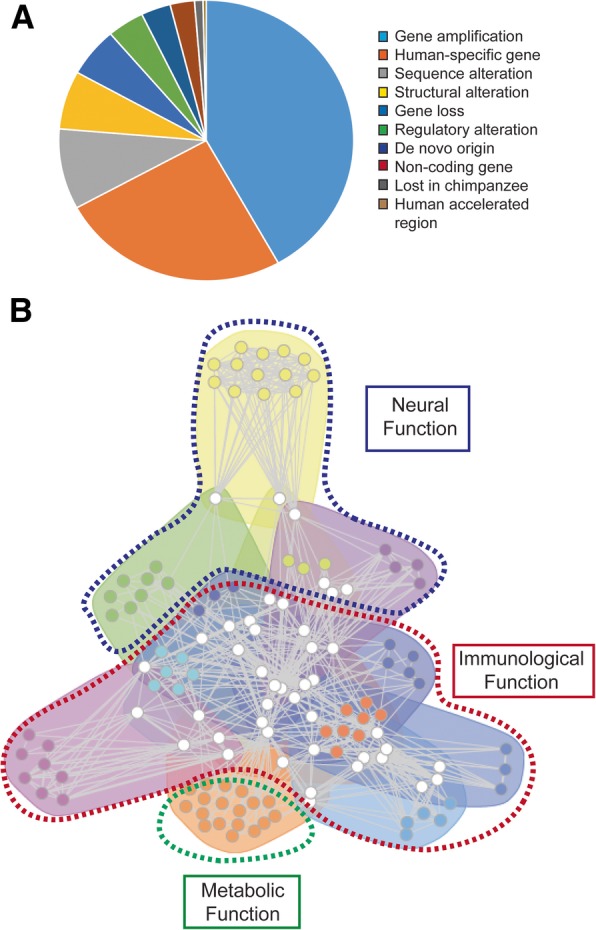
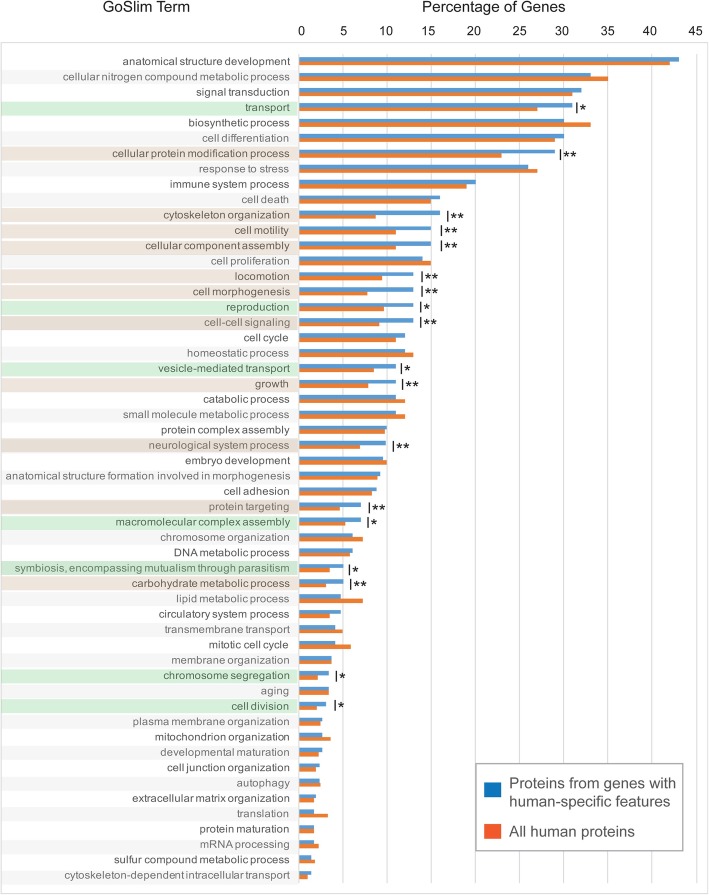
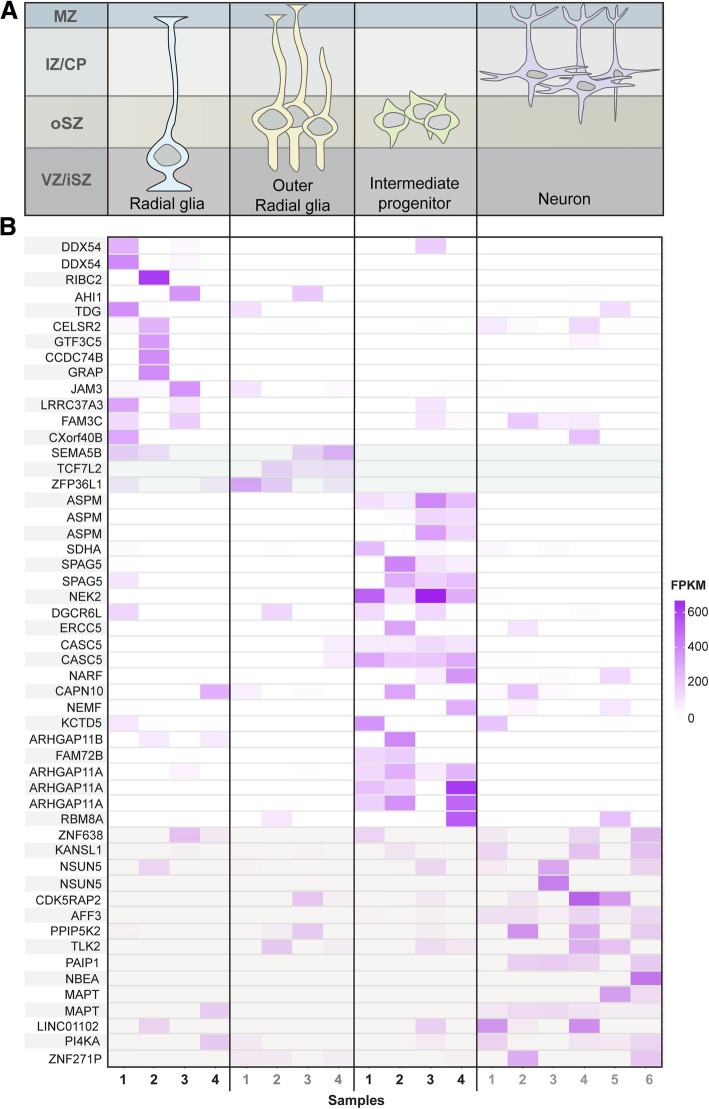
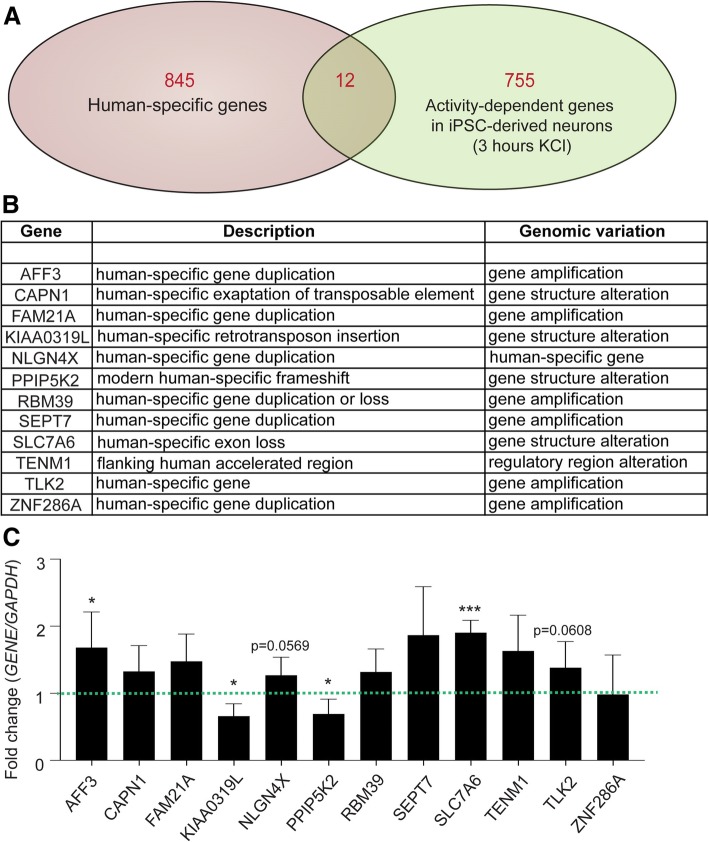
Results: Here we critically update high confidence human-specific genomic variants that mostly associate with protein-coding regions and find 856 related genes. Events that create such human-specificity are mainly gene duplications, the emergence of novel gene regions and sequence and structural alterations. Functional analysis of these human-specific genes identifies adaptations to brain, immune and metabolic systems to be highly involved. We further show that many of these genes may be functionally associated with neural activity and generating the expanded human cortex in dynamic spatial and temporal contexts.

Conclusions: This comprehensive study contributes to the current knowledge by considerably updating the number of human-specific genes following a critical bibliographic survey. Human-specific genes were functionally assessed for the first time to such extent, thus providing unique information. Our results are consistent with environmental changes, such as immune challenges and alterations in diet, as well as neural sophistication, as significant contributors to recent human evolution.

Keywords: Brain; Gene expression; Glia; Human-specific; Metabolism; Neuron.


Conflict of interest statement

All authors declare that they have no competing interests.

Figures

Fig. 1
Fig. 1
a The pie chart illustrates the distribution of 845 genes with human-specific features with regards to the underlying mechanism from which they originated. A more specific classification is shown in the Additional Table 1, as well as additional information for each gene. b Functional network of metagroups defined by GeneTerm Linker, represented with FGNet. The 23 metagroups were filtered to allow visualization of metagroups comprising functional terms at organism level and omitting metagroups describing broad cell-level or molecular-level characteristics, which can be assessed from Additional Fig. 1. The color scheme was maintained in all networks to allow comparison
Fig. 2
Fig. 2
Evidence for enrichment of different gene ontology (GO) terms within the set of genes with human-specific features. Blue bars represent the percentage of genes with human-specific features for which at least one protein product has been associated to a specific GO term. Red bars represent this percentage at the gene level for the entire set of human proteins. Statistical significance of each differentially represented term was assessed using a Fisher exact test. Significant p-values are indicated (*p-value ≤0.1; **p-value ≤0.05) and the correspondent term is highlighted in green or brown, respectively
Fig. 3
Fig. 3
a The upper panel depicts differentiation stages of human radial glia cells. Rows represent the correspondent brain location and columns represent the different cell types along a virtual timeline. Cell location starts from the inner layer of the ventricular zone (the inner subventricular zone VZ/iSZ) and goes through the outer subventricular zone (oSZ) to the region between the intermediate zone and the cortical plate (IZ/CP). b The heatmap is a graphical representation of normalized read counts (FPKM values) across all samples for each transcript of highly expressed genes with human-specific features. Color intensity varies according to FPKM value as shown in the scale. Highly expressed genes were defined as the top 2000 in terms of FPKM and those that were highly expressed in at least one of the four cell stages were selected. The first 12 genes are highly expressed in radial glial cells, the next 3 genes (light grey shade) in outer radial glia, the further 15 in intermediate progenitor cells and the last 13 (light grey shade) in differentiated neurons. The columns of the heatmap represent different samples of each cell type (the 4 radial glia samples, 4 outer radial glia samples, 4 intermediate progenitor samples and 6 neuron samples)
Fig. 4
Fig. 4
a The diagram represents the intersection between the set of genes with human-specific features and the set of genes that undergo differential expression upon activation of iPSC-derived neurons with KCl for 3 h. b The 12 human-specific differentially expressed genes and their mechanism of origin. c Gene expression was investigated by RT-qPCR using RNA from the same samples of active and inactive iPSC-derived neurons. Fold-change values were calculated relative to GAPDH expression. Statistical significance was performed using unpaired t-test (*p-value < 0.05; ***p value < 0.001)

References

    1. Tattersall I. Why was human evolution so rapid? In:Human Paleontology and Prehistory. 2017:1:1–9.
    1. Zink KD, Lieberman DE. Impact of meat and lower Palaeolithic food processing techniques on chewing in humans. Nature. 2017;531:500–503. - PubMed
    1. Weyrich LS, Duchene S, Soubrier J, Arriola L, Llamas B, Breen J, Morris AG, Alt KW, Caramelli D, Dresely V, et al. Neanderthal behaviour, diet, and disease inferred from ancient DNA in dental calculus. Nature. 2017;544:357–361. - PubMed
    1. Dutrillaux B. Chromosomal evolution in primates: tentative phylogeny from Microcebus murinus (prosimian) to man. Hum Genet. 1979;48:251–314. - PubMed
    1. Muller S, Stanyon R, Finelli P, Archidiacono N, Wienberg J. Molecular cytogenetic dissection of human chromosomes 3 and 21 evolution. Proc Natl Acad Sci U S A. 2000;97:206–211. - PMC - PubMed