. 2019 Nov 22;16(1):233.
doi: 10.1186/s12974-019-1628-8.

Midbrain microglia mediate a specific immunosuppressive response under inflammatory conditions

Affiliations

Midbrain microglia mediate a specific immunosuppressive response under inflammatory conditions

Miguel Angel Abellanas et al. J Neuroinflammation. .

Abstract

Background: Inflammation is a critical process for the progression of neuronal death in neurodegenerative disorders. Microglia play a central role in neuroinflammation and may affect neuron vulnerability. Next generation sequencing has shown the molecular heterogeneity of microglial cells; however, the variability in their response to pathological inputs remains unknown.

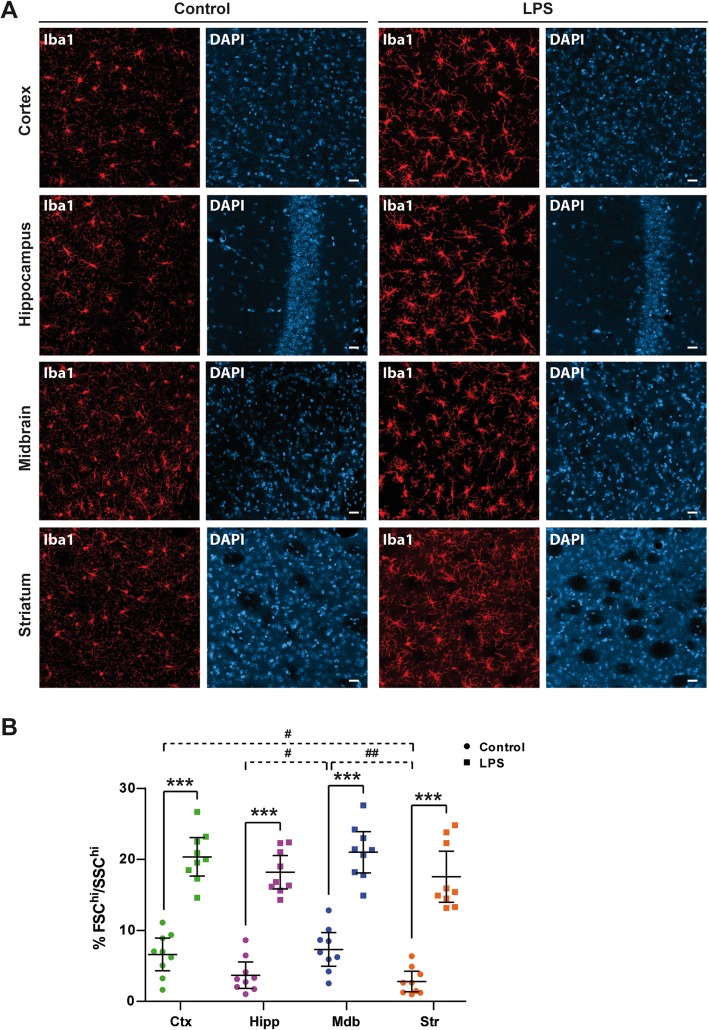
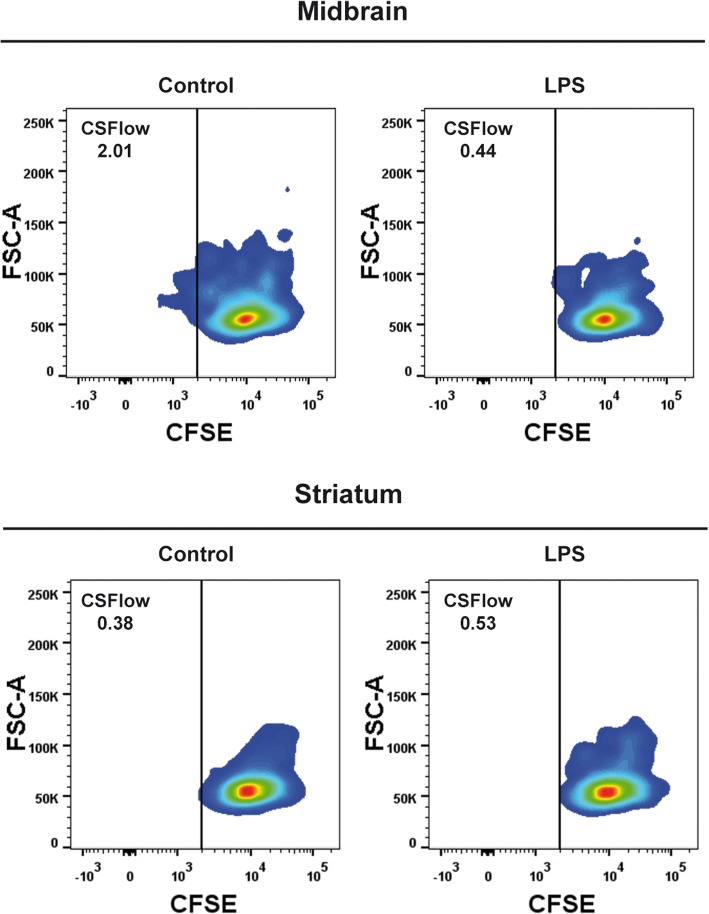
Methods: To determine the effect of an inflammatory stimulus on microglial cells, lipopolysaccharide (LPS) was administered peripherally to mice and the inflammatory status of the cortex, hippocampus, midbrain, and striatum was assessed. Microglial activation and interaction with the immune system were analyzed in single cell suspensions obtained from the different brain regions by fluorescence-activated cell sorting, next generation RNA sequencing, real-time PCR, and immunohistochemical techniques. Antigen-presenting properties of microglia were evaluated by the ability of isolated cells to induce a clonal expansion of CD4+ T cells purified from OT-II transgenic mice.

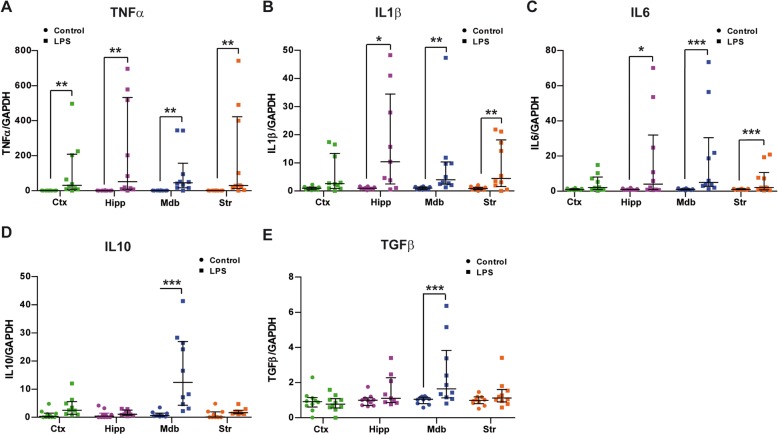
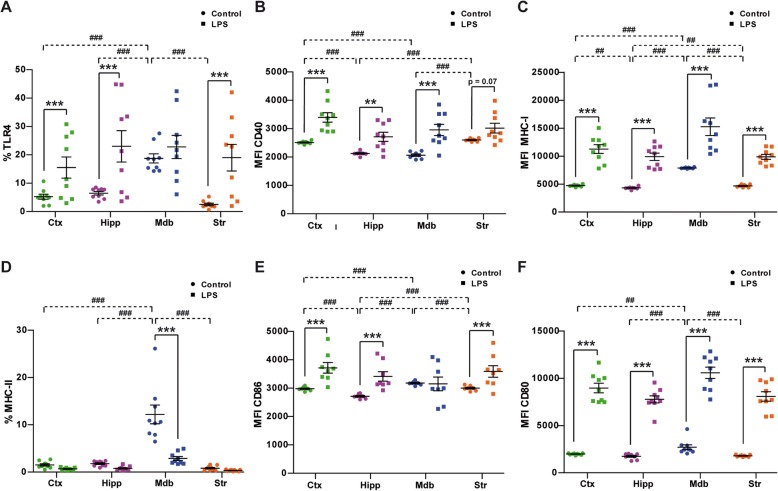
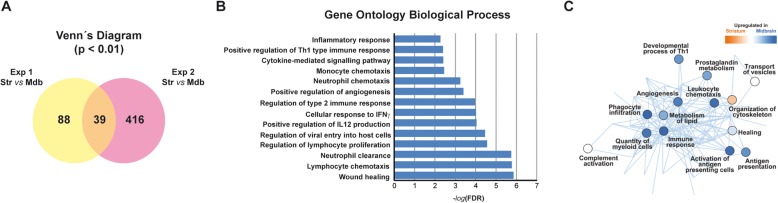
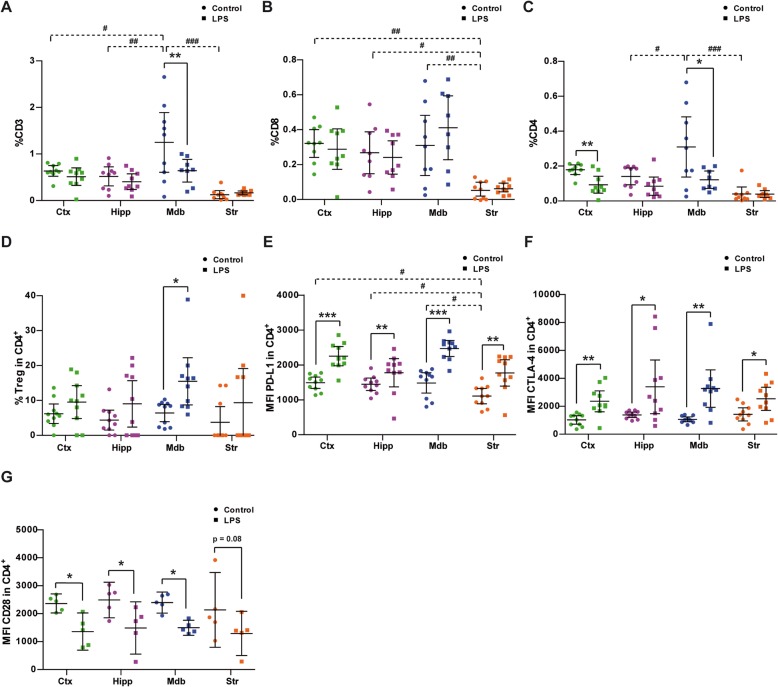
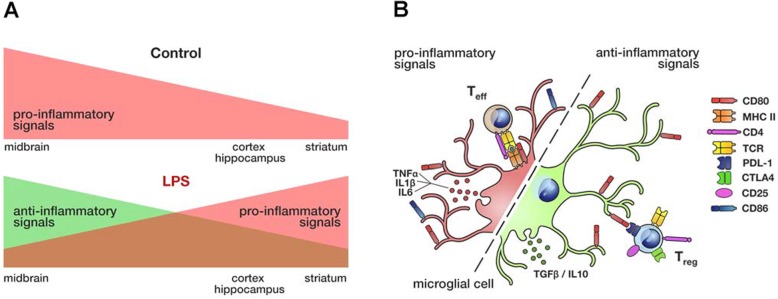
Results: Under steady-state conditions, the midbrain presented a high immune-alert state characterized by the presence of two unique microglial subpopulations, one expressing the major histocompatibility complex class II (MHC-II) and acting as antigen-presenting cells and another expressing the toll-like receptor 4 (TLR4), and by the presence of a higher proportion of infiltrating CD4+ T cells. This state was not detected in the cortex, hippocampus, or striatum. Systemic LPS administration induced a general increase in classic pro-inflammatory cytokines, in co-inhibitory programmed death ligand 1 (PD-L1), and in cytotoxic T lymphocyte antigen 4 (CTLA-4) receptors, as well as a decrease in infiltrating effector T cells in all brain regions. Interestingly, a specific immune-suppressive response was observed in the midbrain which was characterized by the downregulation of MHC-II microglial expression, the upregulation of the anti-inflammatory cytokines IL10 and TGFβ, and the increase in infiltrating regulatory T cells.

Conclusions: These data show that the midbrain presents a high immune-alert state under steady-state conditions that elicits a specific immune-suppressive response when exposed to an inflammatory stimulus. This specific inflammatory tone and response may have an impact in neuronal viability.

Keywords: Antigen-presenting cells; Innate immunity; LPS; MHC-II; Microglia; Midbrain; TGFβ; Treg.


Conflict of interest statement

The authors declare that they have no competing interests.

Figures

Fig. 1
Fig. 1
LPS affects the size and complexity of microglial cells. a Representative images showing Iba-1 immunoreactivity in the cortex (Ctx), hippocampus (Hipp), midbrain (Mdb), and striatum (Str) of control and LPS-treated mice. b The size and complexity of the cells were measured by flow cytometry based on the forward scatter (FSC) and side scatter (SSC), respectively. Microglial cells were purified from the Ctx, Hipp, Mdb, and Str of saline and LPS-treated mice, and the data from nine animals per group are represented with their mean ± 95% CI. Two-way ANOVA followed by contrast test with Šidák adjustment was used to determine LPS effects in each region (***p < 0.001). One-way ANOVA was used to analyze the region effects in control animals (#p < 0.05, ##p < 0.01). Scale bar 20 μm
Fig. 2
Fig. 2
Effect of LPS on cytokine expression. Real-time PCR for TNFα (a), IL1β (b), IL6 (c), IL10 (d), and TGFβ (e) from the cortex (Ctx), hippocampus (Hipp), midbrain (Mdb), and striatum (Str) of control and LPS-treated animals. The results are expressed as the ratio to the control group. Median with interquartile range from ten animals per group is represented. The effect of LPS was analyzed pair by pair with the median test: *p < 0.05, **p < 0.01, ***p < 0.001
Fig. 3
Fig. 3
Analysis of inflammatory cell surface markers on microglial cells after LPS exposure. Microglial cells were purified from the cortex (Ctx), hippocampus (Hipp), midbrain (Mdb), and striatum (Str) from control and LPS-treated mice. The expression of inflammatory cell surface markers was assayed in the CD45lowCD11b+ fraction of cells by flow cytometry. Data obtained were analyzed by two-way ANOVA followed by pairwise comparisons with Šidák adjustment to determine the effect of LPS in each region. Significant p values for interaction (Pint) were validated with a permutation test (Per test). The region effect in control animals was analyzed by one-way ANOVA followed by a contrast analysis with Šidák adjustment. a Percentage of CD45lowCD11b+ cells expressing TLR4, Pint < 0.001, Per test 95% CI 0–0.004. b MFI of CD40. c MFI of MHC-I. d Percentage of MHC-II cells, Pint < 0.001, Per test 95% CI 0–0.004. e MFI of CD86, Pint < 0.001, Per test 95% CI 0–0.003. f MFI of CD86. The data are from eight to nine animals per group and are represented as the mean ± 95% CI. Significant effect of LPS in each region: **p < 0.01, ***p < 0.001. Significant differences between regions in control animals: ##p < 0.01, ###p < 0.001
Fig. 4
Fig. 4
Antigen-presenting capacity of microglia from the midbrain and striatum. Representative density plots from one experiment of flow cytometry analysis of CFSE-stained CD4+ T cells co-cultured during 7 days with microglia are shown. Microglial cells were purified from the midbrain (upper row) or the striatum (lower row) of control and LPS-treated mice. The fraction of CD4+ T cells that proliferated and showed a low CFSE staining is included in each plot. Carboxyfluorescein succinimidyl ester; FSC, forward scatter
Fig. 5
Fig. 5
Transcriptome analysis of microglial cells purified from the striatum and midbrain. The data were obtained from two independent experiments, the first (Exp 1) with N = 2 mice and the second one (Exp 2) with N = 3 mice. a Venn diagram of the genes differentially expressed between the striatum (Str) and midbrain (Mdb) in the two independent experiments (p < 0.01). The intersection shows the common genes (39) expressed differentially in the 2 experiments. b Enrichment analysis of Gene Ontology biological processes of genes overexpressed in the midbrain using PANTHER. Overrepresentation test and Fisher’s Exact test with a false discovery rate (FDR < 0.01) multiple test correction. c Ingenuity Pathway Analysis of functions regulated by the differentially expressed genes. The intensity of the circle’s color reflects activation or inhibition intensity based on the z-scores, and the nodes represent the genes and their connections to functions
Fig. 6
Fig. 6
Rearrangement of the T cell subpopulations upon LPS stimulation. Cells were purified from the cortex (Ctx), hippocampus (Hipp), midbrain (Mdb), and striatum (Str). The expression of lymphocyte cell surface markers was analyzed by flow cytometry, and data were analyzed by two-way ANOVA followed by pairwise comparisons with Šidák adjustment to determine the effect of LPS in each region. Significant p values for interaction (Pint) were validated with a permutation test (Per test). The region effect in control animals was analyzed by one-way ANOVA followed by a contrast analysis with Šidák adjustment. a CD3+, Pint = 0.03, Per test 95% CI 0.022–0.045; b CD8+; c CD4+, Pint = 0.03, Per test 95% CI 0.019–0.041; d CD4+CD25+Foxp3+ (Treg) lymphocytes; e PD-L1; f CTLA-4; and g CD28 performed on single cell suspensions from control and LPS-treated mice. The results are represented as the percentage of positive cells from the total viable cells isolated (ac), as the percentage of the total CD4+ cells (d), and as the MFI in CD4+ cells (eg). The data from eight to nine (af) and five (g) animals per group are shown as the mean ± 95% CI. Significant effect of LPS in each region: *p < 0.05, **p < 0.01. Significant differences between regions in control animals: #p < 0.05, ##p < 0.01, ###p < 0.01
Fig. 7
Fig. 7
Unique properties and specific responses of midbrain microglia to LPS. a Microglial cells from the midbrain are balanced towards a primed state, a constitutive state of immune alert compared to microglia from other brain regions. Upon LPS stimulation, microglia from the midbrain switch to a potent immunosuppressive phenotype. This response differs from that observed in the striatum, cortex, or hippocampus. b Pro-inflammatory phenotype of microglial cells includes stronger MHC-II, CD80, and CD86 expression, and better antigen-presenting capability and T cell recruitment. These changes are mediated or accompanied by stronger production of the classical pro-inflammatory cytokines. The anti-inflammatory phenotype of microglial cells is characterized by the downregulation of MHC-II expression and consequently the loss of antigen-presenting capability. Immunosuppressive microglia express high levels of CD80 without any change in their CD86 expression. CD80 may counteract the CD4 T cell response through its interaction with CTLA-4 and PD-L1 on activated T cells. The recruitment of Tregs and the production of immunosuppressive cytokines are also indicators of this anti-inflammatory state

References

    1. Hanisch U-K, Kettenmann H. Microglia: active sensor and versatile effector cells in the normal and pathologic brain. Nat Neurosci. 2007;10:1387–1394. doi: 10.1038/nn1997. - DOI - PubMed
    1. Prinz M, Erny D, Hagemeyer N. Ontogeny and homeostasis of CNS myeloid cells. Nat Immunol Nature Publishing Group. 2017;18:385–392. doi: 10.1038/ni.3703. - DOI - PubMed
    1. Olson JK, Miller SD. Microglia initiate central nervous system innate and adaptive immune responses through multiple TLRs. J Immunol. 2004;173:3916–3924. doi: 10.4049/jimmunol.173.6.3916. - DOI - PubMed
    1. Rock KL, Latz E, Ontiveros F, Kono H. The sterile inflammatory response. Annu Rev Immunol. 2010;28:321–342. doi: 10.1146/annurev-immunol-030409-101311. - DOI - PMC - PubMed
    1. Thundyil J, Lim K-L. DAMPs and neurodegeneration. Ageing Res Rev. 2015;24:17–28. doi: 10.1016/j.arr.2014.11.003. - DOI - PubMed