

High content phenotypic screening identifies serotonin receptor modulators with selective activity upon breast cancer cell cycle and cytokine signaling pathways
- PMID: 31757681
- PMCID: PMC6961118
- DOI: 10.1016/j.bmc.2019.115209
High content phenotypic screening identifies serotonin receptor modulators with selective activity upon breast cancer cell cycle and cytokine signaling pathways
Abstract
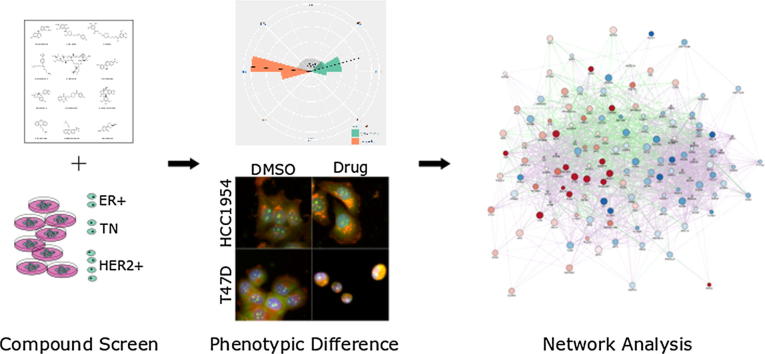
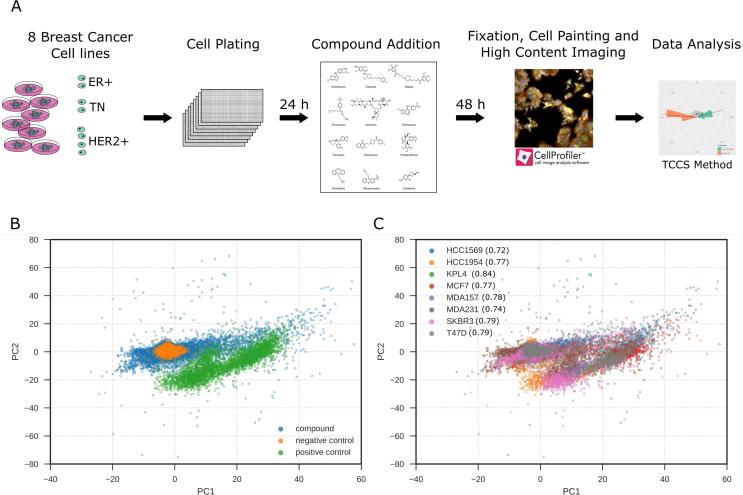
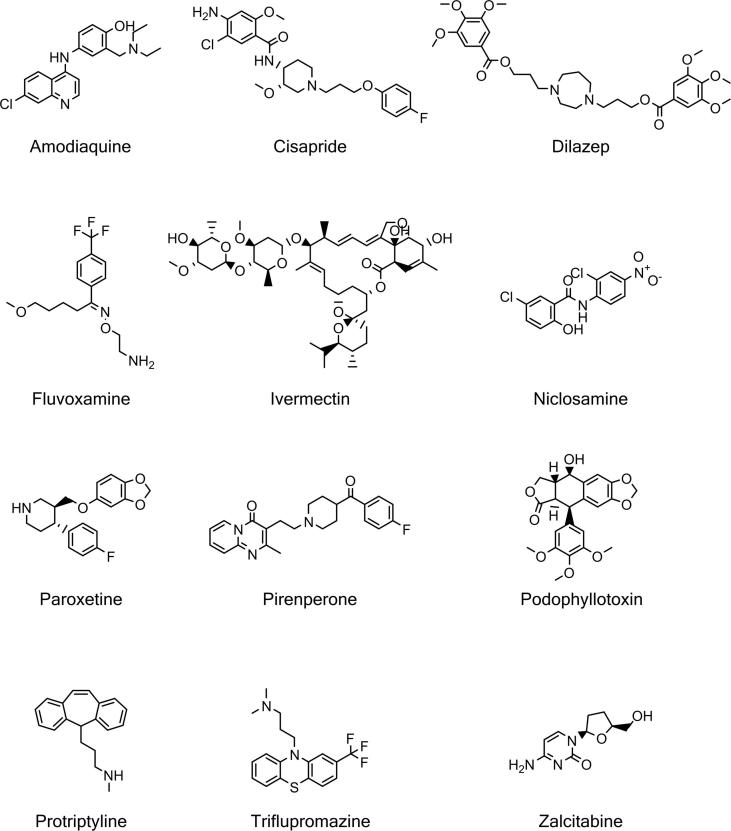
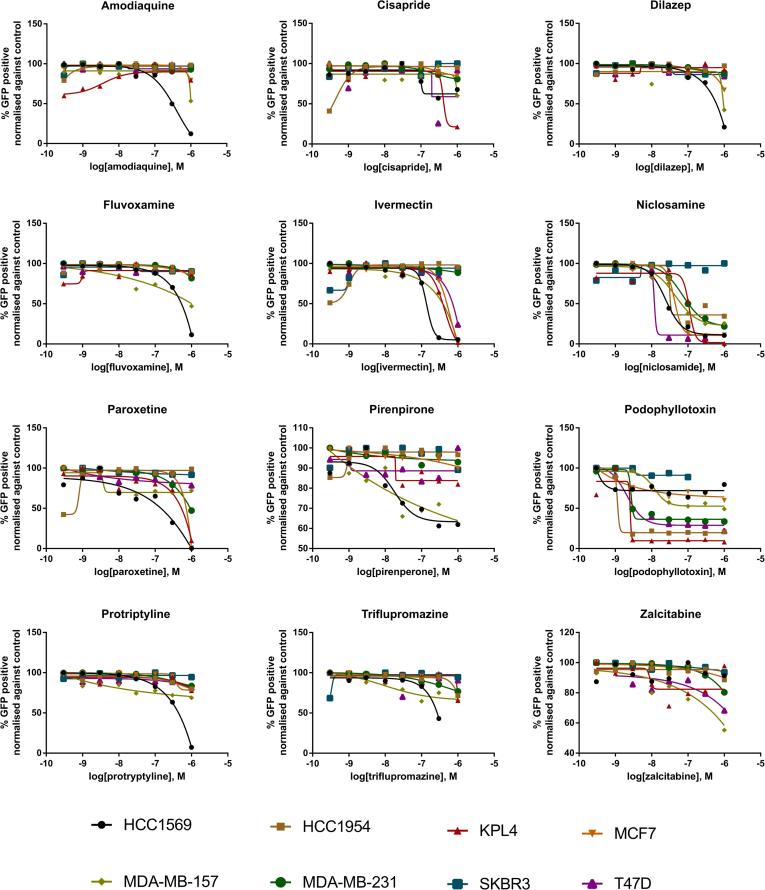
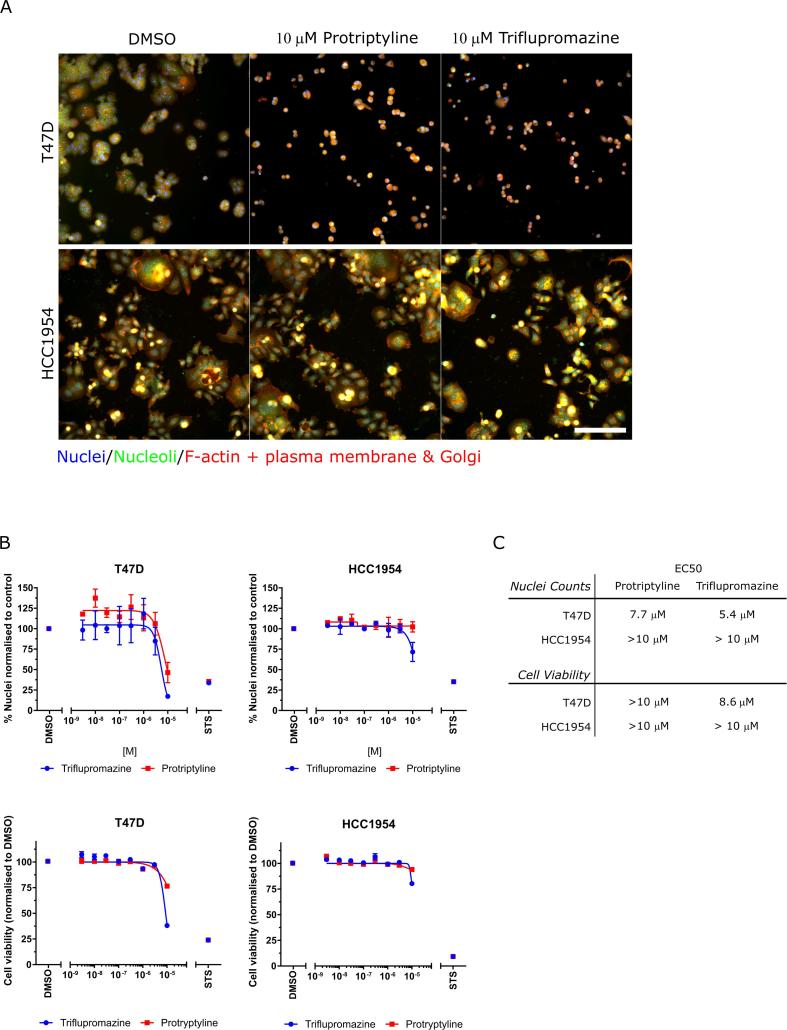
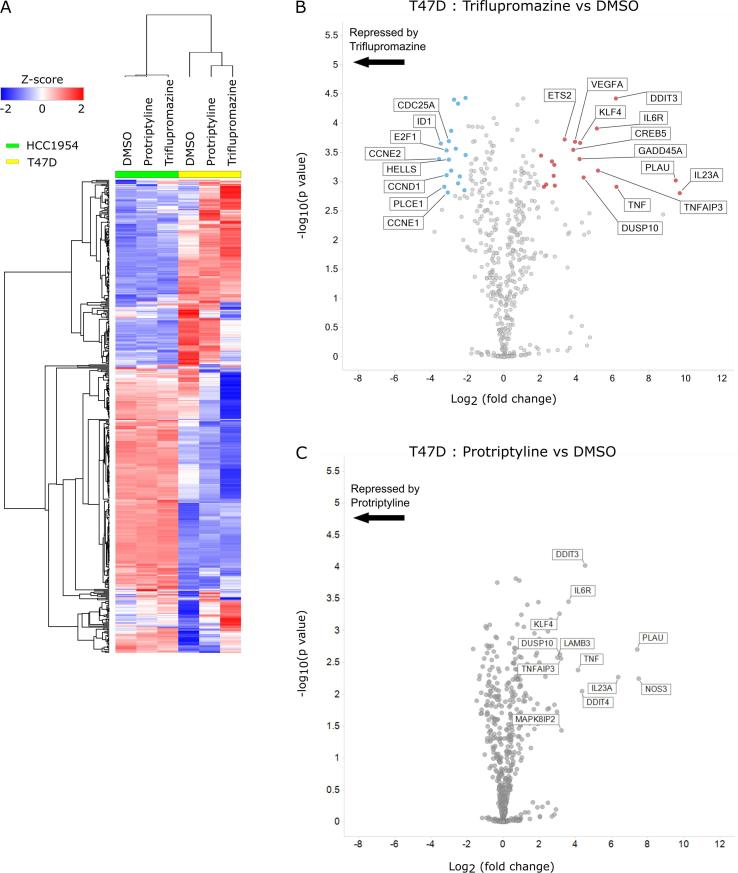
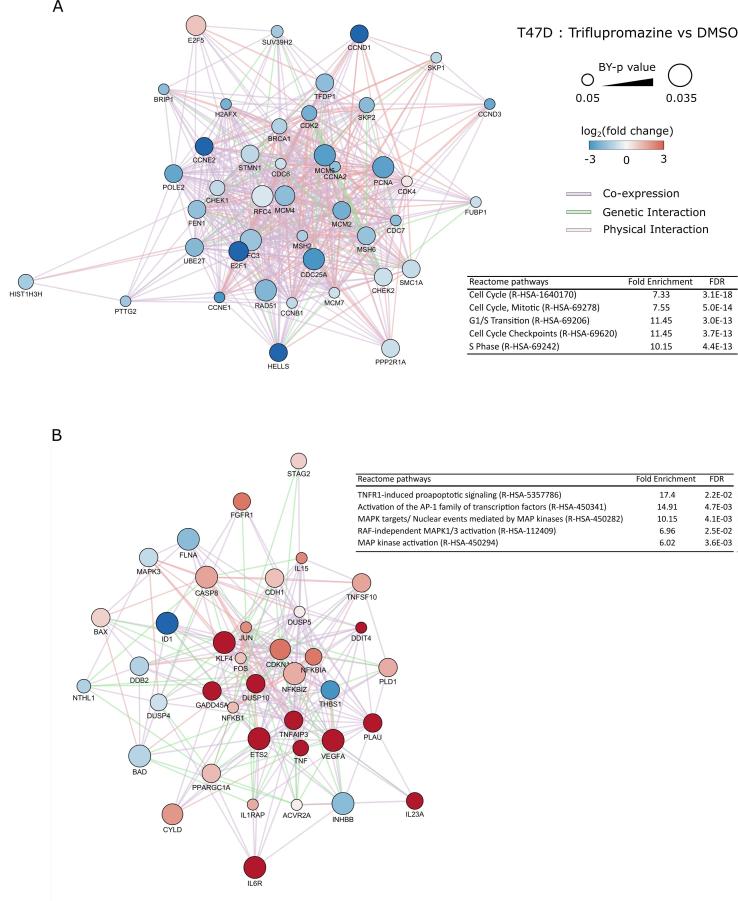
Heterogeneity in disease mechanisms between genetically distinct patients contributes to high attrition rates in late stage clinical drug development. New personalized medicine strategies aim to identify predictive biomarkers which stratify patients most likely to respond to a particular therapy. However, for complex multifactorial diseases not characterized by a single genetic driver, empirical approaches to identifying predictive biomarkers and the most promising therapies for personalized medicine are required. In vitro pharmacogenomics seeks to correlate in vitro drug sensitivity testing across panels of genetically distinct cell models with genomic, gene expression or proteomic data to identify predictive biomarkers of drug response. However, the vast majority of in vitro pharmacogenomic studies performed to date are limited to dose-response screening upon a single viability assay endpoint. In this article we describe the application of multiparametric high content phenotypic screening and the theta comparative cell scoring method to quantify and rank compound hits, screened at a single concentration, which induce a broad variety of divergent phenotypic responses between distinct breast cancer cell lines. High content screening followed by transcriptomic pathway analysis identified serotonin receptor modulators which display selective activity upon breast cancer cell cycle and cytokine signaling pathways correlating with inhibition of cell growth and survival. These methods describe a new evidence-led approach to rapidly identify compounds which display distinct response between different cell types. The results presented also warrant further investigation of the selective activity of serotonin receptor modulators upon breast cancer cell growth and survival as a potential drug repurposing opportunity.
Keywords: Breast cancer; Cell Painting; High content imaging; Pathway analysis; Pharmacogenomics; Phenotypic screening; Serotonin; Triflupromazine.
Copyright © 2019 The Authors. Published by Elsevier Ltd.. All rights reserved.
Conflict of interest statement
The authors declare that they have no known competing financial interests or personal relationships that could have appeared to influence the work reported in this paper.
Figures
References
-
- McDermott U. Next-generation sequencing and empowering personalised cancer medicine. Drug Discov Today. 2015;20:1470–1475. - PubMed
-
- Kruglyak K.M., Lin E., Ong F.S. Next-generation sequencing in precision oncology: challenges and opportunities. Exp Rev Mol Diagn. 2014;14:635–637. - PubMed
-
- Lynch T.J., Bell D.W., Sordella R. Activating mutations in the epidermal growth factor receptor underlying responsiveness of non-small-cell lung cancer to gefitinib. N Engl J Med. 2004;350:2129–2139. - PubMed
-
- Vogel C.L., Cobleigh M.A., Tripathy D. Efficacy and safety of trastuzumab as a single agent in first-line treatment of HER2-overexpressing metastatic breast cancer. J Clin Oncol. 2002;20:719–726. - PubMed
-
- Paez J.G., Janne P.A., Lee J.C. EGFR mutations in lung cancer: correlation with clinical response to gefitinib therapy. Science. 2004;304:1497–1500. - PubMed
Publication types
MeSH terms
Substances
Grants and funding
LinkOut - more resources
Full Text Sources
