. 2019 Nov 22;4(41):eaay6039.
doi: 10.1126/sciimmunol.aay6039.

A divergent transcriptional landscape underpins the development and functional branching of MAIT cells

Affiliations

A divergent transcriptional landscape underpins the development and functional branching of MAIT cells

H-F Koay et al. Sci Immunol. .

Abstract

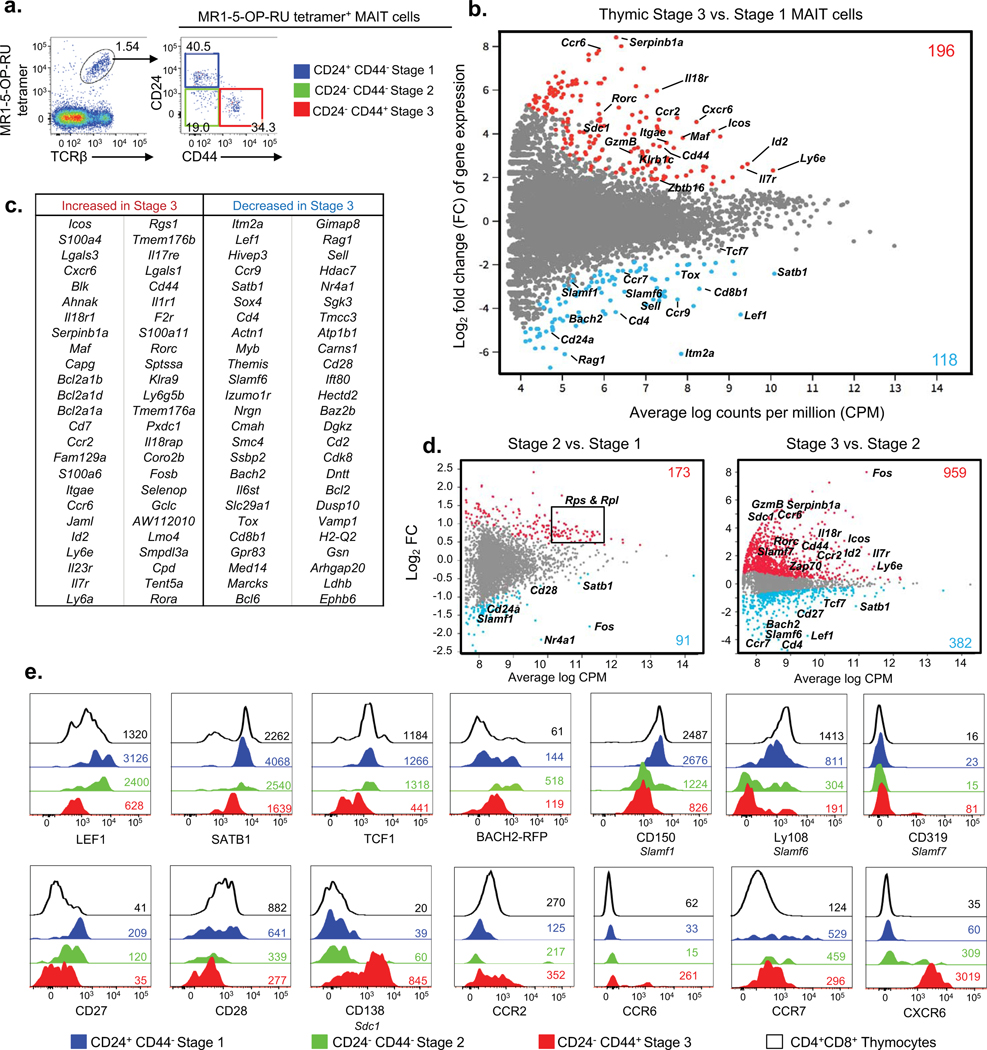
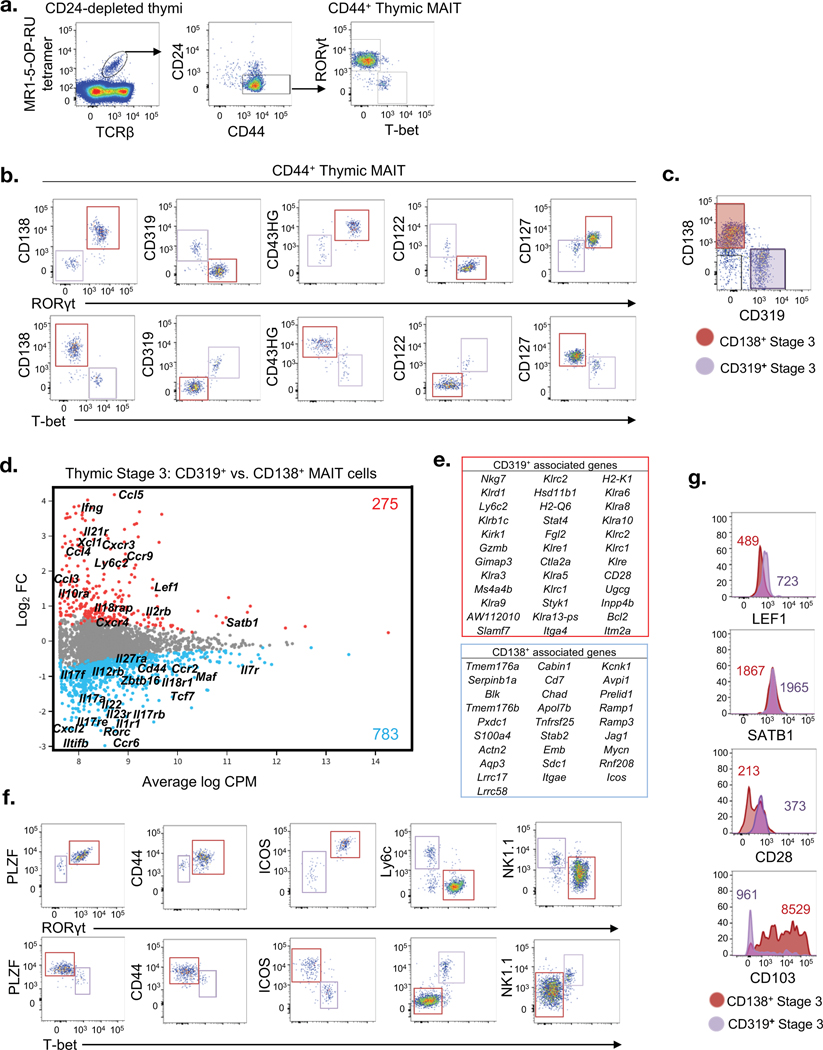
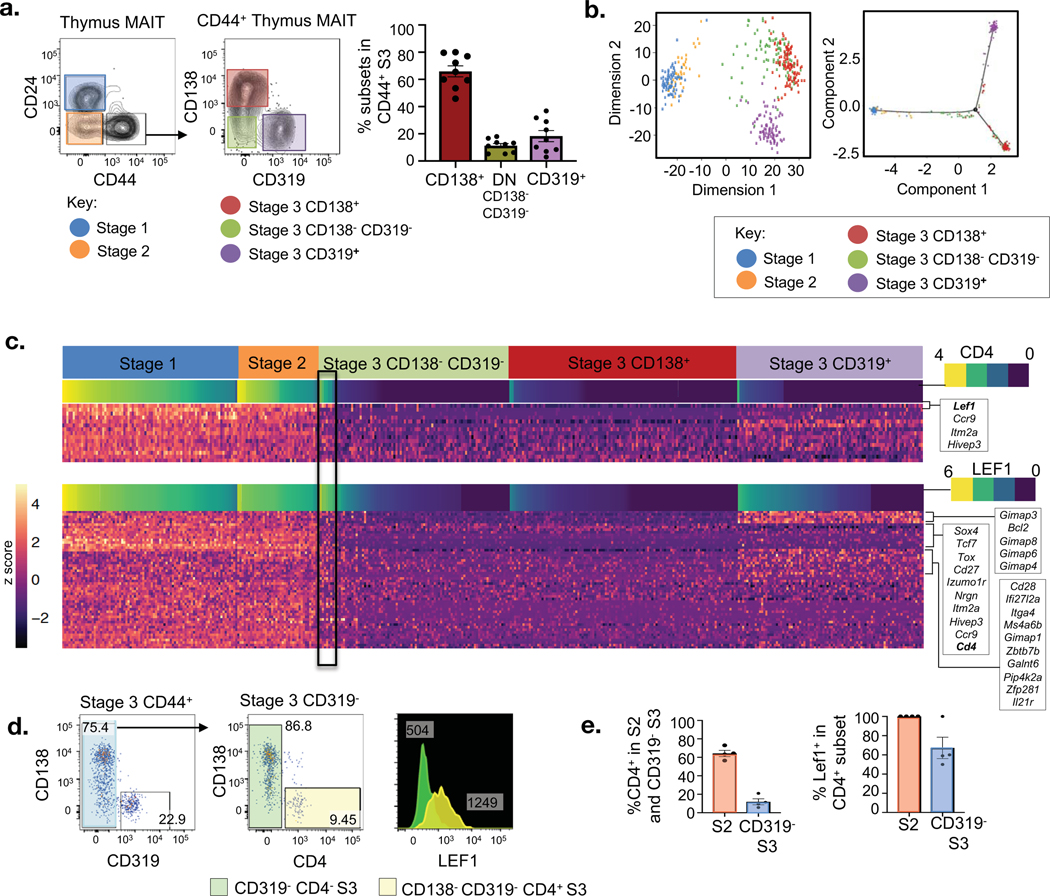
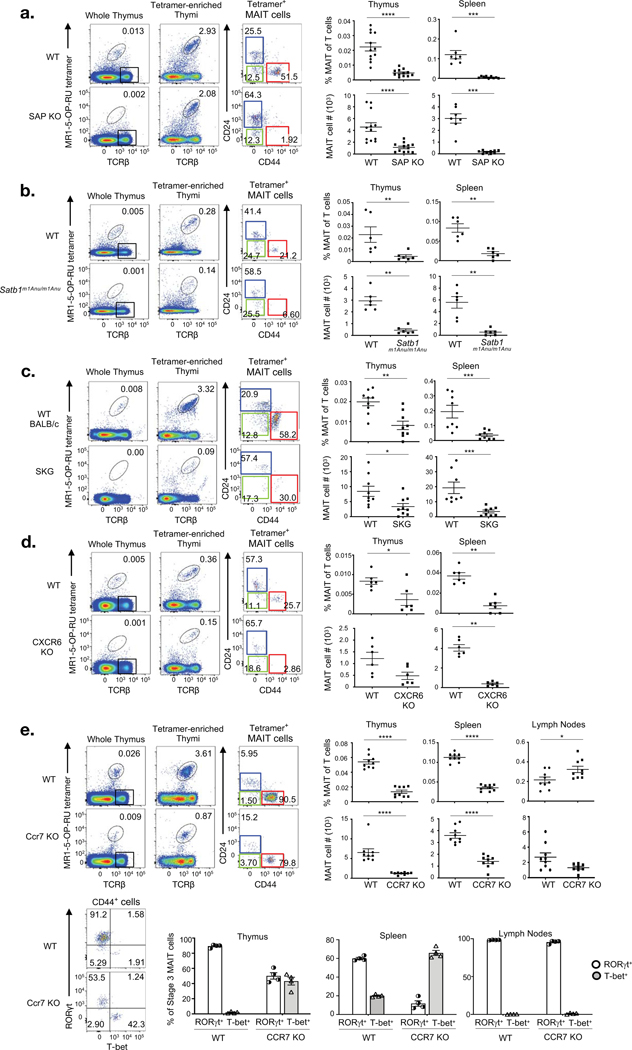
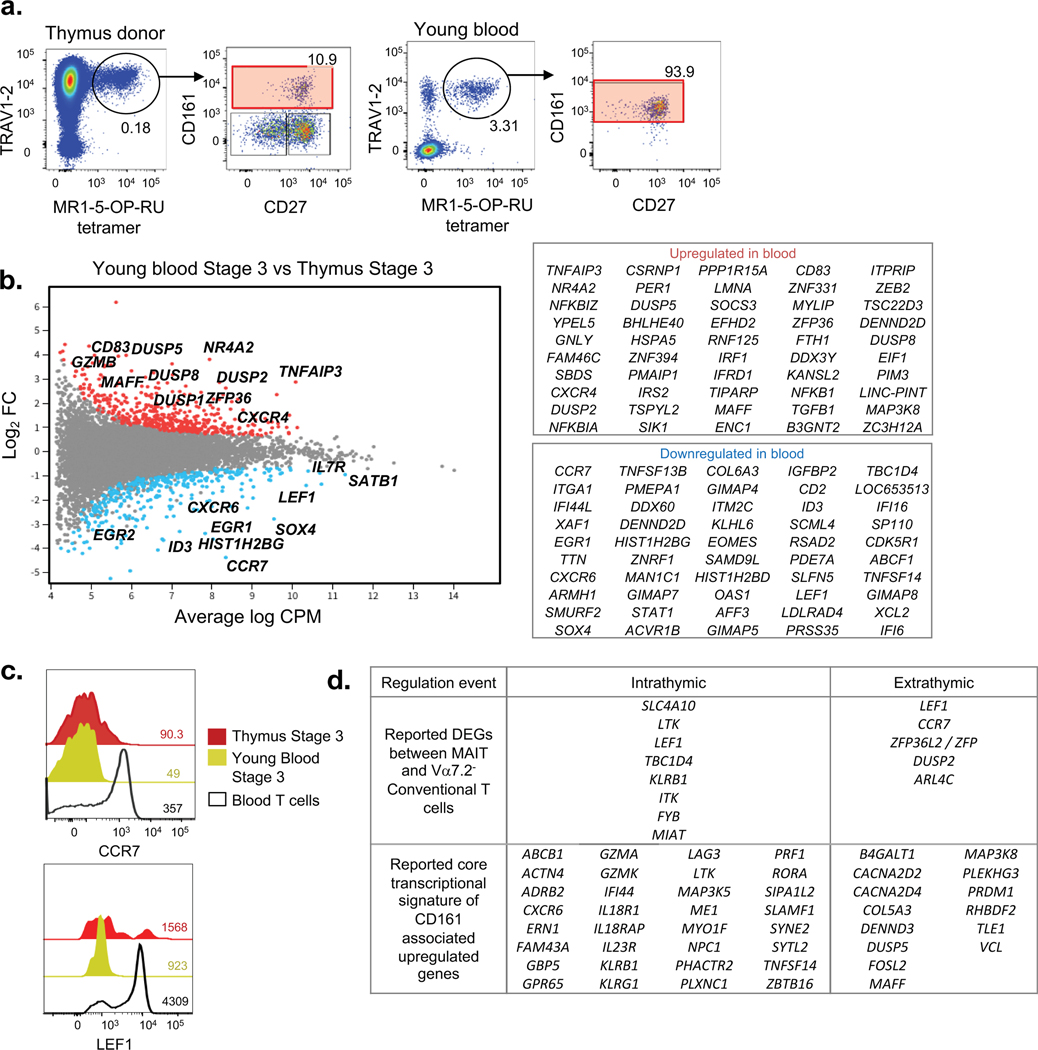
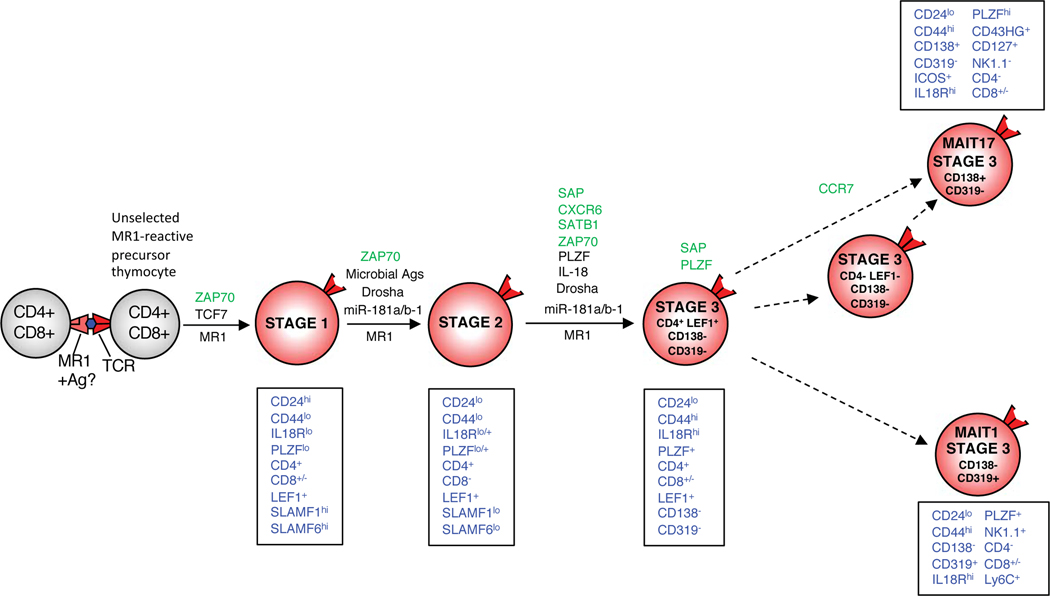
MR1-restricted mucosal-associated invariant T (MAIT) cells play a unique role in the immune system. These cells develop intrathymically through a three-stage process, but the events that regulate this are largely unknown. Here, using bulk and single-cell RNA sequencing-based transcriptomic analysis in mice and humans, we studied the changing transcriptional landscape that accompanies transition through each stage. Many transcripts were sharply modulated during MAIT cell development, including SLAM (signaling lymphocytic activation molecule) family members, chemokine receptors, and transcription factors. We also demonstrate that stage 3 "mature" MAIT cells comprise distinct subpopulations including newly arrived transitional stage 3 cells, interferon-γ-producing MAIT1 cells and interleukin-17-producing MAIT17 cells. Moreover, the validity and importance of several transcripts detected in this study are directly demonstrated using specific mutant mice. For example, MAIT cell intrathymic maturation was found to be halted in SLAM-associated protein (SAP)-deficient and CXCR6-deficient mouse models, providing clear evidence for their role in modulating MAIT cell development. These data underpin a model that maps the changing transcriptional landscape and identifies key factors that regulate the process of MAIT cell differentiation, with many parallels between mice and humans.


Conflict of interest statement

Competing interests:

J.Mc. and D.P.F. are named inventors on a patent application (PCT/AU2013/000742, WO2014005194) and J.Y.W.M., Z.C., J.Mc. and D.P.F. are named inventors on another patent application (PCT/AU2015/050148, WO2015149130) involving MR1 ligands for MR1-restricted MAIT cells owned by University of Queensland, Monash University and University of Melbourne. The remaining authors declare no competing financial interests.

Figures

Figure 1.
Figure 1.. Transcriptomic analysis of mouse MAIT cell development.
a. Flow cytometric analysis of 3 stages of mouse thymic MAIT cells post MR1–5-OP-RU tetramer enrichment. MAIT cell stages are defined with CD24 and CD44; stage 1 (S1, CD24+CD44) in blue, stage 2 (S2, CD24CD44) in green and stage 3 (S3, CD24CD44+) in red. b. MD plot showing gene expression comparison of bulk-cell purified stage 3 versus stage 1 MAIT cells. Colored dots indicate genes significantly up-regulated in stage 3 (red) and stage 1 (blue). Colored numbers represent the total number of differentially expressed genes (DEG). (c) Table lists the top 50 most DEGs within each subset. b, c. Data are from 3 pooled biological replicates each generated from a pool of thymi from five mice. d. Gene expression comparison of single-cell purified stage 2 versus stage 1 (left) and stage 3 versus stage 2 (right) MAIT cells. e. Phenotypic analysis of thymic MAIT cell stages for expression of transcription factors LEF1 (encoded by gene Lef1), SATB1 (Satb1), TCF1 (Tcf7), Bach2 (Bach2); SLAM molecules CD150 (Slamf1), Ly108 (Slamf6), and CD319 (Slamf7); costimulation receptors CD27 (Cd27) and CD28 (Cd28); glycoprotein CD138 (Sdc1) and chemokine receptors CCR2 (Ccr2), CCR6 (Ccr6), CCR7 (Ccr7) and CXCR6 (Cxcr6). Histograms depict stage 1 MAIT cells in blue, stage 2 MAIT cells in green, stage 3 MAIT cells in red, CD4+CD8+ double positive (DP) thymocytes in black. Coloured numbers indicate mean fluorescence intensity values (MFI) of each marker for the respective cell population. a, e. Data are representative of at least 2 independent experiments with a total of 2 separate samples (pools of 3 thymi).
Figure 2.
Figure 2.. Bifurcation and transcriptomic comparison of mature mouse MAIT cells.
a. Flow cytometric analysis of mature mouse thymic MAIT cells post HSA-complement mediated depletion showing RORγt and T-bet expression in CD44+ stage 3 MAIT cells. b. Panel of markers showing expression of CD138 (Sdc1), CD319 (Slamf7), CD43HG (Spn), CD122 (Il2rb) and CD127 (Il7r) relative to RORγt and T-bet in stage 3 MAIT cells. (c) Flow cytometry profile of stage 3 MAIT cells co-stained with CD138 and CD319. d. Gene expression comparison of purified CD319+ versus CD138+ stage 3 MAIT cells. Colored dots indicate genes significantly up-regulated in CD319+ cells (red) and CD138+ cells (blue). Colored numbers represent the total number of DEGs. e. Tables list genes enriched corresponding to CD319+ (red, top) and CD138+ (blue, bottom) MAIT cell subsets. f. Flow cytometry analysis for expression of PLZF, CD44, ICOS, Ly6c and NK1.1 relative to RORγt+ and T-bet+ mature MAIT cells. g. LEF1, SATB1, CD28 and CD103 expression on CD138+ and CD319+ stained mature MAIT cells. Coloured numbers indicate mean fluorescence intensity values (MFI) of each marker for the respective CD138+ or CD319+ MAIT cells. a-c, f-g. Data are representative of at least 2 independent experiments.
Figure 3.
Figure 3.. Lineage diversification within stage 3 of MAIT cell development
a. Flow cytometry profile of mouse MAIT cell subsets present within the mouse thymus single-cell sorted for RNA-sequencing analysis. Graph depicts percentages of each stage 3 subpopulation across 8 samples. b. (Left) Principal component analysis (PCA) on the respective sorted subsets in (a), and (Right) Monocole DDRtree showing the clustering of respective MAIT cell subsets. c. Heatmap showing the differentially expressed genes across MAIT cell subsets ordered by decreasing Cd4 (top) and Lef1 (bottom) expression, grouped across developmental subsets. (n = 363 in total, n = 75 stage 1, n = 34 stage 2, n = 81 CD138 CD319 DN stage 3, n = 95 CD138+ stage 3, n = 78 CD319 stage 3). d. Flow cytometry analysis mature CD44+ MAIT cells for CD138 and CD319 expression (left). Analysis of CD4+ subset (yellow) from mature CD44+ CD319 MAIT cells (middle). Histogram overlay analysis of LEF1 expression between CD319 and CD138CD319 CD4+ stage 3 MAIT cells (right). e. Scatter plot graph shows percentage of CD4+ subset within stage 2 and CD319 stage 3 MAIT cells. Graph shows percentage LEF1+ cells within CD4+ S2 and CD4+ S3 MAIT cell populations.
Figure 4.
Figure 4.. Identification of SAP, SATB1, Zap70, CXCR6, and CCR7 as key factors that regulate MAIT cell development with gene-deleted mice.
a-e. 3 panels depicting analysis of MAIT cells WT control mice and SAP KO (a), Satb1m1Anu/m1Anu (b), SKG (c), CXCR6 KO (d) and CCR7 KO (e) mice. Left panel of flow cytometry analysis show detection of MAIT cells from whole and MR1–5-OP-RU tetramer enriched thymus of respective mice, analysis of MR1-tetramer enriched MAIT cells for CD24 and CD44 expression. Scatter graphs depict absolute numbers and percentage of MAIT cells of T cells in thymus and spleen (a-e) and lymph nodes (e) of the respective mouse strains. Bar graphs in (e) show the proportion of RORγt and T-bet subset of stage 3 MAIT cells in WT and CCR7 KO thymus, spleen and lymph nodes. Data are representative of 2 independent experiments with a total of 6–9 mice per group (a-e; mean ± SEM) *P<0.1 **P<0.01 ***P<0.001, ****P<0.0001 (Mann-Whitney rank sum U test (a-e)).
Figure 5.
Figure 5.. Transcriptomic analysis of human MAIT cell development.
a. Flow cytometric analysis of 3 stages of human Vα7.2+ thymic MAIT cells of CD3+ cells pre- and post TRAV1–2 enrichment. MAIT cell stages are defined with CD27 and CD161; stage 1 (S1, CD27CD161) in blue, stage 2 (S2, CD27+CD161) in green and stage 3 (S3, CD27+/−CD161+) in red. b. MD plot showing gene expression comparison of bulk-cell purified stage 3 versus stage 1 human MAIT cells. Colored dots indicate genes significantly up-regulated in stage 3 (red) and stage 1 (blue). Colored numbers represent the total number of differentially expressed genes (DEG). c. Table lists the top 50 most DEGs within each subset. d. Gene expression comparison of purified stage 2 versus stage 1 human MAIT cells, and stage 3 versus stage 2 human MAIT cells. b-d. Data are representative from 2 separate sorts, with a total of 8 donor samples. (e) Phenotypic analysis of human thymic MAIT cell stages for expression of transcription factors SATB1, LEF1, TCF1, CD1 molecules CD1a, b and d, HLA-A,B,C, and chemokine receptors CCR5 and CCR6. Histograms depict stage 1 MAIT cells in blue, stage 2 MAIT cells in green, stage 3 MAIT cells in red, CD4+CD8+ double positive (DP) thymocytes in black. f. Flow cytometry analysis of CD4+ (yellow) and CD4 (pink) CD161+ thymic MAIT cells for LEF1 expression. Scatter plots show percentage CD4+ cells within CD161+ thymic MAIT cells and percentage LEF1+ cells within this CD4+ population. (e,f) Data indicate mean ± SEM and are representative of at least 3 experiments using 3–7 separate donor samples.
Figure 6.
Figure 6.. Transcriptomic analysis of extrathymic MAIT cell development.
a. Flow cytometry profile with CD27 and CD161 expression of Vα7.2+ MAIT cells of CD3+ cells from young (thymus donor) and adult peripheral blood sample. b. MD plot showing gene expression comparison of bulk-cell purified stage 3 MAIT cells from young peripheral blood vs thymus sample and associated list of most differentially regulated genes. Data derived from 5 young blood and 3 thymus donor samples. c. Flow cytometry analysis of CCR7 and LEF1 expression on stage 3 thymus MAIT cells, stage 3 young blood MAIT cells, and young blood conventional T cells. Data are representative of at least 3 experiments using 3 separate donor samples. d. Classification of known DEGs between MAIT and conventional T cells, and known core transcriptional signature of CD161-associated upregulated genes into intrathymic (between thymic stage 3 vs stage 1) and extrathymic (between young blood and thymus) regulation events.
Figure 7.
Figure 7.. A new model of MAIT cell development.
Dashed lines depict likely pathways based on transcriptome analysis. Phenotypic signature of each stage is shown in blue text in boxes. Factors that regulate each differentiation step are depicted above arrow for each relevant steps: Green text represents newly defined factors that support the relevant step, red text represents newly defined factors that inhibit the relevant step, black text represents previously defined factors, from this study. This model is based on mouse MAIT cell development.

References

    1. Godfrey DI, Koay HF, McCluskey J, Gherardin NA, The biology and functional significance of MR1-restricted T cells. Nature Immunology in press, (2019). - PubMed
    1. Kjer-Nielsen L, Corbett AJ, Chen Z, Liu L, Mak JY, Godfrey DI, Rossjohn J, Fairlie DP, McCluskey J, Eckle SB, An overview on the identification of MAIT cell antigens. Immunol Cell Biol 96, 573–587 (2018). - PubMed
    1. Meermeier EW, Harriff MJ, Karamooz E, Lewinsohn DM, MAIT cells and microbial immunity. Immunol Cell Biol 96, 607–617 (2018). - PMC - PubMed
    1. Ussher JE, Willberg CB, Klenerman P, MAIT cells and viruses. Immunology and cell biology, (2018). - PMC - PubMed
    1. Rouxel O, Lehuen A, Mucosal-associated invariant T cells in autoimmune and immune-mediated diseases. Immunology and cell biology 96, 618–629 (2018). - PubMed

Publication types

MeSH terms

Substances