. 2019 Nov 22;10(1):5296.
doi: 10.1038/s41467-019-13194-2.

Functional analysis of genetic variants in the high-risk breast cancer susceptibility gene PALB2

Affiliations

Functional analysis of genetic variants in the high-risk breast cancer susceptibility gene PALB2

Rick A C M Boonen et al. Nat Commun. .

Abstract

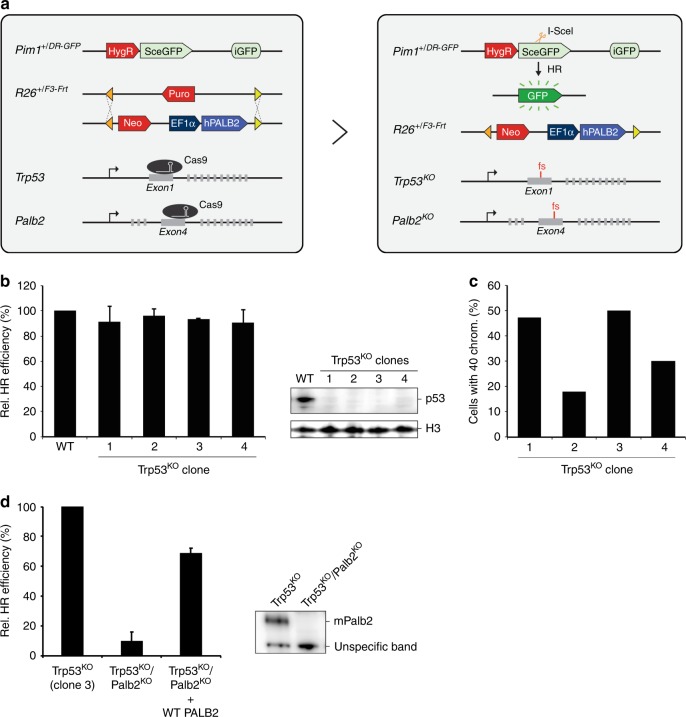
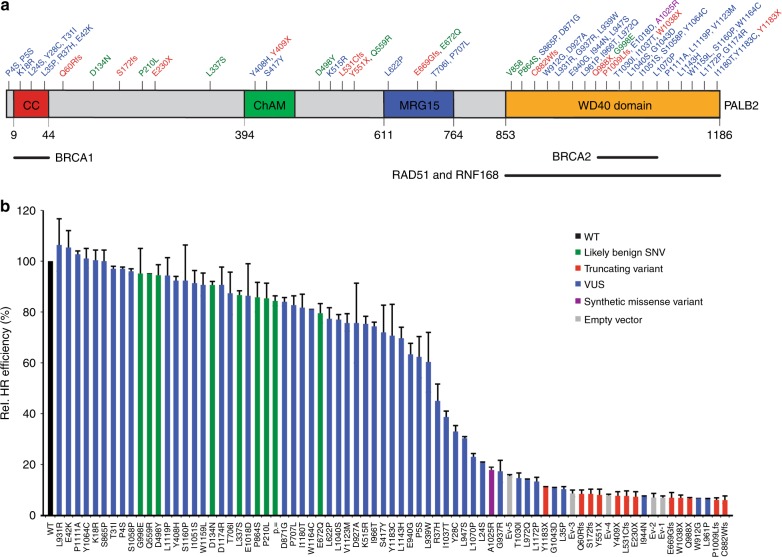
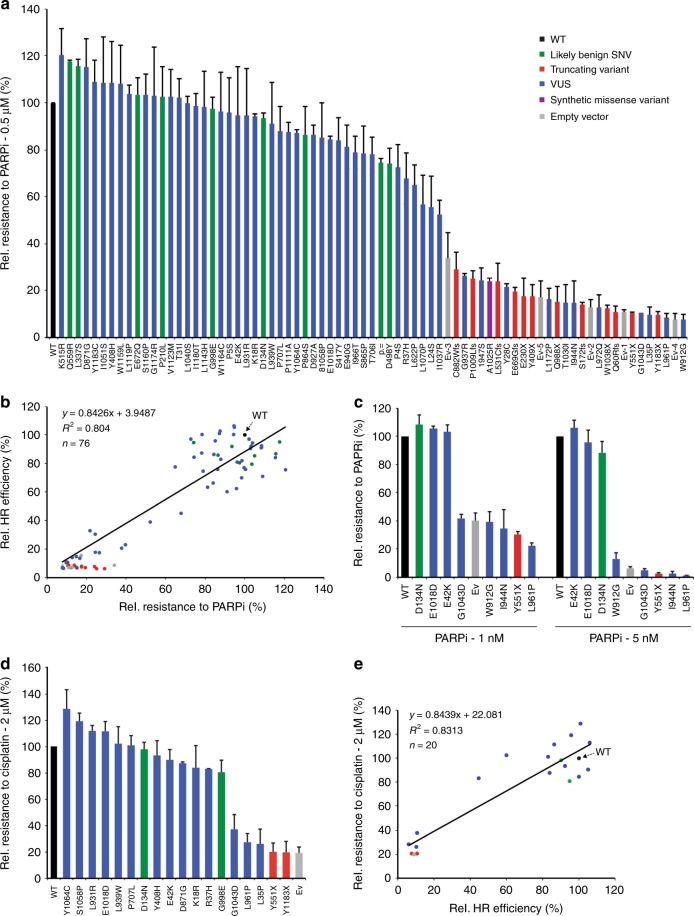
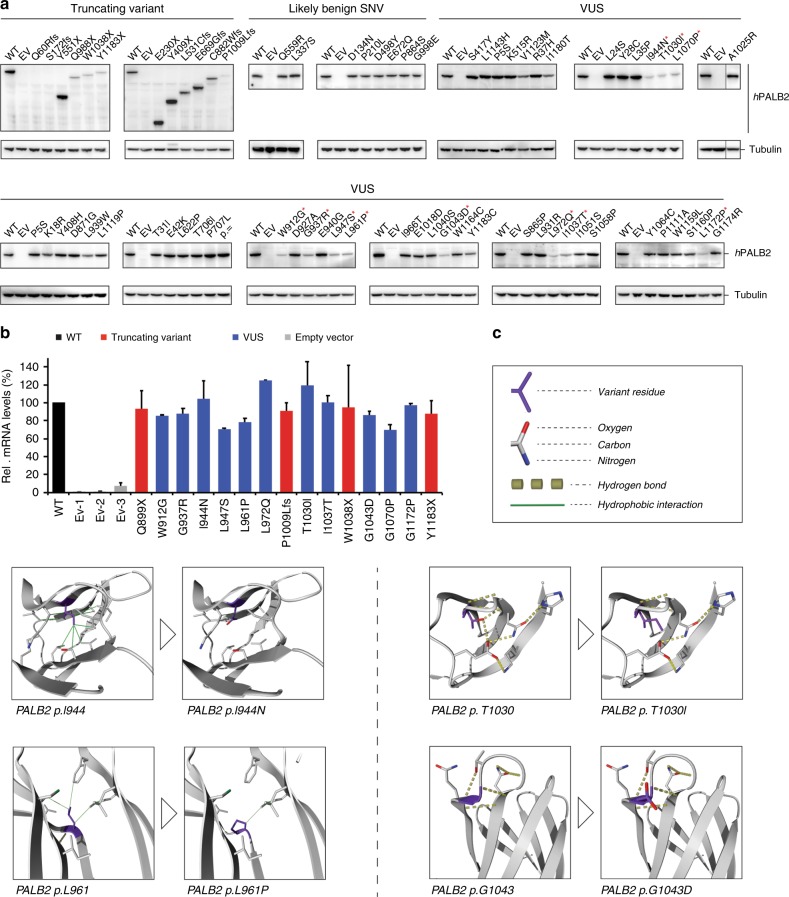
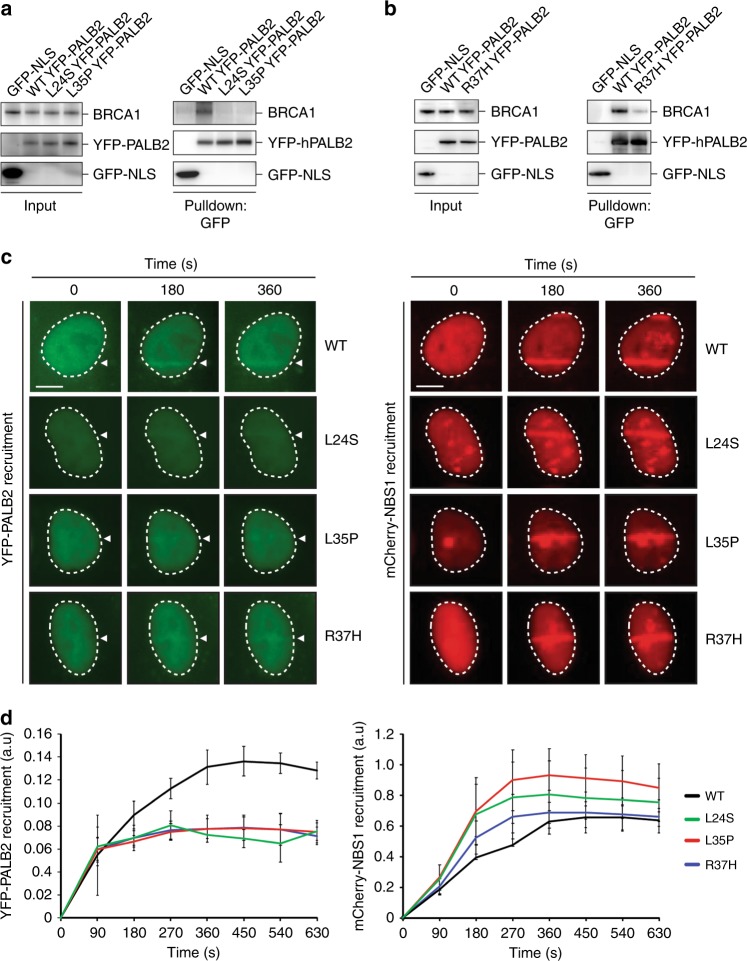
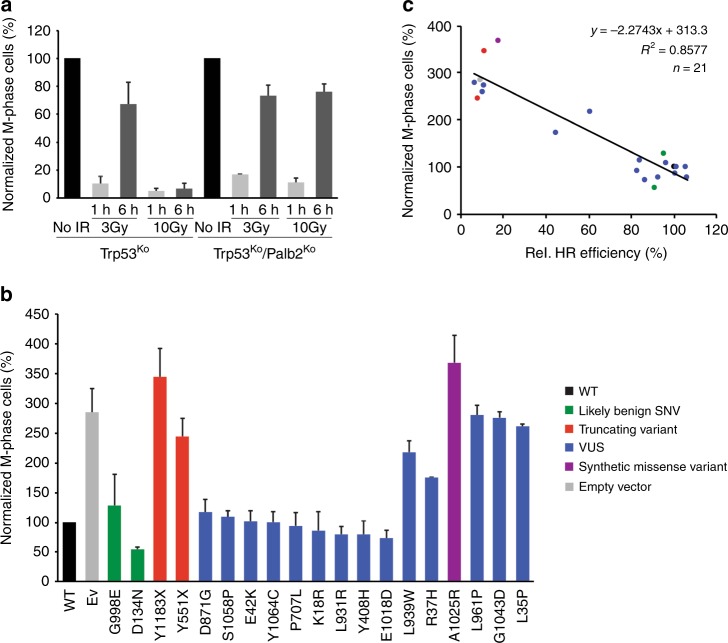
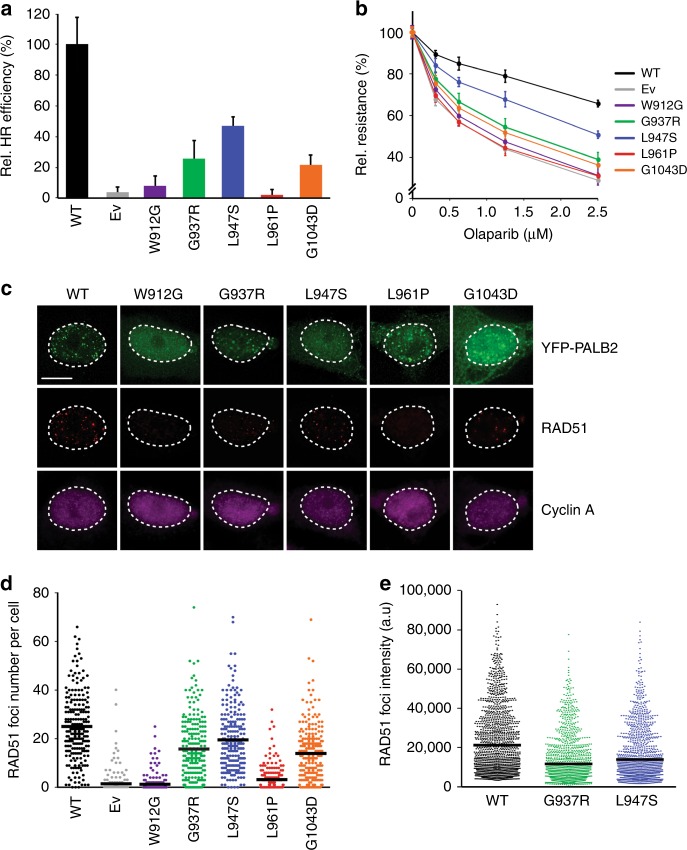
Heterozygous carriers of germ-line loss-of-function variants in the DNA repair gene PALB2 are at a highly increased lifetime risk for developing breast cancer. While truncating variants in PALB2 are known to increase cancer risk, the interpretation of missense variants of uncertain significance (VUS) is in its infancy. Here we describe the development of a relatively fast and easy cDNA-based system for the semi high-throughput functional analysis of 48 VUS in human PALB2. By assessing the ability of PALB2 VUS to rescue the DNA repair and checkpoint defects in Palb2 knockout mouse embryonic stem (mES) cells, we identify various VUS in PALB2 that impair its function. Three VUS in the coiled-coil domain of PALB2 abrogate the interaction with BRCA1, whereas several VUS in the WD40 domain dramatically reduce protein stability. Thus, our functional assays identify damaging VUS in PALB2 that may increase cancer risk.


Conflict of interest statement

The authors declare no competing interests.

Figures

Fig. 1
Fig. 1
Development of a cDNA-based complementation system for the functional analysis of human PALB2. a Schematic of the cDNA-based complementation system for functional analysis of human PALB2. The DR-GFP reporter for HR and recombination-mediated cassette exchange system (RMCE) for site-specific integration and expression of a human PALB2 cDNA were incorporated at the mouse Pim1 and Rosa26 (R26) loci, respectively. Endogenous mouse Trp53 was targeted with CRISPR/Cas9 using a gRNA against exon 1, whereas endogenous Palb2 was targeted with a gRNA against exon 4 (left). Transient expression of the I-SceI endonuclease in Trp53KO/Palb2KO cells expressing human PALB2 cDNA (with or without a variant) allows for assessment of the HR efficiency using the DR-GFP reporter (right). b DR-GFP assay in Trp53KO mES cell clones transfected with an I-SceI and mCherry co-expression vector. GFP expression was monitored by Fluorescence-Activated Cell Sorting (FACS). Data represent mean percentages (±SEM) of GFP-positive cells among the mCherry-positive cells relative to that for the wild type (WT), which was set to 100%, from two independent experiments (left). Western blot analysis of Trp53 expression in 4 Trp53KO mES cell clones. Histone 3 (H3) was a loading control (right). c Karyotyping of Trp53KO mES clones from (b). The bar graph shows the percentages of cells with 40 chromosomes (n = 50 cells per condition). d DR-GFP assay in Trp53KO and Trp53KO/Palb2KO mES cells expressing WT PALB2 or not. Cells were transfected with an I-SceI and mCherry co-expression vector. GFP expression was monitored by FACS. Data represent mean percentages (±SEM) of GFP-positive cells among the mCherry-positive cells relative to that for Trp53KO cells, which was set to 100%, from four independent experiments (left). Western blot analysis of mouse (m)Palb2 expression in Trp53KO and Trp53KO/Palb2KO (clone 3) mES cells (right). An unspecific band was a loading control (right). Source data are provided as a Source Data file.
Fig. 2
Fig. 2
Human PALB2 variants and their effect on HR. a Schematic representation of the PALB2 protein with variant positions indicated and categorized as either neutral (green), truncating (red), VUS (blue) and synthetic missense variant (purple). The amino acid numbers are shown to specify the evolutionarily conserved functional domains of PALB2. PALB2 regions involved in the interactions with BRCA1, BRCA2, RNF168, and RAD51 are indicated. b DR-GFP assay in Trp53KO/Palb2KO mES cells expressing human PALB2 variants (or an empty vector control, Ev). Cells were transfected with an I-SceI and mCherry co-expression vector. GFP expression was monitored by FACS. Data represent mean percentages (±SEM) of GFP-positive cells among the mCherry-positive cells relative to wild type (WT), which was set to 100%, from two independent experiments, except for p.L939W and p.G998E for which data from three independent experiments are presented. Variants/conditions are categorized by color as either wild type (WT, black), likely benign SNV (green), truncating variant (red), VUS (blue), synthetic missense variant (purple) or empty vector (Ev, gray). Ev1–5 refer to Ev controls from 5 different replicates. Source data are provided as a Source Data file.
Fig. 3
Fig. 3
Functional analysis of PALB2 VUS using PARP inhibitor and cisplatin sensitivity assays. a Proliferation-based PARP inhibitor (PARPi) sensitivity assay using Trp53KO/Palb2KO mES cells expressing human PALB2 variants (or an empty vector control, Ev). Cells were exposed to 0.5 μM PARPi for two days. Cell viability was measured 1 day later using FACS. Data represent the mean percentage of viability relative to wild type (WT) (±SEM), which was set to 100%, from two independent experiments, except for p.P4S, p.P210L, p.L939W, and p.V1123M, for which data from three independent experiments is presented, and p.L24S and p.L1070P, for which data from four independent experiments is presented. Variants/conditions are categorized by color as in Fig. 2. b Scatter plot showing the correlation between HR efficiencies and PARPi sensitivity measured in Fig. 2b and Fig. 3a, respectively. Variants/conditions are categorized by color as in (a). The trendline indicates the positive correlation between the outcome of DR-GFP and PARPi sensitivity assays. c Clonogenic PARP inhibitor survival assay using Trp53KO/Palb2KO mES cells expressing human PALB2 variants (or an empty vector control, Ev). Cells were exposed to the indicated concentrations of PARPi for 7–9 days after which surviving colonies were counted. Data represent the mean percentage of survival (±SEM) relative to cells expressing WT PALB2, which were set to 100%, from three independent experiments in case of treatment with 1 nM PARPi, and four experiments in case of treatment with 5 nM PARPi. Variants/conditions are categorized by color as in (a). d As in (a), except that cells were exposed to 2 μM cisplatin. Data represent the mean percentage of viability relative to WT (±SEM), which was set to 100%, from two independent experiments. e Scatter plot showing the correlation between HR efficiencies and cisplatin sensitivity measured in Fig. 2b and d. The trendline indicates the positive correlation between the outcome of DR-GFP and cisplatin sensitivity assays. Variants/conditions are categorized by color as in (a). Source data are provided as a Source Data file.
Fig. 4
Fig. 4
Effect of PALB2 variants on protein expression and/or stability. a Western blot analysis of the expression of human PALB2 variants in Trp53KO/Palb2KO mES cells using an antibody directed against the N-terminus of PALB2. Wild-type (WT) human PALB2 and empty vector (Ev) served as controls on each blot. Tubulin was a loading control. Marked PALB2 variants (red *) showed low levels of protein expression. b RT-qPCR analysis of human PALB2 variants from (a) with low expression levels (red *). Primers specific for human PALB2 cDNA and the Pim1 control locus were used. Data represent the mean percentage (±SEM) of PALB2 mRNA relative to WT, which was set to 100%, from two independent RNA isolation experiments. Variants/conditions are categorized by color as either WT (black), truncating variant (red), VUS (blue) or empty vector (Ev, grey). Ev-1, -2, -3 refer to Ev controls from three different replicates. c Partial structures of the PALB2 WD40 domain showing the effect of 4 PALB2 variants exhibiting low protein expression as shown in (a). Partial structures without and with variant are shown side by side for each variant, indicating loss of stabilizing interactions (but not any possible conformational changes). Source data are provided as a Source Data file.
Fig. 5
Fig. 5
Effect of PALB2 VUS on the BRCA1 interaction and recruitment to DNA damage sites. a YPF/GFP pulldowns of the indicated proteins following transient expression in U2OS cells. GFP-NLS and YFP-PALB2-L35P served as negative controls. Western blot analysis was performed using antibodies against GFP and BRCA1. b As in (a), except for p.R37H. c Live cell imaging of the recruitment of the indicated YFP-PALB2 proteins to DNA damage tracks generated by laser micro-irradiation in U2OS cells. mCherry-NBS1, which was co-expressed with the indicated YPF-PALB2 proteins, served as a DNA damage marker. Representative images are shown. White triangles indicate irradiated regions. Scale bars: 5 µm. d Quantification of the recruitment of the indicated YFP-PALB2 proteins and mCherry-NBS1 to DNA damage tracks in cells from (c). Data represent the mean values (±SEM) from three independent experiments. Source data are provided as a Source Data file.
Fig. 6
Fig. 6
Effect of PALB2 variants on the DNA damage-induced G2/M checkpoint. a Trp53KO/Palb2KO mES cells were irradiated with 3 or 10 Gy of IR and collected at the indicated time points after radiation exposure to assess the mitotic index by phospho-histone H3 (Ser10) staining and FACS analysis. Data represent the mean percentage of mitotic cells (±SEM) relative to the unirradiated cells (no IR), which was set to 100%, from two independent experiments. b Trp53KO/Palb2KO mES cells expressing the indicated PALB2 variants were irradiated with 10 Gy of IR and collected 6 h after radiation exposure to assess the mitotic index by phospho-histone H3 (Ser10) staining and FACS analysis. For each variant, the mean percentage of mitotic cells (±SEM) from two independent experiments is shown relative to unirradiated cells, except for p.L939W and p.G998E for which data from three independent experiments is presented. Variants/conditions are categorized by color as in Fig. 2. c Scatter plot showing the correlation between the HR efficiencies and the mitotic index after IR as measured in Fig. 2b and b, respectively. Variants/conditions are categorized by color as in (b). The trendline indicates the negative correlation between the HR efficiency and mitotic index after IR, revealing a strong positive correlation between the impact of PALB2 variants on HR and G2/M checkpoint maintenance. Source data are provided as a Source Data file.
Fig. 7
Fig. 7
Functional analysis of damaging PALB2 variants in human cells. a CRISPR-LMNA HDR assay in siRNA-treated U2OS PALB2 knockdown cells expressing siRNA-resistant human PALB2 cDNA with the indicated variants (or an empty vector control, Ev). Data represent the mean percentage (±SD) of mRuby2-positive cells among the YFP-positive cells from three independent experiments (n > 300 YFP-positive cells per condition) relative to wild type (WT), which was set to 100%. b PARP inhibitor (PARPi) sensitivity assay using siRNA-treated HeLa PALB2 knockdown cells expressing siRNA-resistant human PALB2 cDNA with the indicated variants (or an empty vector control, Ev). Survival curves were determined after 72 h of PARPi treatment. Data represent the mean percentage of viability relative to untreated cells ( ± SD), which was set to 100%, of three independent experiments, each performed in triplicate. c Representative images of RAD51 foci 4 h after 2 Gy of ionizing radiation in siRNA-treated HeLa PALB2 knockdown cells expressing siRNA-resistant human PALB2 cDNA with the indicated variants (or an empty vector control, Ev). Scale bar: 5 µm. d Quantification of the results from (c). Scatter dot plot shows the number of RAD51 foci in cyclin A-positive cells expressing the indicated variant, with the horizontal lines designating the mean values (±SD) of three independent experiments (n > 200 cells per condition). e Quantification of the results from (c). Scatter dot plot shows the intensity of RAD51 foci in cyclin A-positive cells expressing the indicated variant, with the horizontal lines designating the mean values (±SD) of three independent experiments (n > 500 cells per condition). Source data are provided as a Source Data file.

Comment in

References

    1. Antoniou A, et al. Average risks of breast and ovarian cancer associated with BRCA1 or BRCA2 mutations detected in case Series unselected for family history: a combined analysis of 22 studies. Am. J. Hum. Genet. 2003;72:1117–1130. doi: 10.1086/375033. - DOI - PMC - PubMed
    1. Rahman N, et al. PALB2, which encodes a BRCA2-interacting protein, is a breast cancer susceptibility gene. Nat. Genet. 2007;39:165–167. doi: 10.1038/ng1959. - DOI - PMC - PubMed
    1. Reid S, et al. Biallelic mutations in PALB2 cause Fanconi anemia subtype FA-N and predispose to childhood cancer. Nat. Genet. 2007;39:162–164. doi: 10.1038/ng1947. - DOI - PubMed
    1. Antoniou AC, et al. Breast-cancer risk in families with mutations in PALB2. New Engl. J. Med. 2014;371:497–506. doi: 10.1056/NEJMoa1400382. - DOI - PMC - PubMed
    1. Couch FJ, et al. Associations Between Cancer Predisposition Testing Panel Genes and Breast Cancer. JAMA Oncol. 2017;3:1190–1196. doi: 10.1001/jamaoncol.2017.0424. - DOI - PMC - PubMed

Publication types

Grants and funding