. 2019 Nov 22;10(1):5310.
doi: 10.1038/s41467-019-13287-y.

Disentangling the role of Africa in the global spread of H5 highly pathogenic avian influenza

Affiliations

Disentangling the role of Africa in the global spread of H5 highly pathogenic avian influenza

Alice Fusaro et al. Nat Commun. .

Abstract

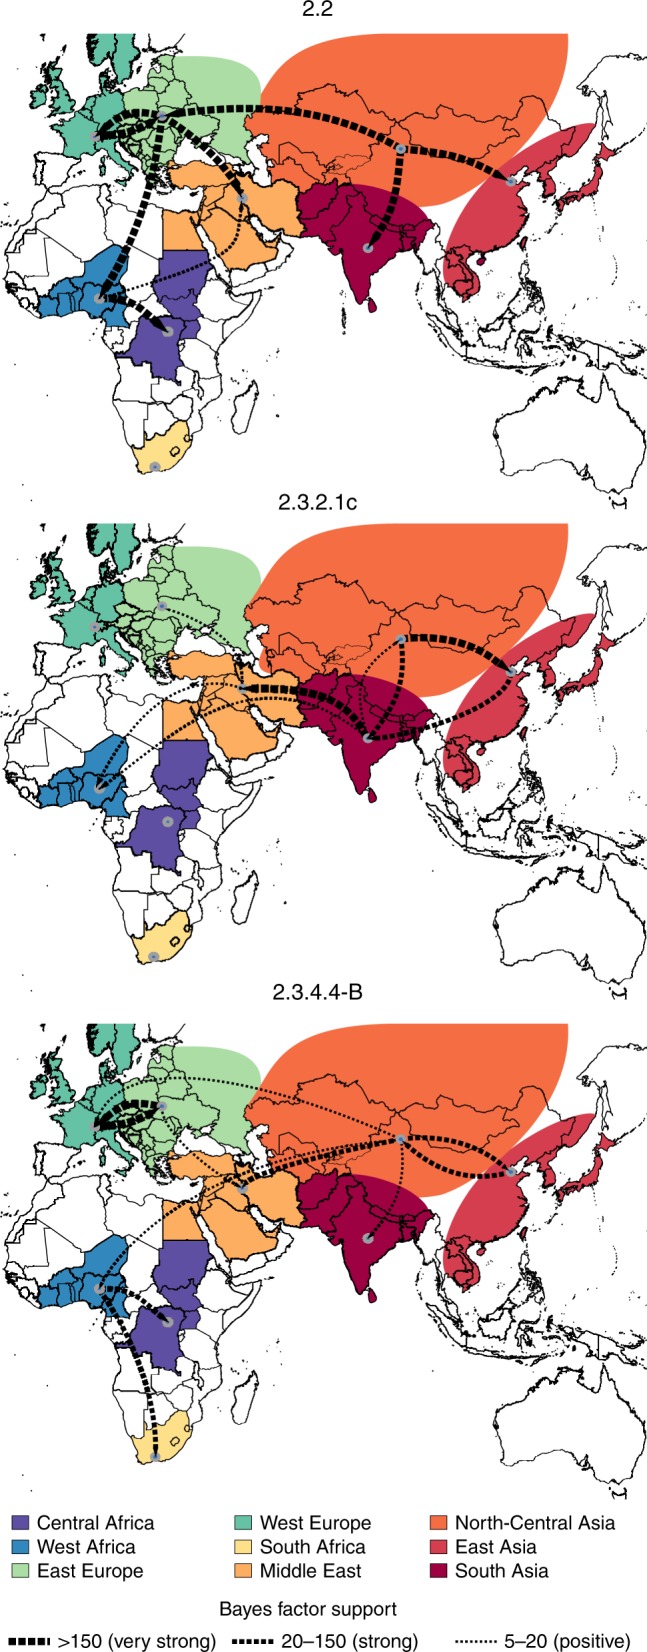
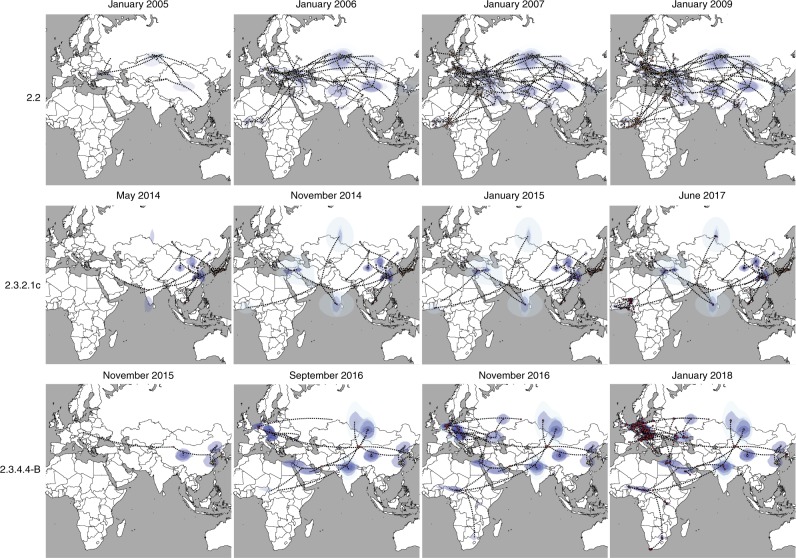
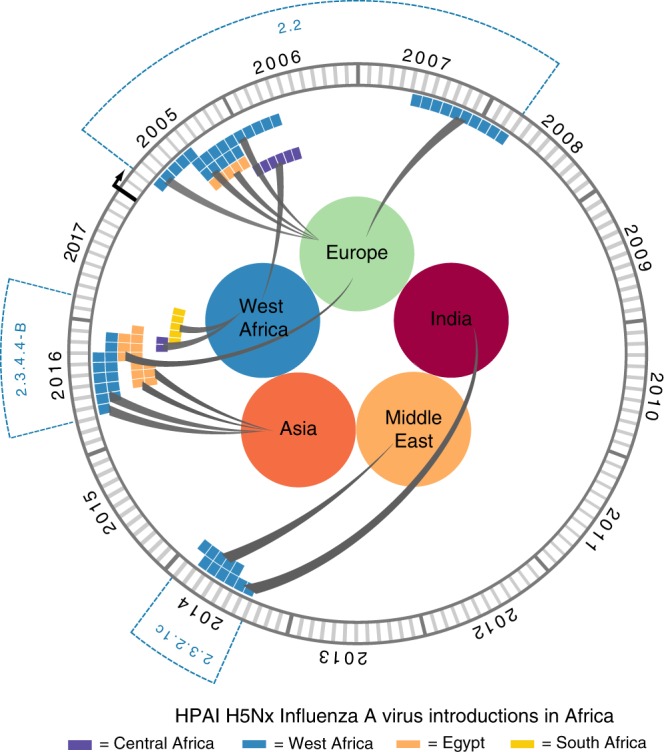
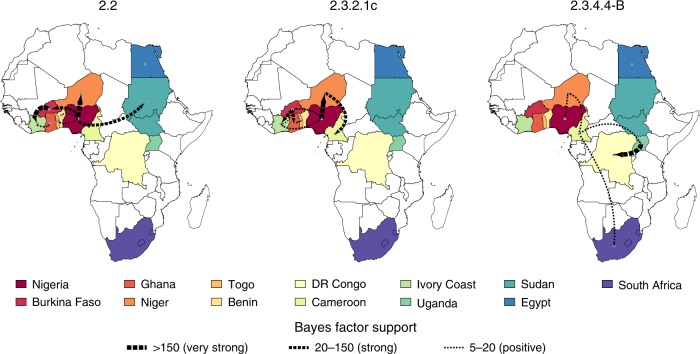
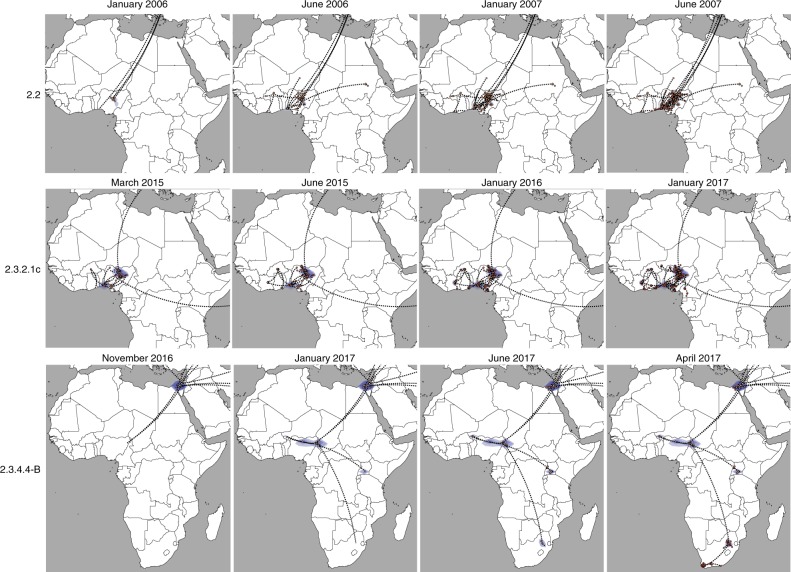
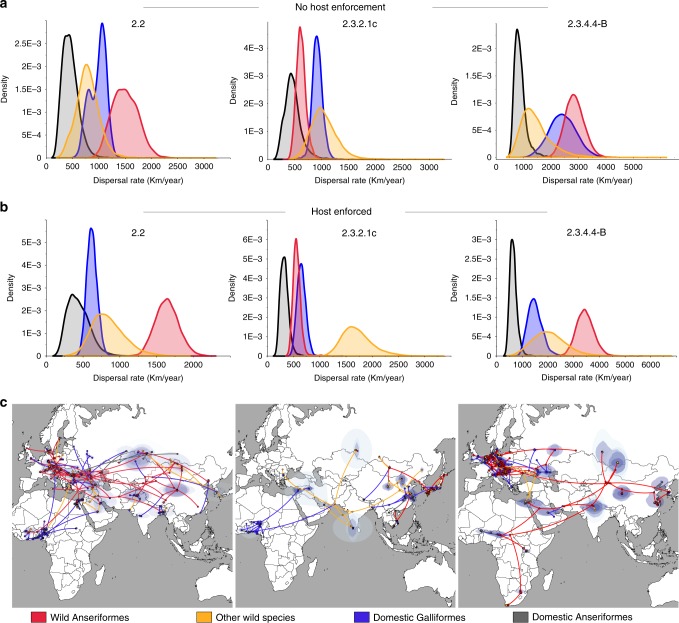
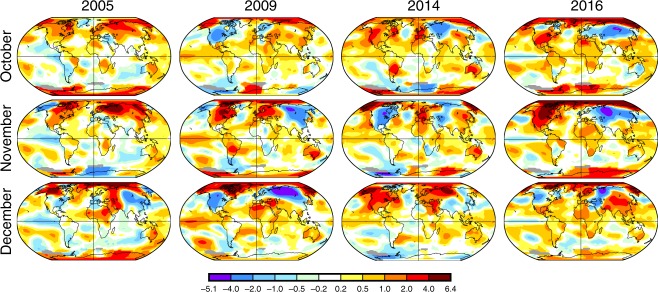
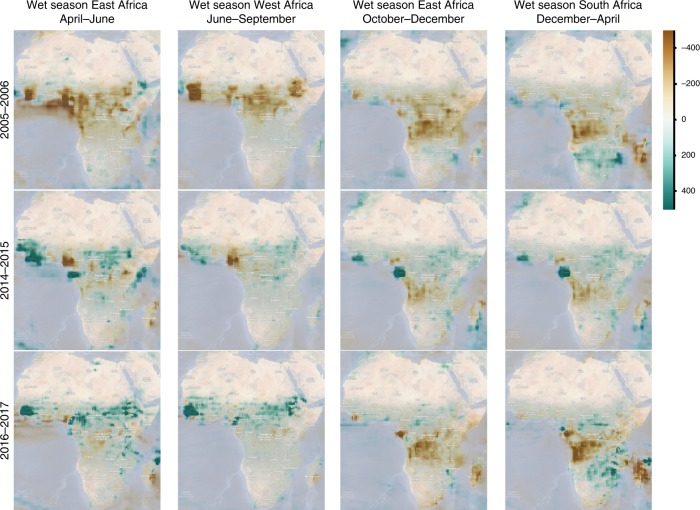
The role of Africa in the dynamics of the global spread of a zoonotic and economically-important virus, such as the highly pathogenic avian influenza (HPAI) H5Nx of the Gs/GD lineage, remains unexplored. Here we characterise the spatiotemporal patterns of virus diffusion during three HPAI H5Nx intercontinental epidemic waves and demonstrate that Africa mainly acted as an ecological sink of the HPAI H5Nx viruses. A joint analysis of host dynamics and continuous spatial diffusion indicates that poultry trade as well as wild bird migrations have contributed to the virus spreading into Africa, with West Africa acting as a crucial hotspot for virus introduction and dissemination into the continent. We demonstrate varying paths of avian influenza incursions into Africa as well as virus spread within Africa over time, which reveal that virus expansion is a complex phenomenon, shaped by an intricate interplay between avian host ecology, virus characteristics and environmental variables.


Conflict of interest statement

The authors declare no competing interests.

Figures

Fig. 1
Fig. 1
Global migration rates between geographic regions of the three HPAI H5Nx clades. Maps showing statistically supported non-zero rates (BF > 5) for clades 2.2, 2.3.2.1c and 2.3.4.4-B. Areas for each region type are labelled using the same colour in the annotated phylogenetic trees in Supplementary Figs. 3–5. The thickness of the dashed lines representing the rates is proportional to the relative strength by which rates are supported for the epi-based datasets shown in the Supplementary Table 1: very strong (BF > 150, thick lines), strong (20 < BF < 150, medium lines) and positive (5 < BF < 20, thin lines).
Fig. 2
Fig. 2
Global spatiotemporal dispersal of the three HPAI H5Nx clades. Dispersal patterns inferred using continuous phylogeographic analysis of the epi-based datasets are shown for four time slices for each of the three HPAI H5Nx clades. The black dashed lines and the dots represent part of the branches and the nodes of the MCC tree up to each of the indicated time. Dots are coloured according to the time (from yellow for the oldest to red for the youngest). Contours represent statistical uncertainty of the estimated locations at the internal nodes (95% credible contours based on kernel density estimates).
Fig. 3
Fig. 3
tMRCA estimated for each virus introduction in Africa. Coloured bars represent the mean tMRCAs (Supplementary Table 2, Global dataset) of each virus introduction in West Africa (blue), Egypt (orange), East-Central Africa (violet) and South Africa (yellow). Circles represent the area of origin of each virus introduction, based on the estimates summarised in the maximum clade credibility trees of each HPAI H5 clade.
Fig. 4
Fig. 4
Migration rates between African countries of the three HPAI H5Nx clades. Maps showing statistically supported non-zero rates (BF > 5) for clades 2.2, 2.3.2.1c and 2.3.4.4-B. Each country is labelled by the same colour used in the annotated phylogenetic trees in Supplementary Figs. 6–8. The thickness of the dashed lines representing the rates is proportional to the relative strength by which rates are supported for the epi-based datasets shown in the Supplementary Table 1: very strong (BF > 150, thick lines), strong (20 < BF < 150, medium lines), and positive (5 < BF < 20, thin lines).
Fig. 5
Fig. 5
Spatiotemporal dispersal of the three HPAI H5Nx clades within the African continent. Dispersal patterns of H5Nx viruses in Africa, inferred using continuous phylogeographic analysis, are shown for four time slices for each of the three HPAI H5Nx clades. The black dashed lines and the dots represent part of the branches and the nodes of the MCC tree up to each of the indicated time. Dots are coloured according to the time (from yellow for the oldest to red for the youngest). Contours represent statistical uncertainty of the estimated locations at the internal nodes (95% credible contours based on kernel density estimates).
Fig. 6
Fig. 6
Contribution of different host types to HPAI H5Nx dissemination. Posterior dispersal rate distributions for each host (red—wild Anseriformes; yellow—other wild species; blue—domestic Galliformes; grey—domestic Anseriformes) obtained by the joint host analyses of the epi-based datasets of the three clades without any host enforcement (a) or imposing host species transitions from wild to domestic birds (b). c Dispersal patterns obtained from the epi-based datasets are shown for each of the three HPAI H5Nx clades. The lines and dots represent the branches and nodes of the MCC trees and are marked according to the most probable ancestral host trait as described above. Contours represent statistical uncertainty of the estimated locations at the internal nodes (95% credible contours based on kernel density estimates).
Fig. 7
Fig. 7
Word temperature anomaly maps. The temperature anomaly maps for the months of October, November and December of the years during which an intercontinental HPAI H5 spread was reported—2005, 2009, 2014 and 2016—were obtained from the National Oceanic and Atmospheric Administration (NOAA) at https://www.ncdc.noaa.gov/sotc/global/201709 by comparing the land and ocean surface temperatures of a given month to the average values for that month for the period 1901–2000. A positive anomaly (red) indicates that the observed temperature was warmer than the reference value, while a negative anomaly (blue) indicates that the observed temperature was cooler than the reference value. Temperature anomaly in degrees Celsius.
Fig. 8
Fig. 8
Precipitation anomaly maps for the African continent. Total precipitation rates difference from the 1981 to 2018 baseline mean for the wet seasons in east Africa (April–June and October–December), West Africa (June–September) and South Africa (December–April) for years 2005–2006, 2014–2015 and 2016–2017. Scale bar shows the precipitation (in mm) difference from average. Maps were obtained from Climate Engine available at https://app.climateengine.org. Data Source: MERRA2 ~50-km (0.5° × 0.625°) daily dataset (NASA).

References

    1. Xu X, Subbarao K, Cox NJ, Guo Y. Genetic characterization of the pathogenic influenza A/Goose/Guangdong/1/96 (H5N1) virus: similarity of its hemagglutinin gene to those of H5N1 viruses from the 1997 outbreaks in Hong Kong. Virology. 1999;261:15–19. doi: 10.1006/viro.1999.9820. - DOI - PubMed
    1. Prosser DJ, et al. Wild bird migration across the Qinghai-Tibetan plateau: a transmission route for highly pathogenic H5N1. PLoS ONE. 2011;6:e17622. doi: 10.1371/journal.pone.0017622. - DOI - PMC - PubMed
    1. Lai S, et al. Global epidemiology of avian influenza A H5N1 virus infection in humans, 1997–2015: a systematic review of individual case data. Lancet Infect. Dis. 2016;16:e108–e118. doi: 10.1016/S1473-3099(16)00153-5. - DOI - PMC - PubMed
    1. WHO | Cumulative number of confirmed human cases of avian influenza A(H5N1) reported to WHO. WHO (2019). Available at: https://www.who.int/influenza/human_animal_interface/2019_04_09_tableH5N.... Accessed April 20, 2019.
    1. Smith GJD, Donis RO. Nomenclature updates resulting from the evolution of avian influenza A(H5) virus clades 2.1.3.2a, 2.2.1, and 2.3.4 during 2013–2014. Influenza Other Respir. Viruses. 2015;9:271–276. doi: 10.1111/irv.12324. - DOI - PMC - PubMed

Publication types

MeSH terms