. 2019 Nov 22;6(1):277.
doi: 10.1038/s41597-019-0292-2.

SeaFlow data v1, high-resolution abundance, size and biomass of small phytoplankton in the North Pacific

Affiliations

SeaFlow data v1, high-resolution abundance, size and biomass of small phytoplankton in the North Pacific

François Ribalet et al. Sci Data. .

Abstract

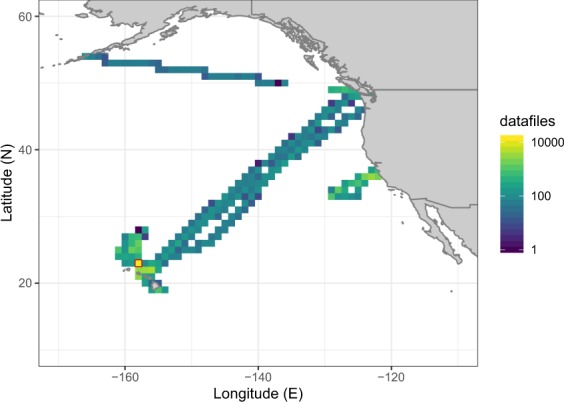
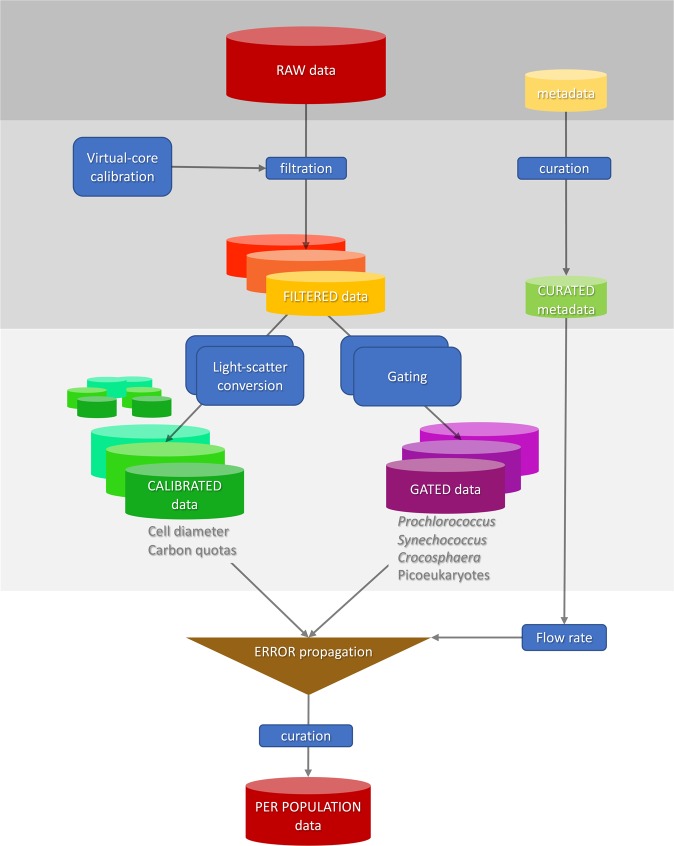
SeaFlow is an underway flow cytometer that provides continuous shipboard observations of the abundance and optical properties of small phytoplankton (<5 μm in equivalent spherical diameter, ESD). Here we present data sets consisting of SeaFlow-based cell abundance, forward light scatter, and pigment fluorescence of individual cells, as well as derived estimates of ESD and cellular carbon content of picophytoplankton, which includes the cyanobacteria Prochlorococcus, Synechococcus and small-sized Crocosphaera (<5 μm ESD), and picophytoplankton and nanophytoplankton (2-5 μm ESD). Data were collected in surface waters (≈5 m depth) from 27 oceanographic cruises carried out in the Northeast Pacific Ocean between 2010 and 2018. Thirteen cruises provide high spatial resolution (≈1 km) measurements across 32,500 km of the Northeast Pacific Ocean and 14 near-monthly cruises beginning in 2015 provide seasonal distributions at the long-term sampling site (Station ALOHA) of the Hawaii Ocean Time-Series. These data sets expand our knowledge of the current spatial and temporal distributions of picophytoplankton in the surface ocean.


Conflict of interest statement

The authors declare no competing interests.

Figures

Fig. 1
Fig. 1
Distribution of the number of data files. Location and number of data files aggregated into 1 degree bins of latitude and longitude. Red outlined square indicates the location of Station ALOHA.
Fig. 2
Fig. 2
Representation of the workflow starting from the raw data source to the curated per-population SeaFlow data. Classified data is the per cell forward light scatter and fluorescence for different populations and the calibrated data is the derived per equivalent spherical and cellular carbon content.
Fig. 3
Fig. 3
Calibration of optimally-positioned particles. Optical properties of optimally-positioned calibration beads show a linear relationship between the forward scatter and the position-sensitive detectors (D1) normalized to 1-μm calibration beads, which is represented by the two linear regression models (red lines). Grey lines represent the 95% confidence interval of the two regression models.
Fig. 4
Fig. 4
Calibration of forward scatter measurements. Relationship between forward scatter normalized to 1-μm calibration beads measured by SeaFlow and (a) diameter of calibration beads, (b) equivalent spherical diameter of phytoplankton cultures and (c) carbon quotas estimated with independent methods. Diameters of calibration beads were provided by the manufacturer while diameters of phytoplankton type were from electronic particle counter measurements; carbon quotas was determined by bulk measurements of particulate carbon normalized by cell number. Red lines represent Mie-based predictions using a refractive index of 1.60 (a) or 1.38 (b,c) and 1.35 and 1.41 for grey lines, relative to the refractive index of seawater (1.34).
Fig. 5
Fig. 5
Comparison of cell counts. (a) Abundances of eukaryotic phytoplankton (picoeuk) Prochlorococcus (prochloro), Synechococcus (synecho) obtained with SeaFlow were compared with those obtained with a BD Influx flow cytometer. Samples analyzed with the Influx were collected from Niskin bottles and fixed with electron grade glutaraldehyde at a 0.25% final concentration while samples analyzed by the SeaFlow were collected from the ship’s underway system and were not fixed. The linear regression (red line, slope = 0.91), coefficient of correlation (R = 0.92), number of observations (n), and dashed line representing the 1:1 slope are shown. (b) Frequency distribution of percent discrepancy in abundance estimates between the two instruments, dashed lines representing the 25% discrepancy.

References

    1. Falkowski P, Barber R, Smetacek V. Biogeochemical Controls and Feedbacks on Ocean Primary Production. Science. 1998;281:200–206. doi: 10.1126/science.281.5374.200. - DOI - PubMed
    1. Finkel ZV, et al. Phytoplankton in a changing world: cell size and elemental stoichiometry. Journal of Plankton Research. 2010;32:119–137. doi: 10.1093/plankt/fbp098. - DOI
    1. Raven JA. The twelfth Tansley Lecture. Small is beautiful: the picophytoplankton. Functional Ecology. 1998;12:503–513. doi: 10.1046/j.1365-2435.1998.00233.x. - DOI
    1. Bonnet S, Biegala IC, Dutrieux P, Slemons LO, Capone DG. Nitrogen fixation in the western equatorial Pacific: Rates, diazotrophic cyanobacterial size class distribution, and biogeochemical significance. Global Biogeochemical Cycles. 2009;23:1–13. doi: 10.1029/2008GB003439. - DOI
    1. Flombaum P, et al. Present and future global distributions of the marine Cyanobacteria Prochlrococcus and Synechococcus. Proceedings of the National Academy of Sciences. 2013;110:9824–9829. doi: 10.1073/pnas.1307701110. - DOI - PMC - PubMed

Publication types