. 2019 Nov 22;9(1):17366.
doi: 10.1038/s41598-019-53916-6.

Physiology and proteomic analysis reveals root, stem and leaf responses to potassium deficiency stress in alligator weed

Affiliations

Physiology and proteomic analysis reveals root, stem and leaf responses to potassium deficiency stress in alligator weed

Liqin Li et al. Sci Rep. .

Abstract

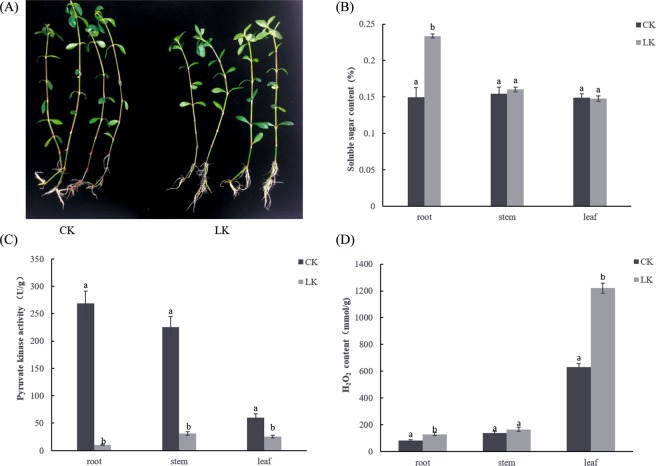
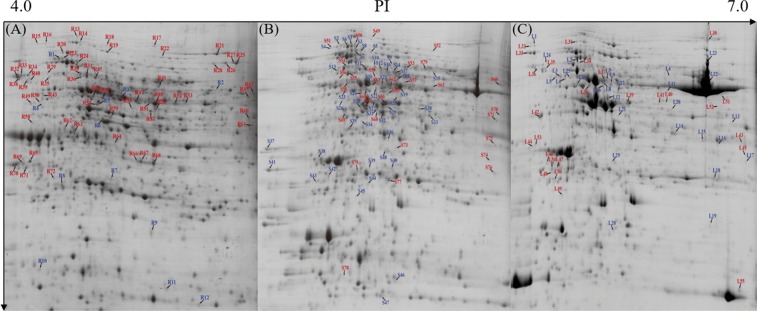
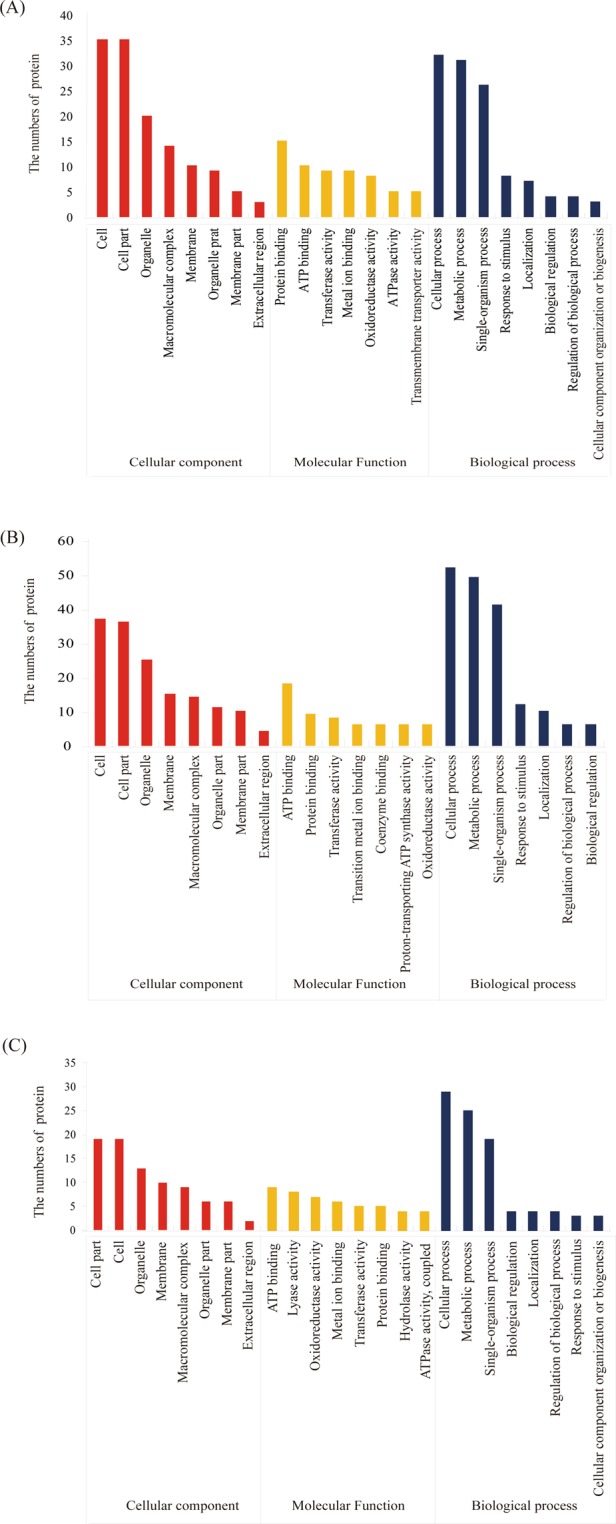
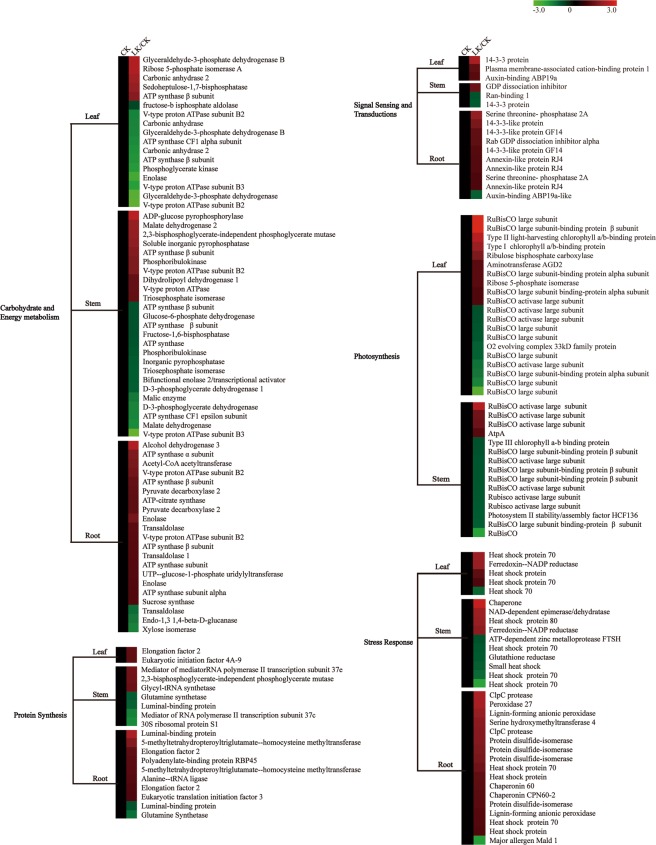
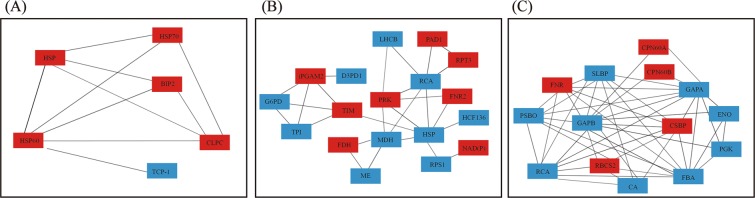
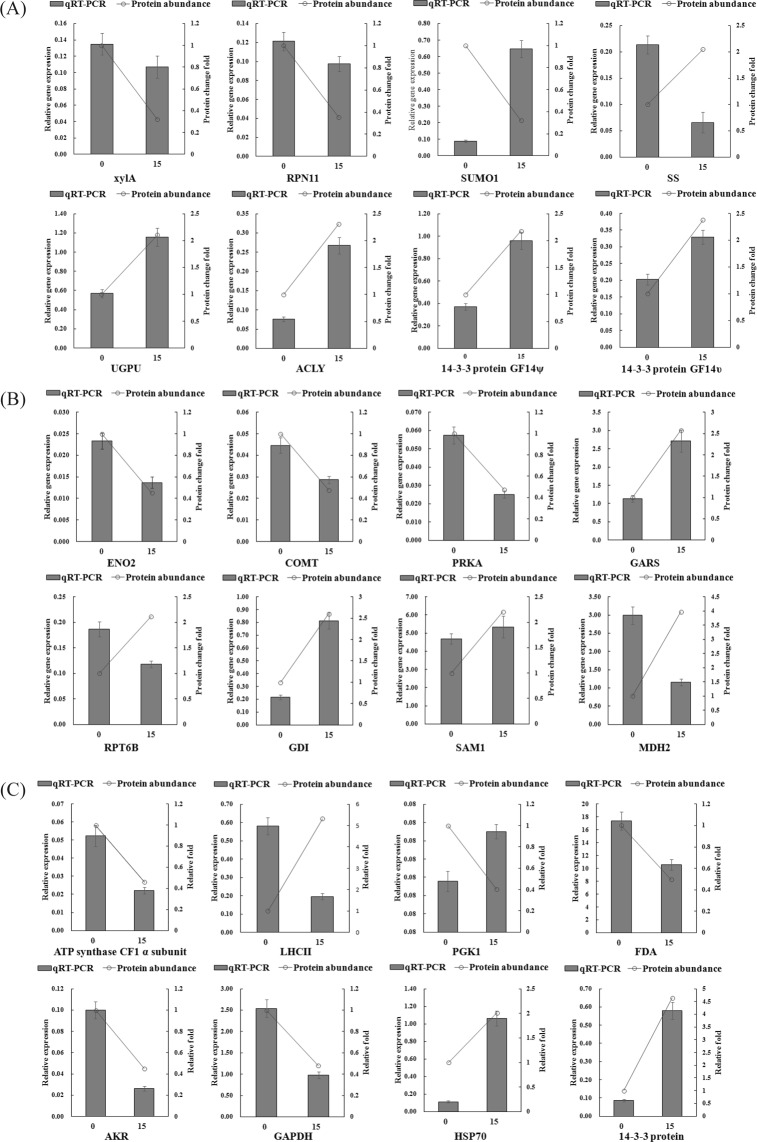
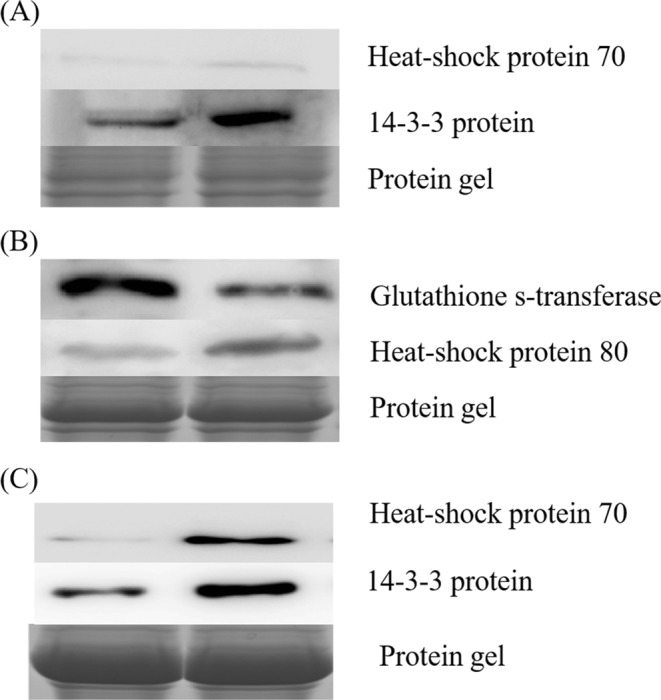
Alligator weed is reported to have a strong ability to adapt to potassium deficiency stress. Proteomic changes in response to this stress are largely unknown in alligator weed seedlings. In this study, we performed physiological and comparative proteomics of alligator weed seedlings between normal growth (CK) and potassium deficiency (LK) stress using 2-DE techniques, including root, stem and leaf tissues. Seedling height, soluble sugar content, PGK activity and H2O2 contents were significantly altered after 15 d of LK treatment. A total of 206 differentially expressed proteins (DEPs) were identified. There were 72 DEPs in the root, 79 in the stem, and 55 in the leaves. The proteomic results were verified using western blot and qRT-PCR assays. The most represented KEGG pathway was "Carbohydrate and energy metabolism" in the three samples. The "Protein degradation" pathway only existed in the stem and root, and the "Cell cycle" pathway only existed in the root. Protein-protein interaction analysis demonstrated that the interacting proteins detected were the most common in the stem, with 18 proteins. Our study highlights protein changes in alligator weed seedling under LK stress and provides new information on the comprehensive analysis of the protein network in plant potassium nutrition.


Conflict of interest statement

The authors declare no competing interests.

Figures

Figure 1
Figure 1
LK treatment induce growth change in Alligator weed. Phenotypes (A), soluble sugar content (B), PK activity (C), H2O2 activity (D). Note: in all cases, the error bars show SD, and the letters indicate significant differences (Kruskal-Wallis, p < 0.05). Data are shown as the mean ± SE (n = 3), and n represents the biological replicates.
Figure 2
Figure 2
Protein change patterns in the seedlings after LK stress. The 60 DEPs with increased abundance and 12 down-regulated in the root (A). The 31 DEPs with increased abundance and 48 down-regulated in the stem (B). The 26 DEPs with increased abundance and 29 down-regulated in the leaves (C). Red indicates increased abundance, and blue indicates decreased abundance.
Figure 3
Figure 3
GO annotation of the DEPs in alligator weed seedlings. GO annotation in the root (A), GO annotation in the stem (B), GO annotation in the leaves (C).
Figure 4
Figure 4
KEGG pathway analysis of DEPs in alligator weed seedlings. Red colour indicates induced proteins, and green colour indicates reduced proteins.
Figure 5
Figure 5
Protein-protein interaction analysis in seedlings. 6 DEPs interaction analysis in the root (A). 18 DEPs interaction analysis in the stem (B). 14 DEPs interaction analysis in the leaves. (C) Hsp, Heat shock protein; Hsp70, Heat shock protein 70; BIP2, Luminal-binding protein; Clpc, ClpC protease; TCP-1, T-complex 1; MDH, Malate dehydrogenase; TIM, Triosephosphate isomerase; PRK, Phosphoribulokinase; RCA, RuBisCO activase large subunit; FNR2, Ferredoxin–NADP reductase 2; HCF136, Photosystem II stability/assembly factor HCF136; PRS1, 30S ribosomal protein S1; FNR, Ferredoxin–NADP reductase 1; PSBO, O2 evolving complex 33kD family protein; RCA, RuBisCO activase large isoform; RBCS2, Ribulose bisphosphate carboxylase small chain 2; CA, Carbonic anhydrase; FBA, Fructose-bisphosphate aldolase; PGK, Phosphoglycerate kinase; CSBP, Sedoheptulose-1,7- chloroplastic; ENO, Enolase; GAPA, Glyceraldehyde-3-phosphate dehydrogenase, CPN60B, RuBisCO large subunit-binding protein subunit beta; Cpn60A, RuBisCO subunit binding-protein alpha subunit; SLBP, Stem-loop binding protein. Red blocks indicated induced protein, blue blocks indicated reduced protein.
Figure 6
Figure 6
Confirmation of the proteomic results using qRT-PCR. qRT-PCR analysis in the root (A). qRT-PCR analysis in the stem (B). qRT-PCR analysis in the leaves (C). XylA, Xylose isomerase; PSN11, 26 S proteasome non-ATPase regulatory subunit 11; SUMO1, Small ubiquitin-related modifier 1; SS, Sucrose synthase; UGPU, UTP–glucose-1-phosphate uridylyltransferase; ACLY, ATP-citrate synthase; ENO2, Bifunctional enolase 2/transcriptional activator; COMT, Caffeic acid 3-O-methyltransferase; PRKA, Phosphoribulokinase; GARS, glycyl-tRNA synthetase; RPT6B, 26S protease regulatory subunit 6B; GDI, GDP dissociation inhibitor; SAM1, S-adenosylmethionine synthase 1; MDH2, Malate dehydrogenase 2; LHCII, Type II light-harvesting chlorophyll a/b-binding protein; PGK1, Phosphoglycerate kinase; FDA, Fructose-bisphosphate aldolase; AKR, Aldo/keto reductase; GADPH, Glyceraldehyde-3-phosphate dehydrogenase; HSP70, heat shock protein 70. Note: in all cases, the error bars show SD, Data are shown as the mean ± SE (n = 3), and n represents the biological replicates.
Figure 7
Figure 7
Protein abundances were examined using western blot. Western blot analysis in the root (A). Western blot analysis in the stem (B). Western blot analysis in the leaves (C).
Figure 8
Figure 8
Overview of potassium deficiency -regulated protein networks in seedlings of alligator weed. PCaP1, Plasma membrane-associated cation-binding protein 1; GADPH, Glyceraldehyde-3-phosphate dehydrogenase; PP2A, Serine threonine- phosphatase 2A.

References

    1. Bergmann, W. & Shorrocks, V. M. Nutritional disorders of plants: visual and analytical diagnosis. Gustav Fischer (1992).
    1. Beringer, H. & Trolldenier, G. Influence of k nutrition on the response to environmental stress. Ipi Research Topics. 189–222 (1980).
    1. Hafsi C, Debez A, Abdelly C. Potassium deficiency in plants: effects and signaling cascades. Acta Physiol. Plant. 2014;36:1055–1070. doi: 10.1007/s11738-014-1491-2. - DOI
    1. Maathuis FJ. Physiological functions of mineral macronutrients. Curr Opin Plant Biol. 2009;12:250–258. doi: 10.1016/j.pbi.2009.04.003. - DOI - PubMed
    1. Ragel P, Raddatz N, Leidi EO, Quintero FJ, Pardo JM. Regulation of K+ nutrition in plants. Frontiers in Plant Science. 2019;10:281. doi: 10.3389/fpls.2019.00281. - DOI - PMC - PubMed

Publication types

MeSH terms

LinkOut - more resources