. 2019 Nov 22;9(1):17430.
doi: 10.1038/s41598-019-54078-1.

Exploring novel secondary metabolites from natural products using pre-processed mass spectral data

Affiliations

Exploring novel secondary metabolites from natural products using pre-processed mass spectral data

Hyun Woo Kim et al. Sci Rep. .

Abstract

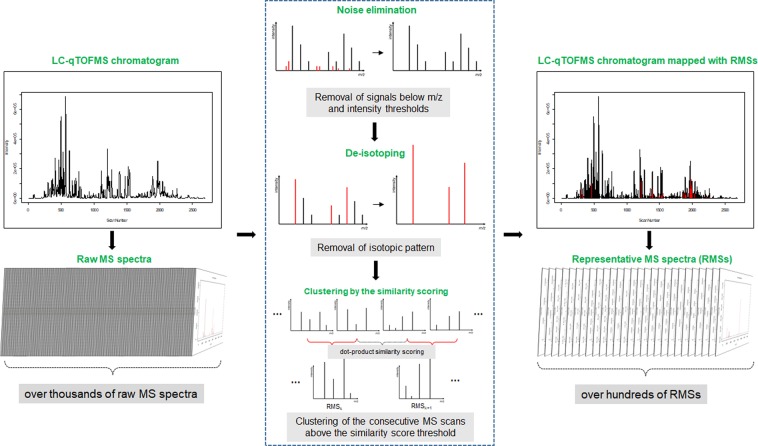
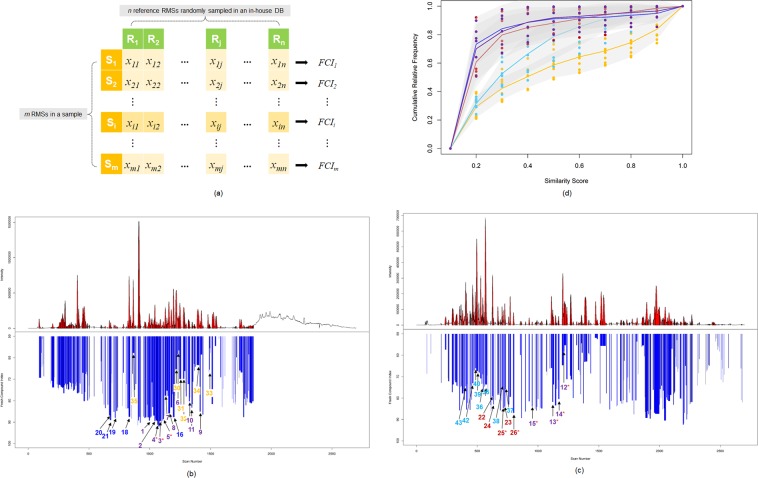
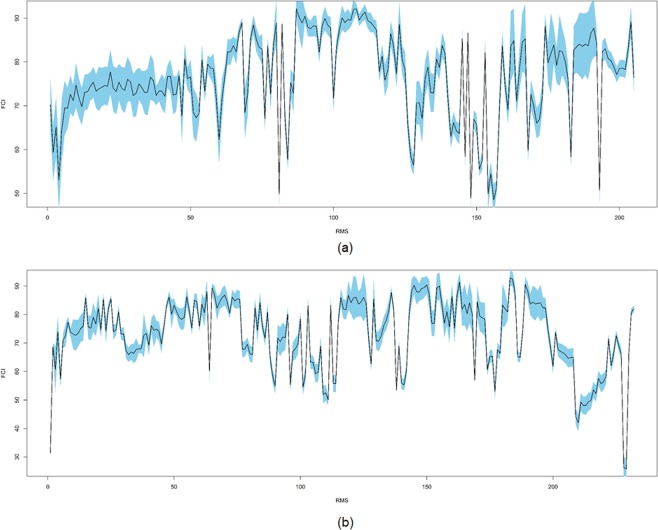
Many natural product chemists are working to identify a wide variety of novel secondary metabolites from natural materials and are eager to avoid repeatedly discovering known compounds. Here, we developed liquid chromatography/mass spectrometry (LC/MS) data-processing protocols for assessing high-throughput spectral data from natural sources and scoring the novelty of unknown metabolites from natural products. This approach automatically produces representative MS spectra (RMSs) corresponding to single secondary metabolites in natural sources. In this study, we used the RMSs of Agrimonia pilosa roots and aerial parts as models to reveal the structural similarities of their secondary metabolites and identify novel compounds, as well as isolation of three types of nine new compounds including three pilosanidin- and four pilosanol-type molecules and two 3-hydroxy-3-methylglutaryl (HMG)-conjugated chromones. Furthermore, we devised a new scoring system, the Fresh Compound Index (FCI), which grades the novelty of single secondary metabolites from a natural material using an in-house database constructed from 466 representative medicinal plants from East Asian countries. We expect that the FCIs of RMSs in a sample will help natural product chemists to discover other compounds of interest with similar chemical scaffolds or novel compounds and will provide insights relevant to the structural diversity and novelty of secondary metabolites in natural products.


Conflict of interest statement

The authors declare no competing interests.

Figures

Figure 1
Figure 1
An overview of the acquisition procedure of the RMSs from the raw MS spectra.
Figure 2
Figure 2
The LC chromatograms of the extracts of A. pilosa roots (a) and the aerial parts (b) RMSs profiles mapped with the RMS profiles colored in red. The similarity score threshold between consecutive MS spectra was set at 0.95.
Figure 3
Figure 3
The RMSs profile of fourteen compounds (1, 2, 611 and 1621) previously reported from A. pilosa roots.
Figure 4
Figure 4
The heatmap of all 236 RMSs from A. pilosa (117 for roots and 119 for aerial parts), which each consist of more than four raw spectra (a). The HCA was performed with Pearson correlation method as the distance measure and ward.D linkage as the clustering method. The dendrograms for the regions encompassed by the dashed boxes (b–f) in the heatmap display the leaves for compounds 143, which are shown in violet for pilosanidins (15) and pilosanols (615), blue for agrimolides (1622), dark red for chromones (2226), yellow for triterpenes (2335) and sky blue for flavonoids (3643).
Figure 5
Figure 5
The symmetric matrix consisting of the similarity score profiles between m RMSs in a sample and n reference RMSs in our in-house database for the HCA (a). xi,j denotes the dot-product similarity score between the ith RMS (Si) in a sample and the jth reference RMS (Sj) in our in-house database. FCIi, the normalized sum of the similarity scores vector of Si, represents the structural novelty of a secondary metabolite in a sample relative to the reference RMSs in our in-house database. The LC chromatograms mapped with RMS are shown in red (upper), and the FCIs profile corresponding to the RMSs (lower) from A. pilosa roots (b) and the aerial parts (c). Compounds 143 are shown in violet for pilosanidins (15) and pilosanols (615), blue for agrimolides (1622), dark red for chromones (2226), yellow for triterpenes (2335) and sky blue for flavonoids (3643). The newly isolated compounds (35, 1215, 25 and 26) are indicated by a red asterisk. The trend lines of the cumulative relative frequency of the similarity scores of the RMSs corresponding to the chemical scaffolds, pilosanidins and pilosanols (violet), agrimolides (blue), chromones (dark red), triterpenes (yellow) and flavonoids (sky blue) (d). The points and solid lines represent the cumulative relative frequency of the similarity scores, which are separated by intervals of 0.1, of each RMS against the reference RMSs in our in-house database and the mean values of the cumulative relative frequency, respectively. The standard deviations of each interval of the points are shaded in gray.
Figure 6
Figure 6
The FCI profiles of the RMSs of A. pilosa roots (a) and the aerial parts (b). The FCIs and the 95% confidence intervals of the FCIs are plotted with solid lines and are shaded in light blue.

References

    1. Harvey AL. Natural products in drug discovery. Drug Discov Today. 2008;13:894–901. doi: 10.1016/j.drudis.2008.07.004. - DOI - PubMed
    1. Bouslimani A, Sanchez LM, Garg N, Dorrestein PC. Mass spectrometry of natural products: current, emerging and future technologies. Nat Prod Rep. 2014;31:718–729. doi: 10.1039/c4np00044g. - DOI - PMC - PubMed
    1. Berkov S, Mutafova B, Christen P. Molecular biodiversity and recent analytical developments: a marriage of convenience. Biotechnol. Adv. 2014;32:1102–1110. doi: 10.1016/j.biotechadv.2014.04.005. - DOI - PubMed
    1. Makarov A, et al. Performance evaluation of a hybrid linear ion trap/orbitrap mass spectrometer. Anal. Chem. 2006;78:2113–2120. doi: 10.1021/ac0518811. - DOI - PubMed
    1. Makarov A, Denisov E, Lange O, Horning S. Dynamic range of mass accuracy in LTQ Orbitrap hybrid mass spectrometer. J. Am. Soc. Mass Spectrom. 2006;17:977–982. doi: 10.1016/j.jasms.2006.03.006. - DOI - PubMed

Publication types

MeSH terms

Substances