. 2020 May;98(5):826-842.
doi: 10.1002/jnr.24557. Epub 2019 Nov 22.

Parenchymal pericytes are not the major contributor of extracellular matrix in the fibrotic scar after stroke in male mice

Affiliations

Parenchymal pericytes are not the major contributor of extracellular matrix in the fibrotic scar after stroke in male mice

Michaela Roth et al. J Neurosci Res. 2020 May.

Abstract

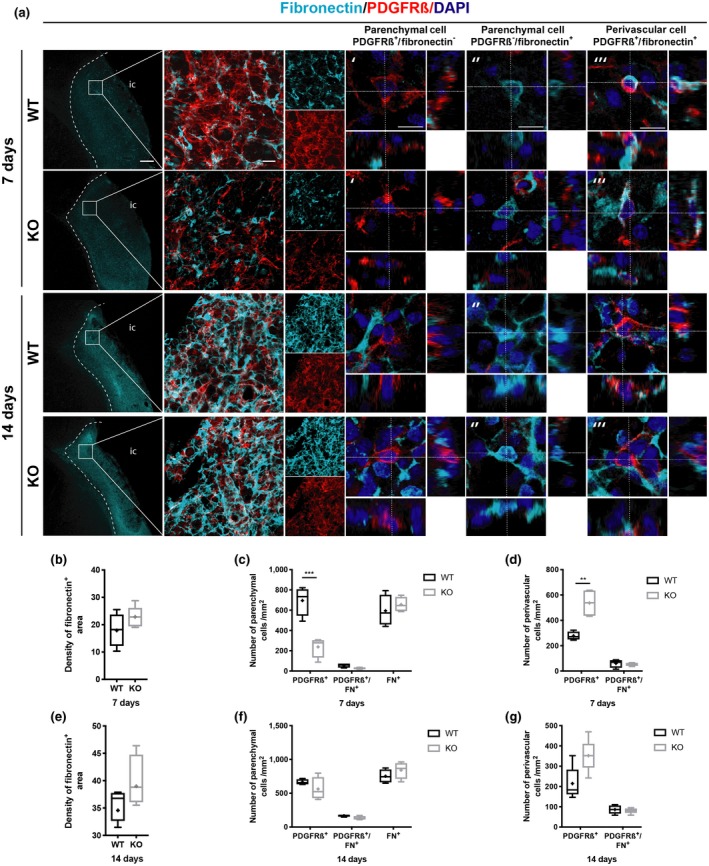
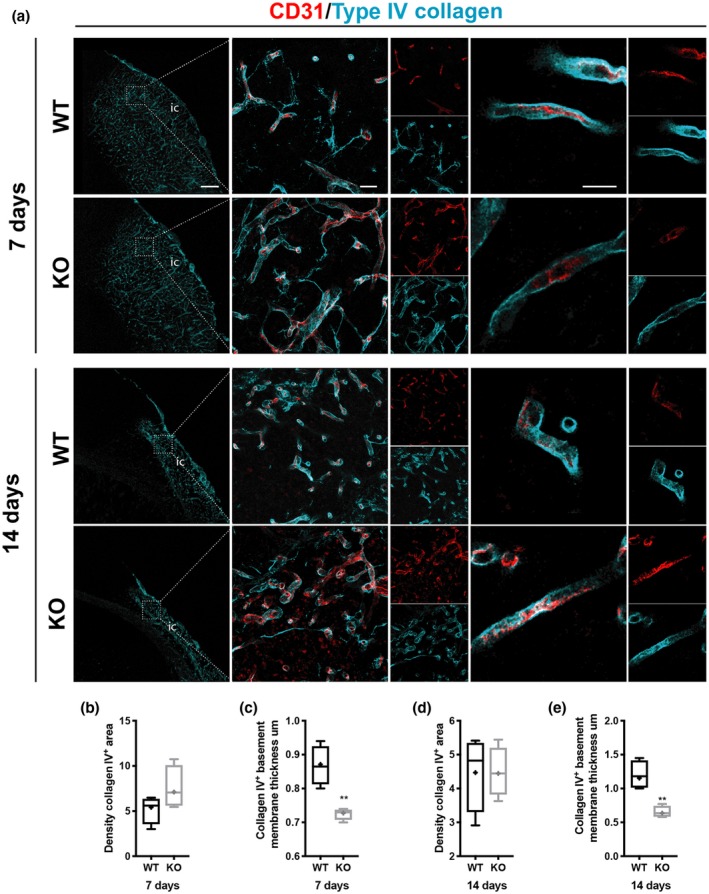
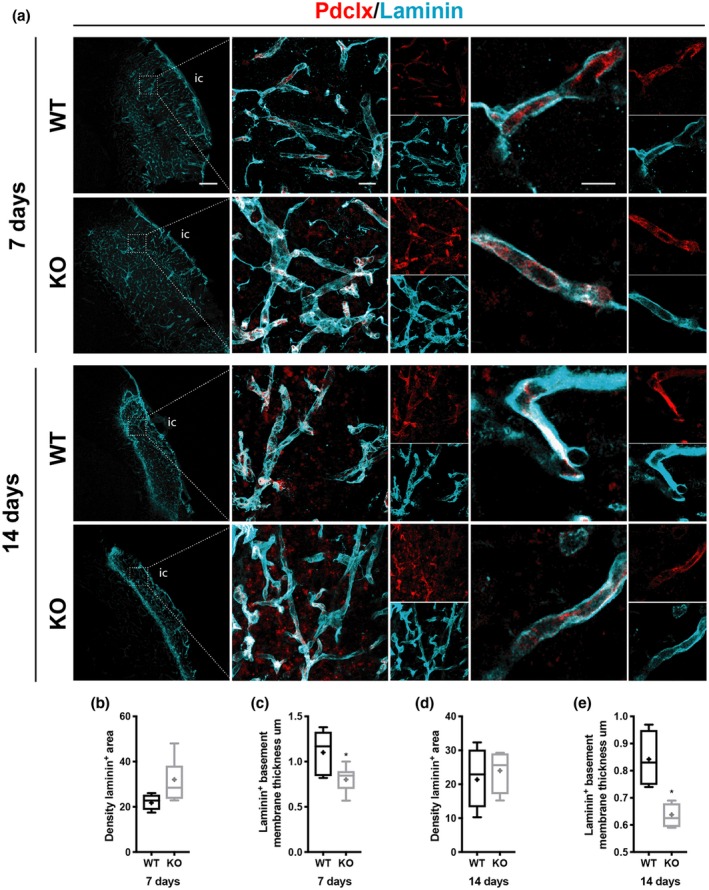
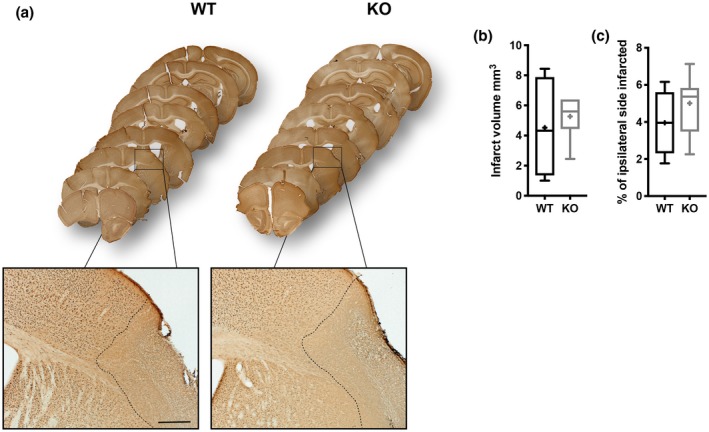
Scar formation after injury of the brain or spinal cord is a common event. While glial scar formation by astrocytes has been extensively studied, much less is known about the fibrotic scar, in particular after stroke. Platelet-derived growth factor receptor ß-expressing (PDGFRß+ ) pericytes have been suggested as a source of the fibrotic scar depositing fibrous extracellular matrix (ECM) proteins after detaching from the vessel wall. However, to what extent these parenchymal PDGFRß+ cells contribute to the fibrotic scar and whether targeting these cells affects fibrotic scar formation in stroke is still unclear. Here, we utilize male transgenic mice that after a permanent middle cerebral artery occlusion stroke model have a shift from a parenchymal to a perivascular location of PDGFRß+ cells due to the loss of regulator of G-protein signaling 5 in pericytes. We find that only a small fraction of parenchymal PDGFRß+ cells co-label with type I collagen and fibronectin. Consequently, a reduction in parenchymal PDGFRß+ cells by ca. 50% did not affect the overall type I collagen or fibronectin deposition after stroke. The redistribution of PDGFRß+ cells to a perivascular location, however, resulted in a reduced thickening of the vascular basement membrane and changed the temporal dynamics of glial scar maturation after stroke. We demonstrate that parenchymal PDGFRß+ cells are not the main contributor to the fibrotic ECM, and therefore targeting these cells might not impact on fibrotic scar formation after stroke.

Keywords: RRID:AB_2082660; RRID:AB_2105706; RRID:AB_2162497; RRID:AB_217595; RRID:AB_2298772; RRID:AB_298179; RRID:AB_305808; RRID:AB_354858; RRID:AB_393571; RRID:AB_467492; RRID:SCR_002798; RRID:SCR_003070; RRID:SCR_010279; collagen; extracellular matrix; fibronectin; fibrotic scar; glial scar; pericytes; stroke.


Conflict of interest statement

The authors declare no conflict of interest.

Figures

Figure 1
Figure 1
Loss of RGS5 in pericytes results in decreased numbers of parenchymal platelet‐derived growth factor receptor ß‐positive (PDGFRß+) cells in the fibrotic scar after stroke. (a) Representative confocal images showing PDGFRß+ cells (red) in the fibrotic scar within the infarct core surrounded by a glial fibrillary acidic protein (GFAP+) glial scar (green) at 7 and 14 days in wild‐type (WT) and RGS5‐knockout (KO) mice. (b) Representative confocal images of the infarct core, illustrating the spatial distribution of PDGFRß+ cells (red) in relation to blood vessels (podocalyxin, cyan) of RGS5‐KO and WT mice at 7 and 14 days after stroke. (c) 3D representations of a PDGFRß+ cell (red) in the parenchyma distance to a vessel (cyan) (upper panel) and a perivascular PDGFRß+ cell contacting the vessel. (d) Quantification of the density of PDGFRß+ area in RGS5‐KO and WT mice at 7. (e) Quantification of number of parenchymal PDGFRß+ cells in RGS5‐KO and WT mice at 7 days. (f) Quantification of number of perivascular PDGFRß+ cells in RGS5‐KO and WT mice at 7 days. (g) Quantification of density of PDGFRß+ area in RGS5‐KO and WT mice at 14 days. (h) Quantification of number of parenchymal PDGFRß+ cells in RGS5‐KO and WT mice at 14 days. (i) Quantification of number of perivascular PDGFRß+ cells in RGS5‐KO and WT mice at 14 days. IC, infarct core; PI, peri‐infarct area; Pdclx, podocalyxin. N = 5; data are represented in box and whiskers plots (median, lower, and upper quartiles, minimum and maximal value, and “+” indicates mean). **p < 0.01, ***p < 0.001, Student's t‐test. Scale bars 200, 20, 5 µm
Figure 2
Figure 2
Majority of type I collagen deposition occurs around perivascular but not parenchymal platelet‐derived growth factor receptor ß‐positive (PDGFRß+) cells. (a) Confocal images of type I collagen (cyan), PDGFRß (red), and DAPI (blue) at 7 and 14 days. Left column shows an increase in type I collagen within the infarct core after stroke (outlined with dotted lines) in wild‐type (WT) and RGS5‐KO mice at both time points. Box indicates that second column images were taken within the infarct core. Second column shows distribution of type I collagen in relation to PDGFRß staining, with respective single stainings on the right. White arrow indicating that majority of parenchymal PDGFRß+ cells are negative for type I collagen. Yellow arrows indicate the rare presence of parenchymal PDGFRß+/ type I collagen cells. Orthogonal view of higher magnifications illustrate examples of parenchymal PDGFRß‐positive cells negative for type I collagen (′), parenchymal PDGFRß‐positive/type I collagen‐positive cells (″) and perivascular PDGFRß‐positive/type I collagen‐positive cells (‴). (b) Quantification of type I collagen density at 7 days. (c) Quantification of total number of parenchymal PDGFRß cells that are either positive or negative for type I collagen at 7 days. (d) Quantification of number of total perivascular PDGFRß cells, that are either positive or negative for type I collagen at 7 days. (e) Quantification of type I collagen density at 14 days. (f) Quantification of the total number of parenchymal PDGFRß cells, that are either positive or negative for type I collagen at 14 days. (g) Quantification of number of total perivascular PDGFRß cells, that are either positive or negative for type I collagen at 14 days. IC, infarct core, Coll I, type I collagen. N = 5. Data shown in box and whiskers plots (median, lower, and upper quartiles, minimum and maximal value, and “+” indicates mean). **p < 0.01, ***p < 0.001. Student's t‐test (b, e) and multiple t‐tests with Bonferroni post hoc analysis (c, d, f, g). Scale bars: 200, 20, 10 µm
Figure 3
Figure 3
Only very few platelet‐derived growth factor receptor ß (PDGFRß+) cells contribute to fibronectin deposition. (a) Confocal images of fibronectin (cyan), PDGFRß (red), and DAPI (blue) at 7 and 14 days. First column shows increase in fibronectin deposition within the infarct core after stroke (outlined with dotted lines) in wild‐type (WT) and RGS5‐KO mice at both time points. Boxes indicate that second column images were taken within the infarct core. Second column shows the distribution of fibronectin in relation to PDGFRß staining, with respective single staining on the right. Higher magnifications show orthogonal view of a parenchymal PDGFRß+ cell that is negative for fibronectin (′), parenchymal fibronectin+ cell that is PDGFRß‐negative (″), and perivascular PDGFRß+/fibronectin+ cell (‴). (b) Quantification of fibronectin density at 7 days. (c) Quantification of total number of parenchymal cells that are either PDGFRß+ or FN+, and number of double positive cells at 7 days after stroke. (d) Quantification of total number perivascular PDGFRß+ cells and perivascular PDGFRß+/fibronectin+ cells at 7 days after stroke. (e) Quantification of fibronectin density at 14 days. (f) Quantification of total parenchymal cells that are either PDGFRß+ or fibronectin+, and number of double positive cells at 14 days after stroke. (g) Quantification of total number of perivascular PDGFRß+ cells and perivascular PDGFRß+/fibronectin+ cells at 14 days after stroke. FN, fibronectin; IC, infarct core. N = 5. Data shown in box and whiskers plots (median, lower and upper quartiles, minimum and maximal value, and “+” indicates mean). **p < 0.01. Student's t‐test (b, e) and multiple t‐tests with Bonferroni post‐hoc analysis (c, d, f, g). Scale bars: 200, 20, 10 µm
Figure 4
Figure 4
RGS5‐KO mice have reduced thickness of type IV collagen+ vascular basement membrane after stroke. (a) Confocal images of type IV collagen (cyan) and the blood vessel marker CD31 (red) at 7 and 14 days. Left column shows type IV collagen distribution in wild‐type (WT) and RGS5‐KO mice at both time points. The box indicates where the higher magnification picture in middle column has been taken from. Right column shows a high magnification of single z‐stack through a blood vessel to illustrate the thickness of the vascular basement membrane that is reduced in RGS5‐KO mice. (b) Quantification of type IV Collagen area density at 7 days. (c) Quantification of thickness of type IV collagen+ vascular basement membrane at 7 days. (d) Quantification of type IV collagen area density at 14 days. (e) Quantification of thickness of type IV collagen+ vascular basement membrane at 14 days. IC: infarct core. N = 5. Data shown in box and whiskers plots (median, lower and upper quartiles, minimum and maximal value, and “+” indicates mean). **p < 0.01. Student's t‐test. Scale bars: 200, 20, 10 µm
Figure 5
Figure 5
RGS5‐KO mice have reduced thickness of laminin+ vascular basement membrane after stroke. (a) Confocal images of laminin (cyan) and blood vessel marker Pdclx (red) at 7 and 14 days. The box indicates where the higher magnification picture in middle column has been taken from. Right column shows high magnification of single z‐stack through a blood vessel to illustrate the reduced thickness of the vascular basement membrane in RGS5‐KO mice. (b) Quantification of laminin+ area density at 7 days. (c) Quantification of the thickness of laminin+ vascular basement membrane at 7 days. (d) Quantification of laminin area density at 14 days. (e) Quantification of the thickness of laminin+ vascular basement membrane at 14 days. IC, infarct core. Pdclx, podocalyxin. N = 5. Data shown in box and whiskers plots (median, lower and upper quartiles, minimum and maximal value, and “+” indicates mean). *p < 0.05. Student's t‐test. Scale bars: 200, 20, 10 µm
Figure 6
Figure 6
RGS5‐KO mice show earlier polarization of glial scar after stroke. (a) Confocal images of glial fibrillary acidic protein (GFAP) (red) and 4',6'‐Diamidin‐2‐phenylindol  (DAPI) (white) at 7 and 14 days. First column shows an overview of the glial scar, with the infarct core outlined. The box indicates where the picture on the second column was taken. (b) GFAP+ cell outside the peri‐infarct area, taken as indicated with asterisk in panel a. (c) Quantification of GFAP+ cell numbers at 7 days in peri‐infarct area showing decreased numbers in RGS5‐KO mice. (d) Quantification of GFAP density in peri‐infarct area at 7 days. (e) Quantification of the thickness of the glial scar (as highlighted in overview picture) at 7 days. (f) Quantification of GFAP+ cell numbers at 14 days in the peri‐infarct area. (g) Quantification of GFAP density in the peri‐infarct area at 14 days. (h) Quantification of the thickness of the glial scar at 14 days. IC: infarct core. N = 5. Data shown in box and whiskers plots (median, lower and upper quartiles, minimum and maximal value, and “+” indicates mean). **p < 0.05, ***p < 0.001. Student's t‐test. Scale bars: 200, 20, 10 µm
Figure 7
Figure 7
Loss of RGS5 in pericytes does not affect stroke size at 14 days after stroke. (a) Whole brain series of wild‐type (WT) and RGS5‐KO mice 14 days after stroke stained with NeuN. Box indicates where higher magnification was taken. Dotted lines indicate area that is depleted of NeuN+ cells. (b) Quantification of the infarct volume. (c) Quantification of the relative infarcted area. N = 5. Data shown in box and whiskers plots (median, lower and upper quartiles, minimum and maximal value, and “+” indicates mean), Student's t‐test. Scale bar: 200 µm

References

    1. Armulik, A. , Genové, G. , & Betsholtz, C. (2011). Pericytes: Developmental, physiological, and pathological perspectives, problems, and promises. Developmental Cell, 21(2), 193–215. 10.1016/j.devcel.2011.07.001 - DOI - PubMed
    1. Armulik, A. , Genové, G. , Mäe, M. , Nisancioglu, M. H. , Wallgard, E. , Niaudet, C. , … Betsholtz, C. (2010). Pericytes regulate the blood‐brain barrier. Nature, 468(7323), 557–561. 10.1038/nature09522 - DOI - PubMed
    1. Bahrami, A. J. , Gunaje, J. J. , Hayes, B. J. , Riehle, K. J. , Kenerson, H. L. , Yeung, R. S. , … Mahoney, W. M., Jr . (2014). Regulator of G‐protein signaling‐5 is a marker of hepatic stellate cells and expression mediates response to liver injury. PLoS One, 9(10), e108505 10.1371/journal.pone.0108505 - DOI - PMC - PubMed
    1. Bertossi, M. , Girolamo, F. , Errede, M. , Virgintino, D. , & Roncali, L. (2003). Effects of 6‐aminonicotinamide gliotoxin on blood‐brain barrier differentiation in the chick embryo cerebellum. Anatomy and Embryology, 207(3), 209–219. 10.1007/s00429-003-0335-4 - DOI - PubMed
    1. Bonkowski, D. , Katyshev, V. , Balabanov, R. D. , Borisov, A. , & Dore Duffy, P. (2011). The CNS microvascular pericyte: Pericyte‐astrocyte crosstalk in the regulation of tissue survival. Fluids and Barriers of the CNS, 8(1), 8 10.1186/2045-8118-8-8 - DOI - PMC - PubMed

Publication types