

Technology-enabled comprehensive characterization of multiple sclerosis in clinical practice
- PMID: 31759186
- PMCID: PMC6943942
- DOI: 10.1016/j.msard.2019.101525
Technology-enabled comprehensive characterization of multiple sclerosis in clinical practice
Abstract
Background: Objective and longitudinal measurements of disability in patients with multiple sclerosis (MS) are desired in order to monitor disease status and response to disease-modifying and symptomatic therapies. Technology-enabled comprehensive assessment of MS patients, including neuroperformance tests (NPTs), patient-reported outcome measures (PROMs), and MRI, is incorporated into clinical care at our center. The relationships of each NPT with PROMs and MRI measures in a real-world setting are incompletely studied, particularly in larger datasets.
Objectives: To demonstrate the utility of comprehensive neurological assessment and determine the association between NPTs, PROMs, and quantitative MRI measures in a large MS clinical cohort.
Methods: NPTs (processing speed [PST], contrast sensitivity [CST], manual dexterity [MDT], and walking speed [WST]) and physical disability-related PROMs (Quality of Life in Neurological Disorders [Neuro-QoL], Patient Determined Disease Steps [PDDS], and Patient-Reported Outcomes Measurement Information System Global-10 [PROMIS-10] physical) were collected as part of routine clinical care. Fully-automated MRI analysis calculated T2-lesion volume (T2LV), whole brain fraction (WBF), thalamic volume (TV), and cervical spinal cord cross-sectional area (CA) for brain MRIs completed within 3 months of a clinic visit during which NPTs and PROMs were assessed. Spearman's rank correlation coefficients evaluated the cross-sectional associations of NPTs with PROMs and MRI measures. Linear regression was utilized to determine which combination of clinical characteristics, patient demographics, MRI measures, and PROMs best cross-sectionally explained each NPT result.
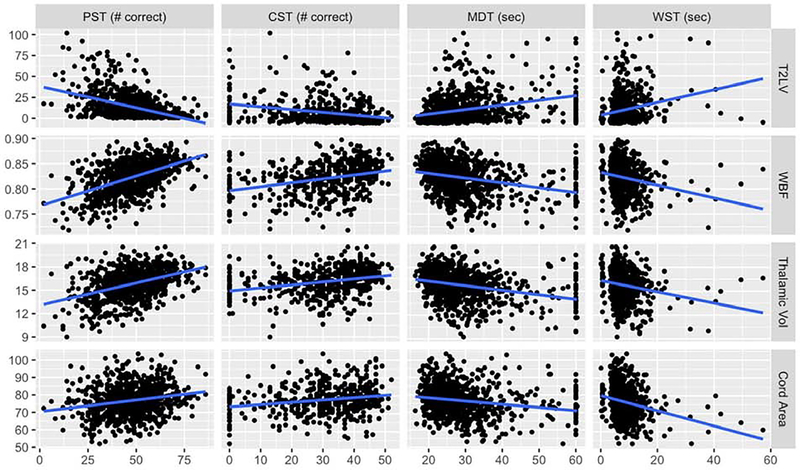
Results: 997 unique patients (age 47.7 ± 11.4 years, 71.8% female) who underwent assessments over a 2-year period were included. Correlations among NPTs and PROMs were moderate. PST correlations were strongest for Neuro-QoL upper extremity (NQ-UE) (Spearman's rho = 0.43) and lower extremity (NQ-LE) (0.47). CST correlations were strongest for NQ-UE (0.33), NQ-LE (0.36), and PDDS (-0.31). MDT correlations were strongest for NQ-UE (-0.53), NQ-LE (-0.54), and PDDS (0.53). WST correlations were strongest for PDDS (0.64) and NQ-LE (-0.65). NPTs also had moderate correlations with MRI metrics, the strongest of which were observed with PST (with T2LV (-0.44) and WBF (0.49)). Spearman's rho for other NPT-MRI correlations ranged from 0.23 to 0.36. Linear regression identified age, disease duration, PROMIS-10 physical, NQ-UE, NQ-LE, T2LV and WBF as significant cross-sectional explanatory variables for PST (adjusted R2=0.46). For CST, significant variables included age and NQ-LE (adjusted R2 = 0.30). For MDT, significant variables included PDDS, PROMIS-10 physical, NQ-UE, NQ-LE, T2LV, and WBF (adjusted R2=0.37). For WST, significant variables included sex, PDDS, NQ-LE, T2LV, and CA (adjusted R2=0.39).
Conclusions: Impaired performance on NPTs correlated with worse physical disability-related PROMs and MRI disease severity, but the strongest cross-sectional explanatory variables for each NPT component varied. This study supports the use of comprehensive, objective quantification of MS status in clinical and research settings. Future longitudinal analyses can determine predictors of treatment response and disability worsening.
Keywords: Multiple sclerosis; Outcome measurement; Patient-reported outcome measures; Quality of life; Quantitative MRI.
Copyright © 2019 Elsevier B.V. All rights reserved.
Conflict of interest statement
Declaration of Competing Interest Dr. Laura Baldassari has received personal fees for serving on a scientific advisory board for Teva. Dr. Kunio Nakamura has received personal fees for consulting from NeuroRx Research, speaking from Sanofi Genzyme, and license from Biogen Idec. He has received research support from NIH NINDS, NMSS, DOD, Biogen, Sanofi Genzyme, and Novartis. Dr. Brandon Moss reports personal compensation for consulting for Genentech and speaking for Genzyme. Dr. Gabrielle Macaron has served on an advisory board for Genentech. She receives fellowship funding from Biogen (#6873-P-FEL). Ms. Hong Li: No declarations of interest. Ms. Malory Weber: No declarations of interest. Dr. Stephen Jones has received travel and speaking fees from Siemens and IMRIS, speaking fees from Radnet and Saint Judes, research support and travel fees from MS PATHS, and research support from the NIH. Dr. Stephen Rao has received honoraria, royalties or consulting fees from Biogen, Genzyme, Novartis, American Psychological Association, International Neuropsychological Society and research funding from the National Institutes of Health, US Department of Defense, National Multiple Sclerosis Society, CHDI Foundation, Biogen, and Novartis. He contributed to intellectual property that is a part of the MSPT, for which he has the potential to receive royalties. Dr. Deborah Miller has contributed to intellectual property that is a part of the MSPT, for which she has the potential to receive royalties. Dr. Devon Conway has received research support paid to his institution from the National Multiple Sclerosis Society and Novartis Pharmaceuticals. He has received personal consulting fees from Novartis Pharmaceuticals and Tanabe Laboratories. Dr. Robert Bermel has served as a consultant for Biogen, Genzyme/Sanofi, Genentech/Roche, and Novartis. He receives research support from Biogen and Genentech, and contributed to intellectual property that is a part of the MSPT, for which he has the potential to receive royalties. Dr. Jeffrey Cohen has received personal fees for consulting for Convelo, Population Council; speaking for Mylan; and serving as an Editor of Multiple Sclerosis Journal. Dr. Daniel Ontaneda has received research support from National Multiple Sclerosis Society, National Institutes of Health, Patient Centered Outcomes Research Institute, Race to Erase MS Foundation, Genentech, and Genzyme. He has also received consulting fees from Biogen, Genentech/Roche, Genzyme, Novartis, and Merck. Dr. Marisa McGinley has served on scientific advisory boards for Genzyme and Genentech.
Figures


References
-
- Balcer LJ, Baier ML, Cohen JA, Kooijmans MF, Sandrock AW, Nano-Schiavi ML, Pfohl DC, Mills M, Bowen J, Ford C, Heidenreich FR, Jacobs DA, Markowitz CE, Stuart WH, Ying GS, Galetta SL, Maguire MG, Cutter GR, 2003. Contrast letter acuity as a visual component for the Multiple Sclerosis Functional Composite. Neurology 61(10), 1367–1373. - PubMed
-
- Bergsland N, Zivadinov R, Dwyer MG, Weinstock-Guttman B, Benedict RH, 2016. Localized atrophy of the thalamus and slowed cognitive processing speed in MS patients. Mult Scler 22(10), 1327–1336. - PubMed
-
- Bisecco A, Stamenova S, Caiazzo G, d’Ambrosio A, Sacco R, Docimo R, Esposito S, Cirillo M, Esposito F, Bonavita S, Tedeschi G, Gallo A, 2018. Attention and processing speed performance in multiple sclerosis is mostly related to thalamic volume. Brain imaging and behavior 12(1), 20–28. - PubMed
MeSH terms
Grants and funding
LinkOut - more resources
Full Text Sources
Medical
