. 2020 Nov;40(11):2289-2303.
doi: 10.1177/0271678X19890830. Epub 2019 Nov 23.

Neurovascular coupling preserved in a chronic mouse model of Alzheimer's disease: Methodology is critical

Affiliations

Neurovascular coupling preserved in a chronic mouse model of Alzheimer's disease: Methodology is critical

Paul S Sharp et al. J Cereb Blood Flow Metab. 2020 Nov.

Abstract

Impaired neurovascular coupling has been suggested as an early pathogenic factor in Alzheimer's disease (AD), which could serve as an early biomarker of cerebral pathology. We have established an anaesthetic regime to allow repeated measurements of neurovascular function over three months in the J20 mouse model of AD (J20-AD) and wild-type (WT) controls. Animals were 9-12 months old at the start of the experiment. Mice were chronically prepared with a cranial window through which 2-Dimensional optical imaging spectroscopy (2D-OIS) was used to generate functional maps of the cerebral blood volume and saturation changes evoked by whisker stimulation and vascular reactivity challenges. Unexpectedly, the hemodynamic responses were largely preserved in the J20-AD group. This result failed to confirm previous investigations using the J20-AD model. However, a final acute electrophysiology and 2D-OIS experiment was performed to measure both neural and hemodynamic responses concurrently. In this experiment, previously reported deficits in neurovascular coupling in the J20-AD model were observed. This suggests that J20-AD mice may be more susceptible to the physiologically stressing conditions of an acute experimental procedure compared to WT animals. These results therefore highlight the importance of experimental procedure when determining the characteristics of animal models of human disease.

Keywords: Barrel cortex; J20; blood flow; electrophysiology; optical imaging.


Conflict of interest statement

The author(s) declared no potential conflicts of interest with respect to the research, authorship, and/or publication of this article.

Figures
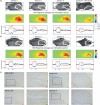
Figure 1.
Figure 1.
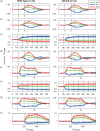
Representative hemodynamic responses from WT (a) and J20-AD mice (b) across three chronic imaging sessions (1–3) each separated by ∼30 days and a final acute session (4) where a multi-channel electrode is inserted into the activated whisker region. Activation maps represent the change in Hbt with respect to baseline during a 16-s mechanical whisker stimulation. Time series take for Hbt, Hbr and Hbo are taken from the activated whisker region highlighted in white on the reference images (rows 1 and 3). Hbt: total blood volume, Hbo: oxyhemoglobin, Hbr: deoxyhemoglobin. (c) Representative images of Aβ plaques from 12-month wild type and J20-AD mice from hippocampus (HPC) and primary somatosensory cortex (S1). There is strong deposition of plaques in the hippocampus but relatively few in the cortex. Top row shows J20-AD mice bottom row WT controls. Column one shows HPC (scale bar = 200 µm), column two zoomed in box inset regions of HPC (scale bar = 100 µm), column three S1 cortex with column four showing zoomed in box inset regions of S1.
Figure 2.
Figure 2.
Neurovascular coupling preserved in J20-AD mice. Hemodynamic time series (Hbt, Hbr and Hbo) averaged across chronic sessions for each of the eight experiments (a–h). WT responses are illustrated in the left column and J20-AD in the right column. Error bars =standard deviation.
Figure 3.
Figure 3.
Average hemodynamic time series responses take across all eight experiments (a–h) in for the acute imaging session with WT in the left column and J20-AD in the right column. Error bars =standard deviation.
Figure 4.
Figure 4.
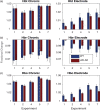
Average magnitude of fractional hemodynamic response for both chronic (left hand side) and acute session (right hand side) stimulation experiments. (a) Hbt (b) Hbr and (c) Hbo. Error bars =standard deviation.
Figure 5.
Figure 5.
Concatenated hemodynamic times series of responses across experiments for all imaging sessions (a) Wild-type chronic, (b) J20-AD Chronic, (c) Wild-type acute and (d) J20-AD acute. Shaded error bars = standard deviation.
Figure 6.
Figure 6.
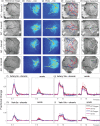
Neural responses from WT and J20-AD mice from stimulation experiments. (a) Exp1, (b) Exp2 (c) Exp4 (d) Exp5 and (e) Exp7. Left hand images represent the averaged single impulse response in the different stimulation experiments. Middle time series represents the average field potential response from channels 3–8 for WT and J20-AD mice. Right hand column represents the averaged time series impulse response from channels 3 to 8. WT = black time series, J20-AD = red time series, Shaded error bars = standard deviation.
Figure 7.
Figure 7.
Anatomically compartmentalised vascular responses for four representative animals (a) Reference image showing cortical vasculature (b) The first principal component of the Hbt image data block (c) First principal component of the Hbr image data block. (d) Reference images with superimposed surface arteries (red) and veins (blue) (e) Calculated whisker response region with selected artery and vein regions. (f) Hbt (blood volume) 2-s stimulation response in the arterial compartment for chronic (left) and acute (right) experiments. (g) Hbt 16-s stimulation response in the arterial compartment for chronic (left) and acute (right) experiments. (h) Hbt 2-s stimulation response in the venous compartment for chronic (left) and acute (right) experiments. (i) Hbt 16-s stimulation response in the venous compartment for chronic (left) and acute (right) experiments.

References

    1. Hardy J.An 'anatomical cascade hypothesis' for Alzheimer's disease. Trends Neurosci 1992; 15: 200–201. - PubMed
    1. Zlokovic BV.Neurodegeneration and the neurovascular unit. Nat Med 2010; 16: 1370–1371. - PubMed
    1. Zlokovic BV.Neurovascular pathways to neurodegeneration in Alzheimer's disease and other disorders. Nat Rev Neurosci 2011; 12: 723–738. - PMC - PubMed
    1. Iturria-Medina Y, Sotero RC, Toussaint PJ, et al.. Early role of vascular dysregulation on late-onset Alzheimer's disease based on multifactorial data-driven analysis. Nat Commun 2016; 7: 11934. - PMC - PubMed
    1. Ameen-Ali KE, Wharton SB, Simpson JE, et al.. Review: neuropathology and behavioural features of transgenic murine models of Alzheimer's disease. Neuropathol Appl Neurobiol 2017; 43: 553–570. - PubMed

Publication types