

Making the Most of Clumping and Thresholding for Polygenic Scores
- PMID: 31761295
- PMCID: PMC6904799
- DOI: 10.1016/j.ajhg.2019.11.001
Making the Most of Clumping and Thresholding for Polygenic Scores
Abstract
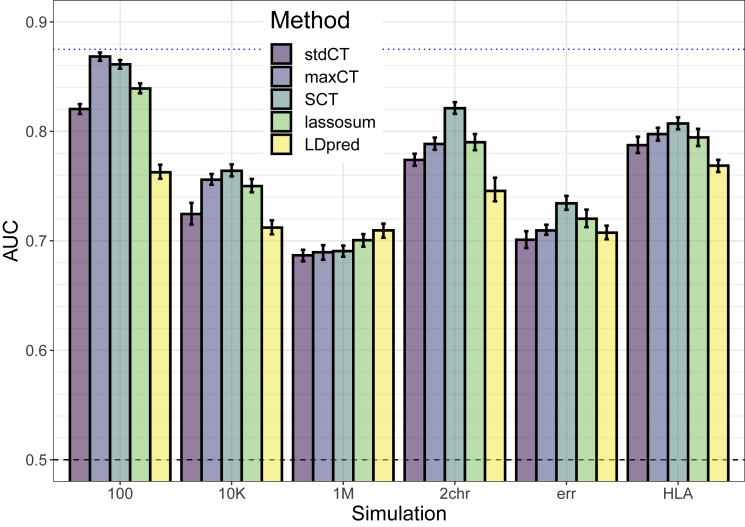
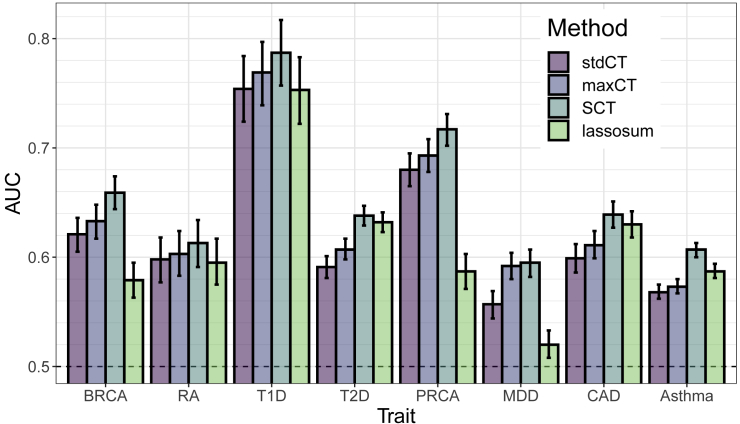
Polygenic prediction has the potential to contribute to precision medicine. Clumping and thresholding (C+T) is a widely used method to derive polygenic scores. When using C+T, several p value thresholds are tested to maximize predictive ability of the derived polygenic scores. Along with this p value threshold, we propose to tune three other hyper-parameters for C+T. We implement an efficient way to derive thousands of different C+T scores corresponding to a grid over four hyper-parameters. For example, it takes a few hours to derive 123K different C+T scores for 300K individuals and 1M variants using 16 physical cores. We find that optimizing over these four hyper-parameters improves the predictive performance of C+T in both simulations and real data applications as compared to tuning only the p value threshold. A particularly large increase can be noted when predicting depression status, from an AUC of 0.557 (95% CI: [0.544-0.569]) when tuning only the p value threshold to an AUC of 0.592 (95% CI: [0.580-0.604]) when tuning all four hyper-parameters we propose for C+T. We further propose stacked clumping and thresholding (SCT), a polygenic score that results from stacking all derived C+T scores. Instead of choosing one set of hyper-parameters that maximizes prediction in some training set, SCT learns an optimal linear combination of all C+T scores by using an efficient penalized regression. We apply SCT to eight different case-control diseases in the UK biobank data and find that SCT substantially improves prediction accuracy with an average AUC increase of 0.035 over standard C+T.
Keywords: C+T; PRS; UK Biobank; clumping and thresholding; complex traits; polygenic risk scores; stacking.
Copyright © 2019 American Society of Human Genetics. Published by Elsevier Inc. All rights reserved.
Conflict of interest statement
The authors declare no competing interests.
Figures
References
-
- Wray N.R., Lee S.H., Mehta D., Vinkhuyzen A.A., Dudbridge F., Middeldorp C.M. Research review: Polygenic methods and their application to psychiatric traits. J. Child Psychol. Psychiatry. 2014;55:1068–1087. - PubMed
Publication types
MeSH terms
Grants and funding
LinkOut - more resources
Full Text Sources
Other Literature Sources
Medical
