. 2019 Nov 27;179(6):1424-1435.e8.
doi: 10.1016/j.cell.2019.10.033. Epub 2019 Nov 21.

Screening Human Embryos for Polygenic Traits Has Limited Utility

Affiliations

Screening Human Embryos for Polygenic Traits Has Limited Utility

Ehud Karavani et al. Cell. .

Abstract

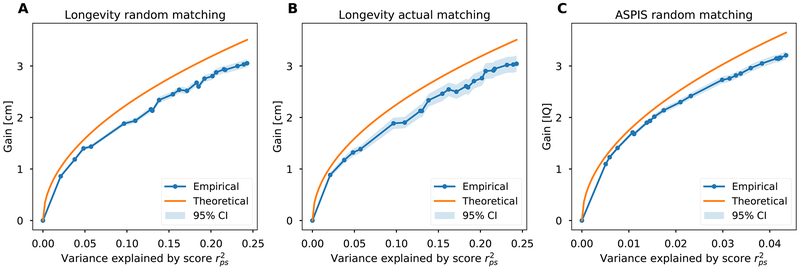
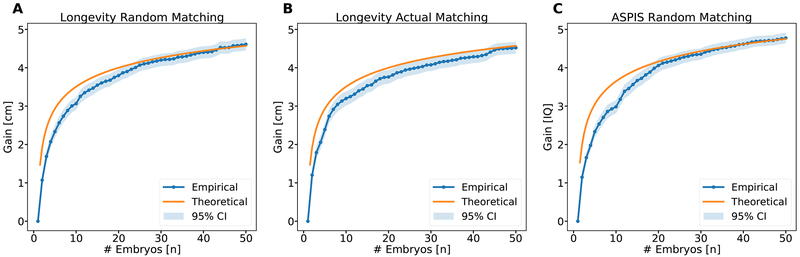
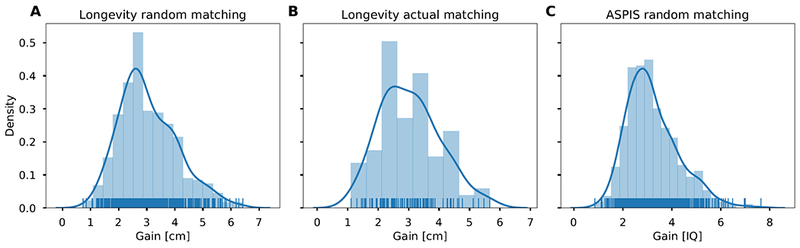
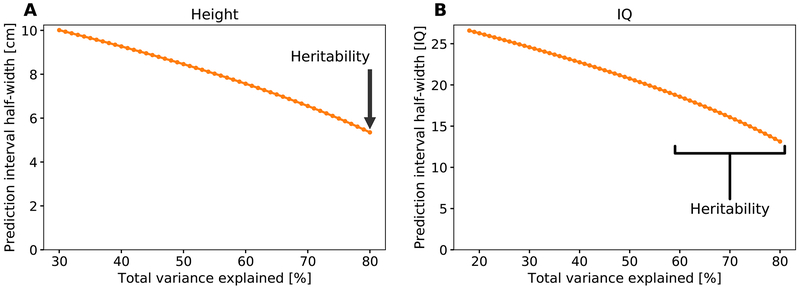
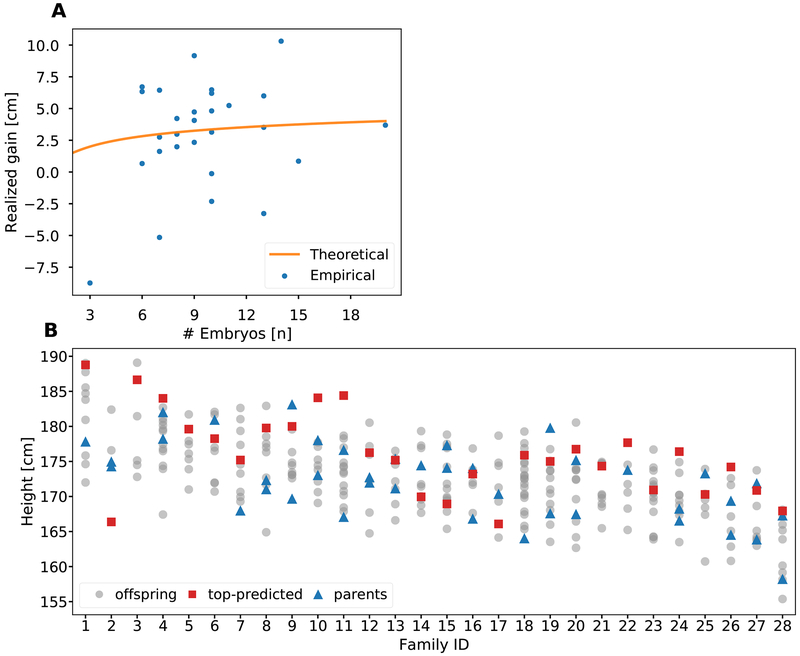
The increasing proportion of variance in human complex traits explained by polygenic scores, along with progress in preimplantation genetic diagnosis, suggests the possibility of screening embryos for traits such as height or cognitive ability. However, the expected outcomes of embryo screening are unclear, which undermines discussion of associated ethical concerns. Here, we use theory, simulations, and real data to evaluate the potential gain of embryo screening, defined as the difference in trait value between the top-scoring embryo and the average embryo. The gain increases very slowly with the number of embryos but more rapidly with the variance explained by the score. Given current technology, the average gain due to screening would be ≈2.5 cm for height and ≈2.5 IQ points for cognitive ability. These mean values are accompanied by wide prediction intervals, and indeed, in large nuclear families, the majority of children top-scoring for height are not the tallest.

Keywords: cognitive ability; complex traits; embryo screening; embryo selection; height; polygenic scores; pre-implantation genetic testing; quantitative genetics.


Conflict of interest statement

Declaration of Interests

The authors declare no competing interests.

Figures

Figure 1.
Figure 1.. The mean gain vs the proportion of the variance explained by the PS.
Blue dots and the 95% confidence intervals (light blue bands) represent simulations with 10 embryos per couple. To generate scores with increasing proportions of variance explained, we gradually added chromosomes 1 to 22 to the computed PS. The orange line corresponds to the theoretical model derived in Methods S1 and described in Eq. (1). For each value of rps2, dots are averages and 95% confidence intervals are based on ±1.96 the standard error of the mean over the simulated families. (A) Gain in height for random couples: 500 simulated pairings drawn from the Longevity cohort. (B) Gain in height for actual couples: 102 couples from the Longevity cohort. (C) Gain in IQ for random couples: 500 simulated pairings drawn from the ASPIS cohort. See also Figure S3.
Figure 2.
Figure 2.. The mean gain vs the number of embryos.
Blue dots are from simulations, and orange lines are for the theoretical prediction (Eq. (1)). All details are as in Figure 1. See also Figures S1 and S2.
Figure 3.
Figure 3.. The distribution of the predicted gain from embryo selection with 10 embryos per couple.
(A) The gain in height by simulating 500 random couples from the Longevity cohort. (B) Same as (A), but with actual spouses (n = 102). (C) The gain in IQ by simulating 500 random couples from the ASPIS cohort. Lines are estimated densities.
Figure 4.
Figure 4.. The prediction interval width as a function of the proportion of variance explained by the combination of parental phenotypes and the PS of the child.
If the proportion of variance explained is p, the half-interval width is 1.96σz1p. (A) The prediction interval for height, assuming σz = 6cm. The proportion p is unknown, but cannot exceed the heritability, which we assume to be h2 ≈ 0.8, and cannot fall under h4/2 ≈ 0.32, which is the theoretical variance explained by the mid-parental height. (B) The prediction interval for IQ, with σz = 15 points. We assume the heritability is in the range [0.6,0.8], with a minimal variance explained of 0.62/2 = 0.18.
Figure 5.
Figure 5.. An analysis of selection for height in 28 real families with up to 20 adult offspring each.
(A) The realized gain in each family, defined as the difference between the actual (age- and sex-corrected) height of the offspring with the highest PS and the average height of all offspring in the family. The theoretical prediction is based on Eq. (1). (B) The actual height (age- and sex-corrected) of all members of all families. The figure demonstrates the effect of the current low-accuracy prediction models, as the tallest-predicted sibling (red squares) is usually not the actual-tallest sibling (only 7/28 times). Siblings are depicted as grey dots, and the parents of each family as blue triangles. In some families only one parent was available.

References

    1. Allegrini A, Selzam S, Rimfeld K, von Stumm S, Pingault J-B, and Plomin R (2019). Genomic prediction of cognitive traits in childhood and adolescence. Mol Psychiatry 24, 819. - PMC - PubMed
    1. Anomaly J, Gyngell C, and Savulescu J (2019). Great minds think different: Preserving cognitive diversity in an age of gene editing. Bioethics 1–9. - PMC - PubMed
    1. Atzmon G, Barzilai N, Surks MI, and Gabriely I (2009). Genetic predisposition to elevated serum thyrotropin is associated with exceptional longevity. J. Clin. Endocrinol. Metab 94, 4768. - PMC - PubMed
    1. Aulchenko YS, Struchalin MV, Belonogova NM, Axenovich TI, Weedon MN, Hofman A, Uitterlinden AG, Kayser M, Oostra BA, Van Duijn CM, et al. (2009). Predicting human height by Victorian and genomic methods. Eur. J. Hum. Genet 17, 1070. - PMC - PubMed
    1. Barton N, Hermisson J, and Nordborg M (2019). Population Genetics: Why structure matters. Elife 8, e45380. - PMC - PubMed

Publication types