. 2019 Nov 27;179(6):1289-1305.e21.
doi: 10.1016/j.cell.2019.11.005. Epub 2019 Nov 21.

Omega-3 Fatty Acids Activate Ciliary FFAR4 to Control Adipogenesis

Affiliations

Omega-3 Fatty Acids Activate Ciliary FFAR4 to Control Adipogenesis

Keren I Hilgendorf et al. Cell. .

Abstract

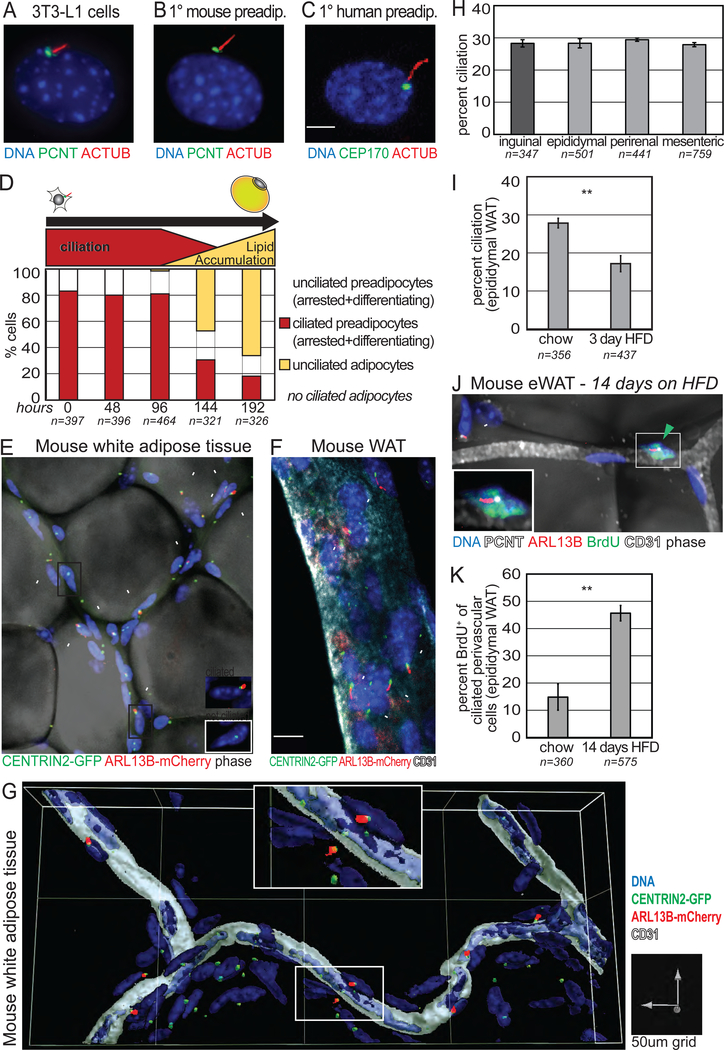
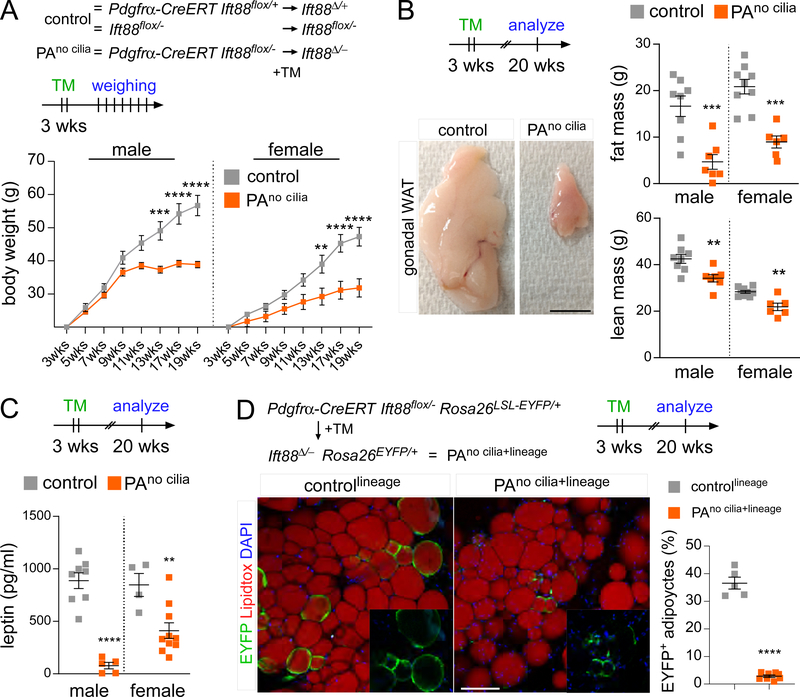
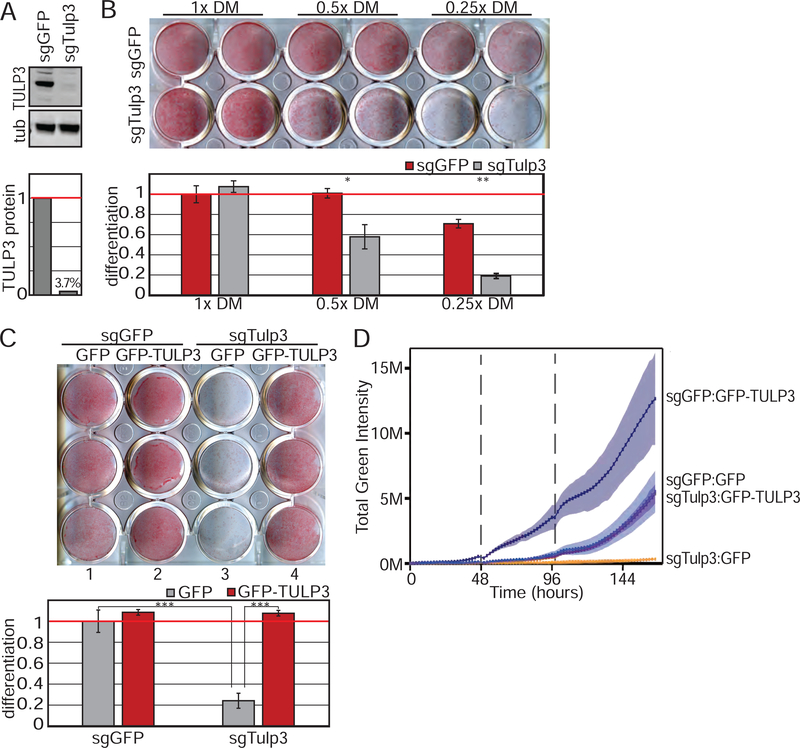
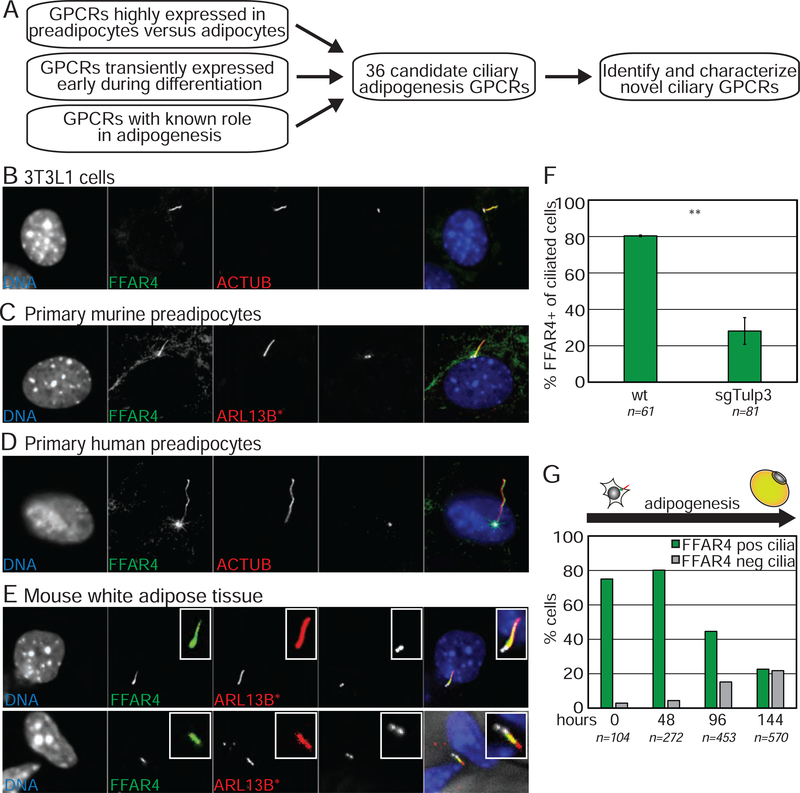
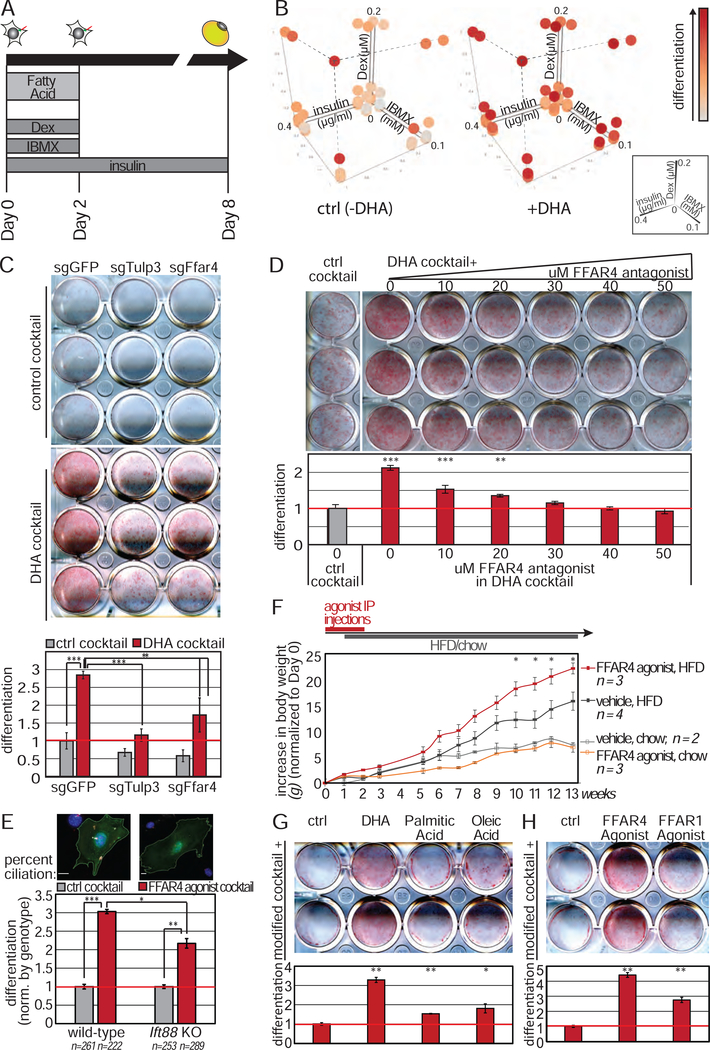
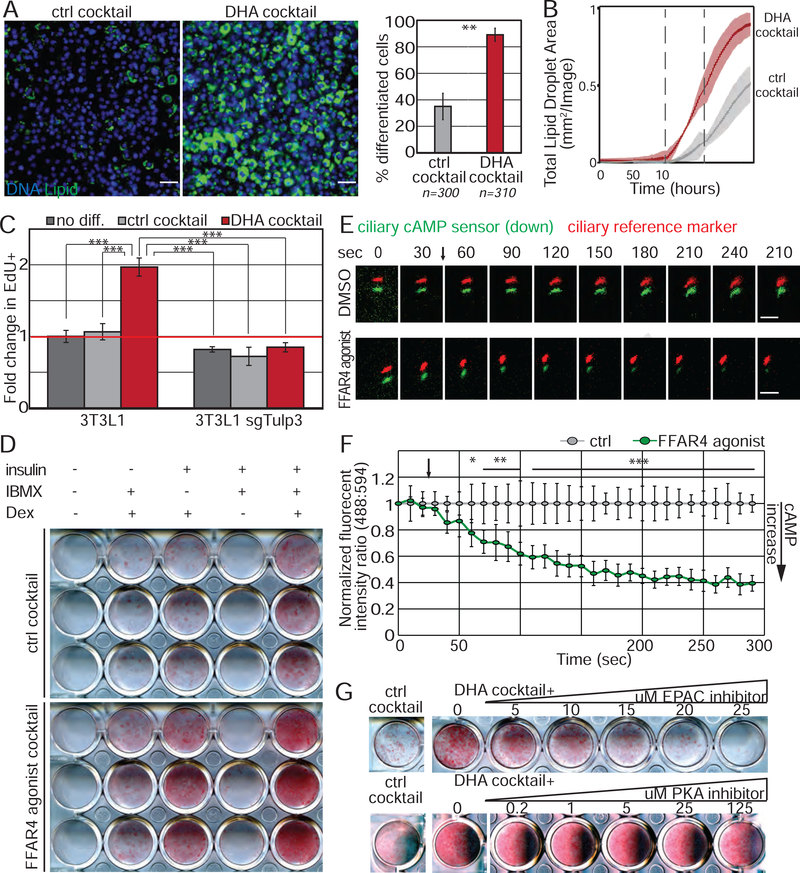
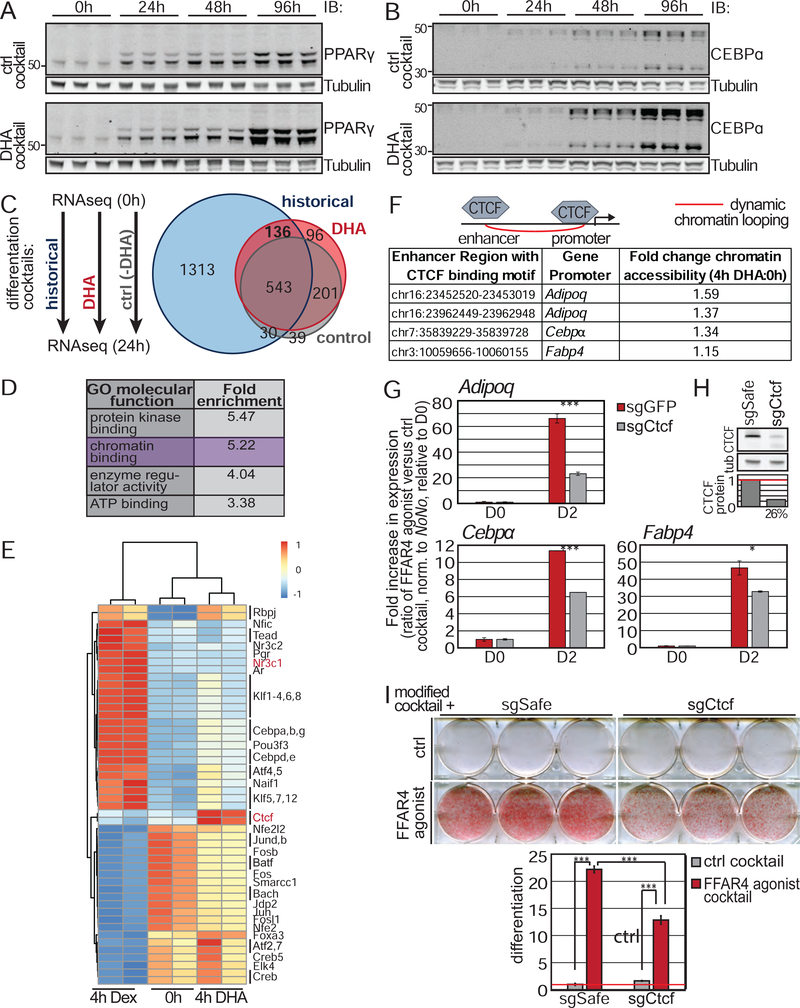
Adult mesenchymal stem cells, including preadipocytes, possess a cellular sensory organelle called the primary cilium. Ciliated preadipocytes abundantly populate perivascular compartments in fat and are activated by a high-fat diet. Here, we sought to understand whether preadipocytes use their cilia to sense and respond to external cues to remodel white adipose tissue. Abolishing preadipocyte cilia in mice severely impairs white adipose tissue expansion. We discover that TULP3-dependent ciliary localization of the omega-3 fatty acid receptor FFAR4/GPR120 promotes adipogenesis. FFAR4 agonists and ω-3 fatty acids, but not saturated fatty acids, trigger mitosis and adipogenesis by rapidly activating cAMP production inside cilia. Ciliary cAMP activates EPAC signaling, CTCF-dependent chromatin remodeling, and transcriptional activation of PPARγ and CEBPα to initiate adipogenesis. We propose that dietary ω-3 fatty acids selectively drive expansion of adipocyte numbers to produce new fat cells and store saturated fatty acids, enabling homeostasis of healthy fat tissue.

Keywords: FFAR4; GPR120; adipogenesis; ciliary signaling; diabetes; mesenchymal stem cells; obesity; omega-3 fatty acid; preadipocyte; primary cilia.


Figures

Figure 1.
Figure 1.. Preadipocytes are ciliated in vitro and in vivo, and an abundant perivascular cell in fat tissue.
(A-C) Immunofluorescence staining visualizes primary cilia on (A) confluent 3T3-L1 cells, (B) primary mouse preadipocytes (Lin, CD34+, SCA1+, CD29+), and (C) human preadipocytes. ACTUB stains axoneme, PCNT and CEP170 stain the basal body. (D) The primary cilium is lost in differentiating 3T3-L1 cells. n=number of cells counted. (E-G) Whole mount imaging of epididymal WAT from cilia glow mouse identifies ciliated perivascular cells. All cells have a CENTRIN2-GFP+ centrosome, ciliated cells are CENTRIN2-GFP+ and ARL13BmCherry+ (inset). (E) Lipid droplets are visualized by phase and (F) blood vessels are CD31+. (G) 3D surface reconstruction of blood vessel and adjacent ciliated perivascular cells. (H) Quantification of ciliation on perivascular cells in subcutaneous (dark grey) and visceral (light grey) mouse WAT of cilia glow mice. Bar graphs show average from 2 littermates ± SD. (I) HFD promotes transient deciliation in epididymal WAT of cilia glow mice after 3 days. Bar graph shows average of 4 independent experiments ± SEM, each using 1–2 littermates per diet. n=number of perivascular cells counted; p-value calculated using chi-squared test is p<0.005. (J, K) 2 weeks of HFD activates ciliated perivascular cells to re-enter the cell cycle. (J) Whole mount image and (K) quantification of BrdU+ ciliated perivascular cells in epididymal WAT. Data are percent BrdU+ of ciliated perivascular cells (n=3 mice on HFD; n=2 mice on chow) ± SEM. n=number of perivascular ciliated cells counted. Arrowheads point to perivascular ciliated cells. p-values calculated using t-test unless noted otherwise, ** p<0.01; See also Figure S1.
Figure 2.
Figure 2.. Preadipocyte cilia promote WAT expansion.
(A) Body weight measurements of control (Ift88flox/− and Pdgfrα-CreERT Ift88Δ/+) and PAno cilia mice (Pdgfrα-CreERT Ift88Δ/-) (n=5 per sex and genotype). (B) Dissected gonadal fat pads and measurements of total fat and lean mass by Echo-MRI of control and PAno cilia mice 17 weeks after tamoxifen administration. Scale bar is 1cm. (C) Serum leptin levels of control and PAno cilia mice 17 weeks after tamoxifen administration. (D) Immunofluorescence staining for lineage marker (EYFP, green) and adipocytes (LipidTox, red) of 20-week-old controllineage (Pdgfrα-CreERT Ift88Δ/+ Rosa26EYFP) and PAno cilia+lineage (Pdgfrα-CreERT Ift88Δ/- Rosa26EYFP) mice after tamoxifen administration at 3 weeks of age. PAno cilia+lineage mice contain fewer lineage-derived EYFP+ adipocytes compared to controllineage mice. Scale bar is 100 μm. All data are represented as mean ± SEM. p-values calculated using standard t-test and two-way ANOVA followed by Tukey’s multiple comparison test (**<0.01, ***<0.001 and ****<0.0001). See also Figure S2.
Figure 3.
Figure 3.. TULP3 knockouts support a requirement for ciliary GPCRs during adipogenesis.
(A) Immunoblot showing depletion of TULP3 protein in 3T3-L1 cells. (B) TULP3 is required for 3T3-L1 differentiation induced by reduced amounts of DM. Lipids are visualized by Oil Red O staining (top) and quantified by measuring absorbance post-isopropanol extraction of Oil Red O (bottom). (C) Loss of adipogenic potential due to TULP3 depletion is rescued by human GFP-tagged TULP3. (D) TULP3 expression levels correlate with adipogenic potential as determined by live imaging and quantification of green fluorescence intensity using BODIPY. Dotted line denotes media change. Shaded area describes 95% confidence interval. Bar graphs are normalized mean ± SD; * p<0.05; ** p<0.01; *** p<0.001. See also Figure S3.
Figure 4.
Figure 4.. FFAR4 is a ciliary GPCR displayed by preadipocytes.
(A) Schematic of screen to identify ciliary GPCR in 3T3-L1 cells. (B-D) Endogenous FFAR4 localizes to the primary cilium of undifferentiated, confluent (B) 3T3-L1 cells, (C) primary mouse preadipocytes in the stromal vascular fraction (SVF, depleted for RBCs and WBCs) from cilia glow mice, and (D) primary human preadipocytes. (E) Whole mount images of epididymal WAT from cilia glow mice shows that ciliated perivascular cells display ciliary FFAR4. (F) Loss of TULP3 prevents ciliary trafficking of FFAR4 in 3T3-L1 preadipocytes. (G) Induction of differentiation results in internalization of ciliary FFAR4. n=number of cells counted, bar graph is average ± SD; ** p<0.01. See also Figure S4.
Figure 5.
Figure 5.. FFAR4 activation promotes adipogenesis.
(A) Schematic of 3T3-L1 differentiation experiment in the presence of free fatty acids. (B) 3D mesh plot of differentiation using different amounts of insulin, Dex, and IBMX in the presence or absence of 100μM DHA during the first 2 days of differentiation. Data plotted is normalized absorbance post-isopropanol extraction of Oil Red O (images in Figure S4A). (C-D) DHA cocktail enhances differentiation of 3T3-L1 cells, and this is attenuated by (C) loss of TULP3 or FFAR4 protein or (D) addition of FFAR4 antagonist (AH7614) in a dose-dependent manner. (E) FFAR4 activation promotes adipogenesis of primary mouse preadipocytes (Lin, CD34+, SCA1+, CD29+) from wild-type, but not Ift88flox/flox post-transduction with Cre recombinase and GFP. n = number of GFP+ cells counted. Scale bar 10μm. (F) Daily FFAR4 agonist intraperitoneal injection followed by HFD increases diet-induced obesity. All data are mean ± SEM. p-values calculated using standard t-test comparing FFAR4 agonist, HFD versus vehicle, HFD. (G) Supplementing DHA, but not palmitic acid or oleic acid, enhances adipogenesis. (H) Addition of FFAR4, but not FFAR1, agonist enhances adipogenesis. Bar graphs are normalized mean ± SD. * p<0.05; ** p<0.01; *** p<0.001. See also Figure S5.
Figure 6.
Figure 6.. FFAR4 regulates initiation of adipogenesis via cAMP.
(A, B) DHA cocktail initiates adipogenesis in 3T3-L1 cells (A) after 6 days of differentiation, and (B) as assessed by the increase in lipid droplets (BODIPY) over time. Data is average of 3 wells ± SD, shaded area is 95% confidence interval. Dotted line denotes media change. n=number of cells counted. Scale bar is 50μm. (C) DHA cocktail results in cell cycle re-entry and this requires TULP3 protein. Bar graphs show normalized average from 3 experiments ± SD; (D) 3T3-L1 cells were exposed to individual components of the modified cocktail ± FFAR4 agonist for 48h. FFAR4 activation partially replaces IBMX. (E, F) FFAR4 activation elevates ciliary cAMP levels. 3T3-L1 cells were transduced with a ciliary cAMP sensor (green) and reference marker (red). Addition of FFAR4 agonist (denoted by arrow) results in decreased ciliary green fluorescence intensity, indicating that ciliary cAMP levels increase. (E) Representative images showing cAMP sensor (green) and cilia (red) offset. Scale bar 5μm. (F) Background subtracted ratio of fluorescence intensities are normalized to DMSO control and 0 second time point. n=6 for FFAR4 agonist and n=4 for DMSO control ± SD, where n is the average of all cilia measured per well; (G) 3T3-L1 cells were differentiated with DHA cocktail in the presence of an inhibitor against EPAC (ESI-09) or PKA (Rp-cAMPS) for the first 2 days. Lipid accumulation was assessed on Day 4. Inhibition of EPAC, but not PKA, attenuates DHA enhanced adipogenesis in a dose-dependent manner. * p<0.05; ** p<0.01; *** p<0.001. See also Figure S6.
Figure 7.
Figure 7.. FFAR4 activates PPARγ and CEBPα via CTCF-dependent chromatin remodeling.
(A-B) Addition of DHA cocktail to 3T3-L1 cells increased (A) PPARγ and (B) CEBPα protein levels. 3 independent samples shown per time points. (C-D) Schematic of next generation RNA sequencing experiment. 3T3-L1 cells were treated for 24h with ctrl cocktail, DHA cocktail, or historical DM. (C) Venn-diagram of all significantly altered genes (q<0.05) with greater than 2 fold up- or downregulation compared to 0h. Data describes 3 independent experiments. (D) Gene ontology enrichment analysis of all genes significantly upregulated more than 2 fold in response to both DHA cocktail and historical DM. (E) Chromatin accessibility as assessed by ATAC-seq shows enrichment of CTCF binding motifs in open chromatin after 4h of DHA only treatment. (F) Known enhancer-adipogenic gene promoter loops that contain a CTCF binding motif and are opened by DHA. Fold change describes average increase in accessibility from 2 independent experiments. (G) Loss of CTCF attenuates expression of adipogenic genes in response to FFAR4 activation. Bar graph is average of three independent experiments ± SD. (H) Immunoblot showing depletion of CTCF protein in 3T3-L1 cells. (I) CTCF is required for 3T3L1 adipogenesis induced by FFAR4 agonist cocktail. Bar graphs are normalized mean ± SD. * p<0.05; *** p<0.001. See also Figure S7.

References

    1. Anders S, Pyl PT, and Huber W. (2015). HTSeq--a Python framework to work with high-throughput sequencing data. Bioinformatics 31, 166–169. - PMC - PubMed
    1. Arner P, Andersson DP, Thorne A, Wiren M, Hoffstedt J, Naslund E, Thorell A, and Ryden M. (2013). Variations in the size of the major omentum are primarily determined by fat cell number. J Clin Endocrinol Metab 98, E897–901. - PubMed
    1. Ashburner M, Ball CA, Blake JA, Botstein D, Butler H, Cherry JM, Davis AP, Dolinski K, Dwight SS, Eppig JT, et al. (2000). Gene ontology: tool for the unification of biology. The Gene Ontology Consortium. Nat Genet 25, 25–29. - PMC - PubMed
    1. Bangs FK, Schrode N, Hadjantonakis AK, and Anderson KV (2015). Lineage specificity of primary cilia in the mouse embryo. Nat Cell Biol 17, 113–122. - PMC - PubMed
    1. Berry R, and Rodeheffer MS (2013). Characterization of the adipocyte cellular lineage in vivo. Nat Cell Biol 15, 302–308. - PMC - PubMed

Publication types

MeSH terms