. 2020 Feb 4;31(2):391-405.e8.
doi: 10.1016/j.cmet.2019.10.015. Epub 2019 Nov 21.

Pharmacological Activation of Pyruvate Kinase M2 Inhibits CD4+ T Cell Pathogenicity and Suppresses Autoimmunity

Affiliations

Pharmacological Activation of Pyruvate Kinase M2 Inhibits CD4+ T Cell Pathogenicity and Suppresses Autoimmunity

Stefano Angiari et al. Cell Metab. .

Abstract

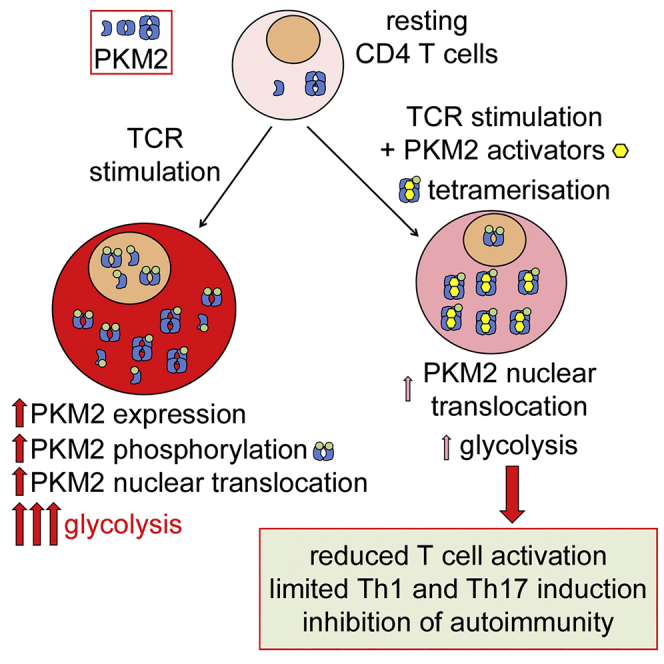
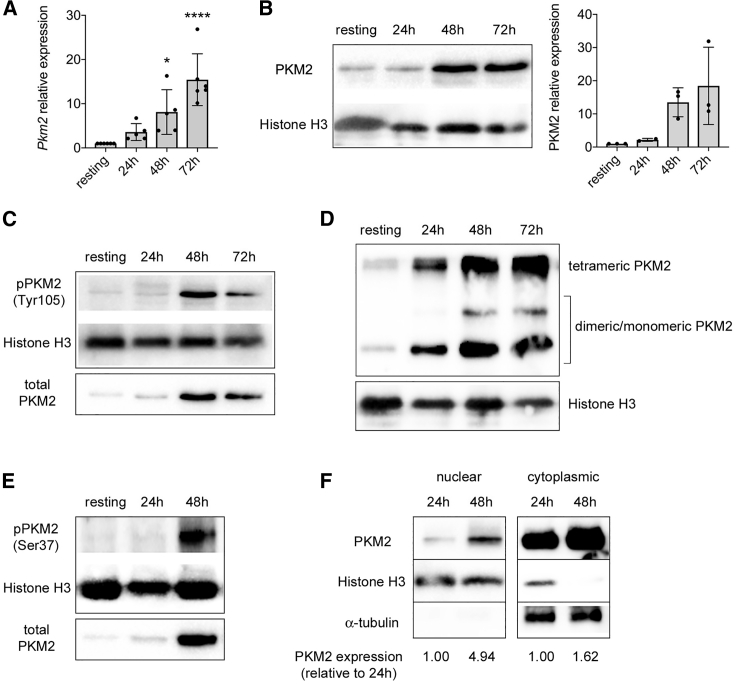
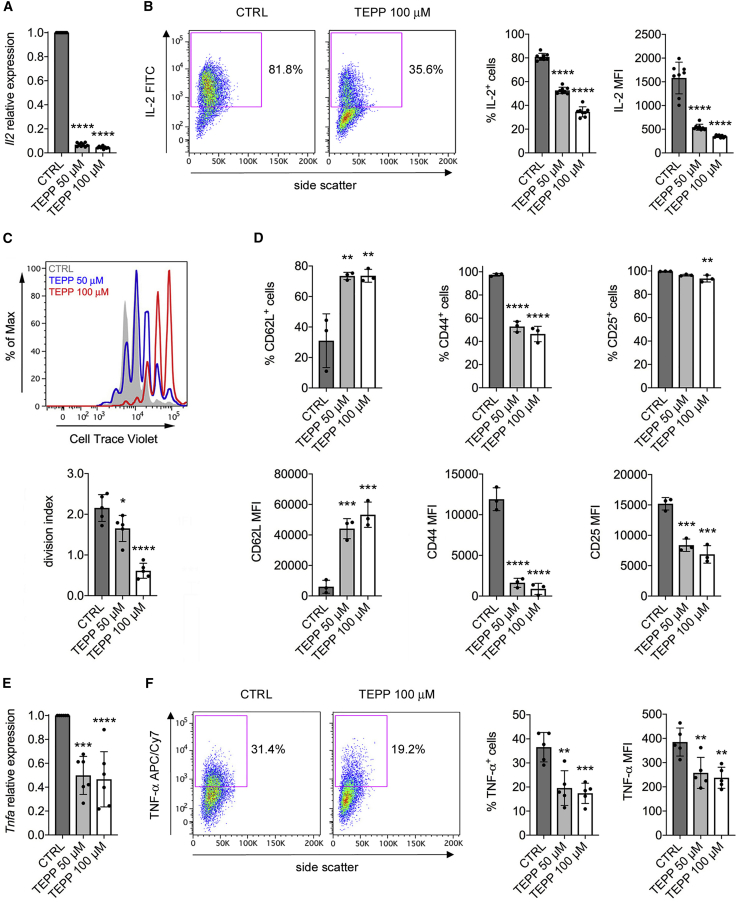
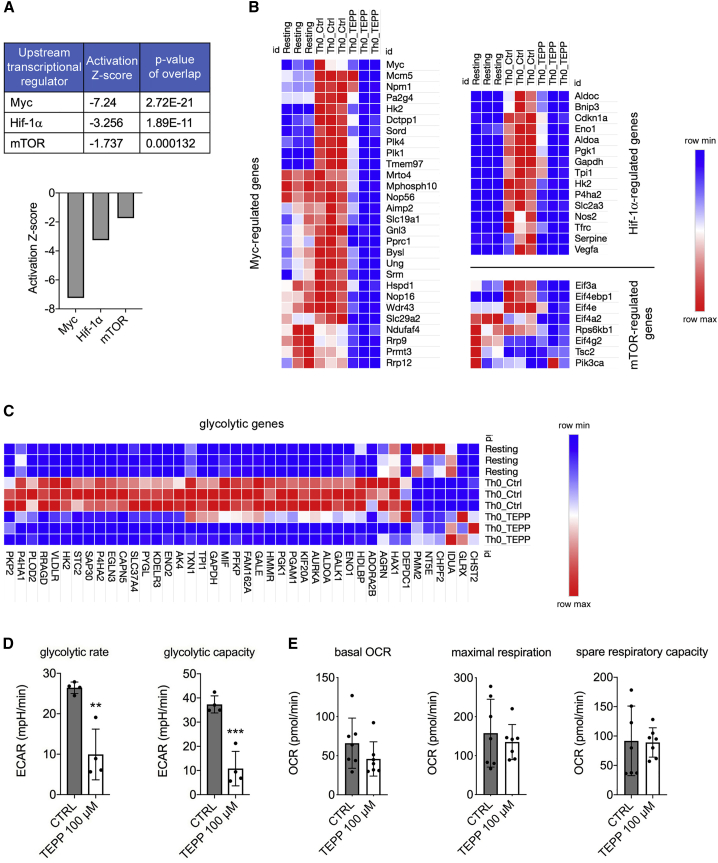
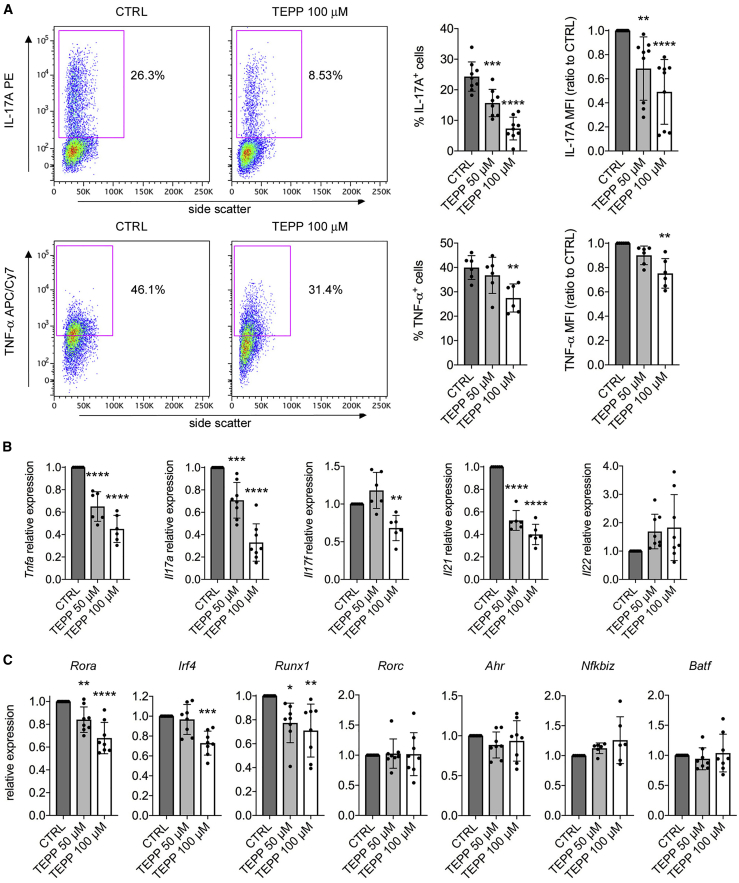
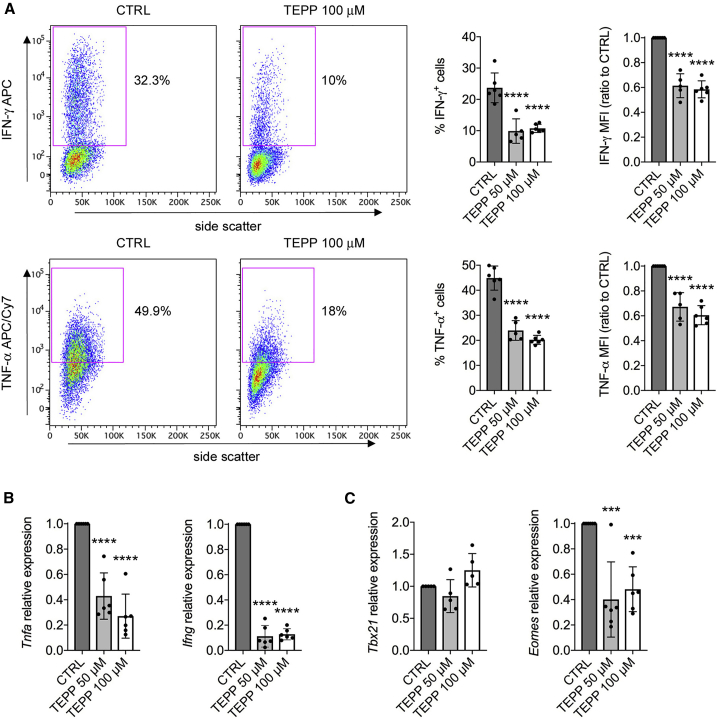
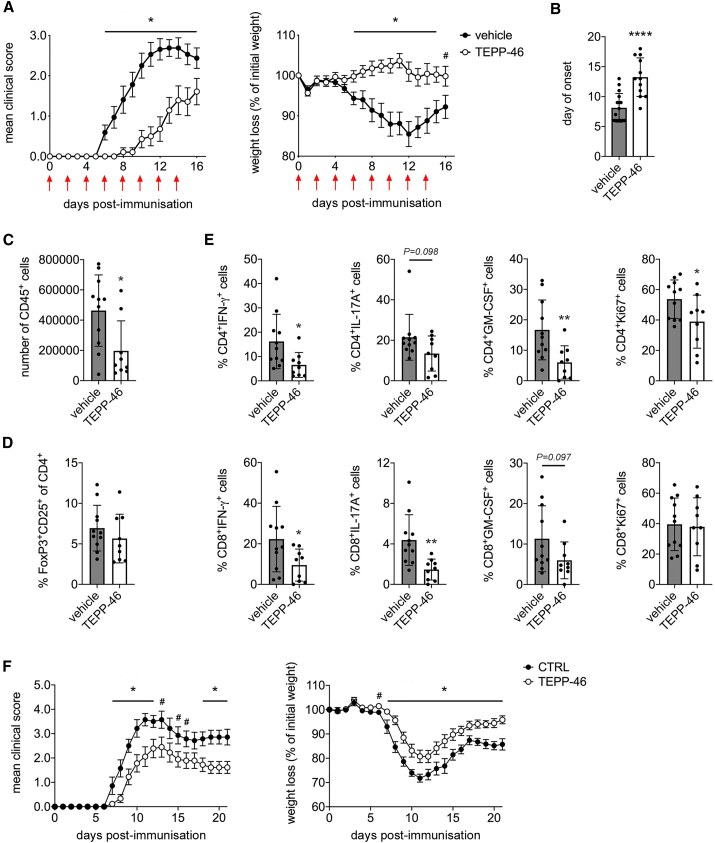
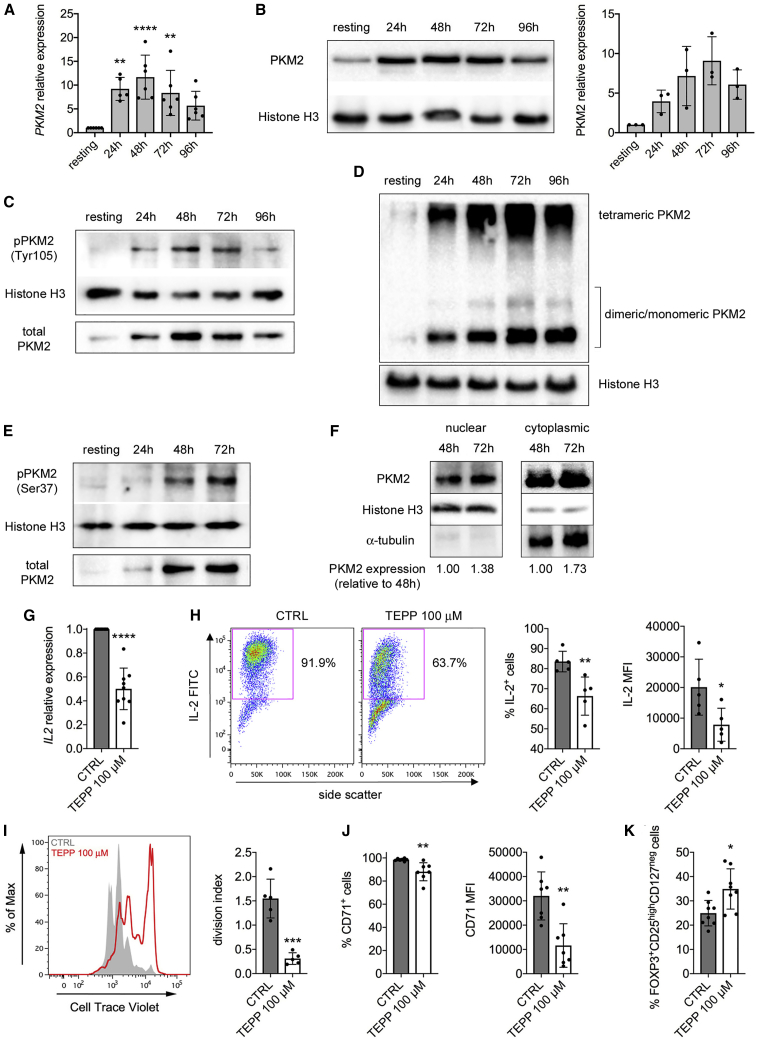
Pyruvate kinase (PK) catalyzes the conversion of phosphoenolpyruvate to pyruvate during glycolysis. The PK isoform PKM2 has additional roles in regulation of gene transcription and protein phosphorylation. PKM2 has been shown to control macrophage metabolic remodeling in inflammation, but its role in T cell biology is poorly understood. Here, we report PKM2 upregulation, phosphorylation, and nuclear accumulation in murine and human CD4+ T cells following activation in vitro. Treatment of T cells with TEPP-46, an allosteric activator that induces PKM2 tetramerization and blocks its nuclear translocation, strongly reduces their activation, proliferation, and cytokine production by inhibiting essential signaling pathways and thus preventing the engagement of glycolysis. TEPP-46 limits the development of both T helper 17 (Th17) and Th1 cells in vitro and ameliorates experimental autoimmune encephalomyelitis (EAE) in vivo. Overall, our results suggest that pharmacological targeting of PKM2 may represent a valuable therapeutic approach in T cell-mediated inflammation and autoimmunity.

Keywords: PKM2; Th1; Th17; autoimmunity; immunometabolism; inflammation.


Conflict of interest statement

Declaration of Interests L.A.J.O. is a Founder of Sitryx. E.L.P. is a Scientific Advisory Board member of ImmunoMet and a Founder of Rheos Medicines.

Figures

None
Graphical abstract
Figure 1
Figure 1
CD3/CD28 Activation Induces PKM2 Expression and Nuclear Accumulation in Murine CD4+CD62L+ T Cells Murine CD4+CD62+ T cells were stimulated in vitro for 3 days with CD3/CD28 antibodies and collected at different time points of activation. (A) Quantification of Pkm2 mRNA in resting versus activated murine CD4+CD62L+ T cells by qRT-PCR (n = 5–6 from 4 independent experiments). p < 0.05 and ∗∗∗∗p < 0.0001 compared to resting condition, by one-way ANOVA with Dunnett's post-hoc test. (B) Left, western blot showing upregulation of PKM2 protein in CD4+CD62L+ T cells following activation. Right, quantification of PKM2 expression by densitometry analysis (n = 2–3 mice from 2 independent experiments). For (A and B), data are the mean ± standard deviation (SD). (C) Western blots showing time-dependent increase in PKM2 phosphorylation on tyrosine 105 (Tyr105) in activated murine CD4+ T cells. One representative experiment out of two is shown. (D) Cells were collected at different time points of activation, crosslinked with DSS, and analyzed for PKM2 expression. A representative western blot displaying upregulation of monomeric/dimeric and tetrameric PKM2 in activated T cells is shown. (E) Western blots showing time-dependent increase in PKM2 phosphorylation on serine 37 (Ser37) in activated murine CD4+ T cells. (F) Cells were collected at different time points of activation. Nuclear and cytoplasmic fractions were isolated by cell fractionation and analyzed for PKM2 expression by western blot. A representative blot showing accumulation of PKM2 in the nucleus and its upregulation in the cytoplasm of activated murine CD4+CD62L+ T cells is presented. For (D), (E), and (F), one representative experiment out of two-three is shown.
Figure 2
Figure 2
PKM2 Tetramerization Blocks T Cell Activation In Vitro Murine CD4+CD62+ T cells were stimulated in vitro with CD3/CD28 antibodies in the presence of DMSO (CTRL), TEPP-46 50 μM, or 100 μM. (A and B) Cells were collected after 24 h of stimulation. (A) Quantification of Il2 mRNA in activated T cells by qRT-PCR (n = 9 from three independent experiments). (B) Cells were re-stimulated in vitro with PMA and ionomycin in the presence of brefeldin A. IL-2 production was then evaluated by flow cytometry after intracellular cytokine staining. Left, representative plot showing reduced IL-2 production by TEPP-46-treated cells. Right, quantification of the percentage of IL-2-producing cells and IL-2 mean fluorescence intensity (MFI) in CTRL versus TEPP-46-treated cells (n = 8 from 3 independent experiments). (C–F) Cells were collected after 3 days of stimulation. (C) Top, representative flow cytometry plot displaying T cell proliferation assessed as CellTrace violet dilution. Bottom, a division index was calculated with FlowJo software to quantify T cell proliferation (n = 5 from four independent experiments). (D) Expression of surface CD62L, CD44, and CD25 was evaluated by flow cytometry. The percentage of expressing cells and the MFI are shown (n = 3 from 2 independent experiments). (E) Quantification of Tnfa mRNA levels in activated T cells by qRT-PCR (n = 6 from 6 independent experiments). (F) Cells were re-stimulated in vitro with PMA and ionomycin in the presence of brefeldin A. TNF-α production was then evaluated by flow cytometry after intracellular cytokine staining. Left, representative plot showing reduced TNF-α production by TEPP-46 treated cells. Right, quantification of the percentage of TNF-α-producing cells and TNF-α MFI in CTRL versus TEPP-46-treated cells (n = 5 from 2 independent experiments). For all panels, data are the mean ± SD. p < 0.05, ∗∗p < 0.01, ∗∗∗p < 0.001, or ∗∗∗∗p < 0.0001 compared to CTRL condition, by one-way ANOVA with Dunnett's post-hoc test.
Figure 3
Figure 3
PKM2 Tetramerization Limits HIF1-α, Myc, and mTORC1 Signaling and Engagement of Glycolysis in CD4+ T Cells Murine CD4+ T cells were collected after 72 h of in vitro activation with CD3/CD28 antibodies in the presence of DMSO (CTRL condition) or TEPP-46 100 μM. (A) Results of unbiased Ingenuity Pathway Analysis predicting downregulation of Myc-, Hif-1-α-, and mTOR-regulated pathways by TEPP-46. (B) Heatmaps showing expression of Myc-, Hif-1-α-, and mTOR-regulated genes in resting T cells and T cells activated in the presence of DMSO (Th0 Ctrl) or TEPP-46 (Th0 TEPP). (C) Heatmap showing expression of glycolytic genes in resting, Th0 Ctrl, and Th0 TEPP-46 cells. (D and E) Cells were tested for their glycolytic capacity and oxygen consumption rate (OCR) on a Seahorse XFe96 Analyzer. (D) Quantitative analysis of glycolytic rate and glycolytic capacity of CTRL and TEPP-46-treated cells (n = 4 from 2 independent experiments). (E) Quantitative analysis of basal OCR, maximum respiration and spare respiratory capacity of CTRL and TEPP-46-treated cells (n = 7 from three independent experiments). For (D) and (E), data are the mean ± SD. ∗∗p < 0.01 or ∗∗∗p < 0.001, compared to CTRL condition, by two-tailed unpaired Student’s t test.
Figure 4
Figure 4
TEPP-46 Limits Th17 Cell Polarization Murine CD4+CD62+ T cells were activated in vitro for 3 days with CD3/CD28 antibodies under Th17-polarizing conditions in the presence of DMSO (CTRL condition), TEPP-46 50 μM, or 100 μM. (A) Flow cytometry evaluation of IL-17A and TNF-α production by Th17 cells after intracellular cytokine staining. Left, representative plots showing reduced IL-17A and TNF-α production by TEPP-46 treated cells. Right, quantification of the percentage of IL-17A/TNF-α-producing cells and of IL-17A/TNF-α MFI in CTRL versus TEPP-46-treated cells (n = 6–9 from 3 independent experiments). (B and C) Quantification of the mRNA levels of Th17 signature cytokines (B) and transcription factors (C) by qRT-PCR (n = 6–8 from 3–4 independent experiments). For all panels, data are the mean ± SD. p < 0.05, ∗∗p < 0.01, ∗∗∗p < 0.001, or ∗∗∗∗p < 0.0001 compared to CTRL condition, by one-way ANOVA with Dunnett's post-hoc test.
Figure 5
Figure 5
TEPP-46 Constrains Th1 Cell Development Murine CD4+CD62+ T cells were activated in vitro for 3 days with CD3/CD28 antibodies under Th1-polarizing conditions in the presence of DMSO (CTRL condition) or TEPP-46 50 μM or 100 μM. (A) Flow cytometry evaluation of IFN-γ and TNF-α production by Th1 cells after intracellular cytokine staining. Left, representative plots showing reduced IFN-γ and TNF-α production by TEPP-46 treated cells. Right, quantification of the percentage of IFN-γ/TNF-α-producing cells and of IFN-γ/TNF-α MFI in CTRL versus TEPP-46-treated cells (n = 5–6 from 4 independent experiments). (B and C) Quantification of Tnfa/Ifng (B) and Tbx21/Eomes (C) mRNA levels by qPCR (n = 5–6 from 3 independent experiments). For all panels, data are the mean ± SD. ∗∗∗p < 0.001 or ∗∗∗∗p < 0.0001 compared to CTRL condition, by one-way ANOVA with Dunnett's post-hoc test.
Figure 6
Figure 6
TEPP-46 Inhibits EAE Development (A and B) C56Bl/6 mice were immunized with MOG35–55 peptide emulsified in complete Freund adjuvant. Mice were treated every other day from day 0 to day +14 post-immunization (red arrows) with vehicle (PBS + 40% cyclodextrin) or TEPP-46 50 mg/kg in vehicle. (A) Mean clinical score (left) and percentage of weight loss (right) in EAE mice treated with vehicle or TEPP-46. (B) Mean day of onset in vehicle and TEPP-46-treated EAE mice. N = 14–16 mice per group (A) or 12–16 mice/group (B) from 3 independent experiments. (C–E) Vehicle- and TEPP-46-treated EAE mice were sacrificed 11 days post-immunization. CNS infiltrates were isolated, stained, and analyzed by flow cytometry as described in the STAR Methods section. (C) Total number of CD45+ cells in the CNS of vehicle- and TEPP-46-treated EAE mice. (D) Percentage of Foxp3+CD25+ cells in the CD4+ T cells population isolated from the CNS of EAE mice. (E) Percentages of IL-17A-, IFN-γ-, and GM-CSF-producing and Ki67+ cells in the CNS CD4+ and CD8+ T populations of vehicle and TEPP-46-treated mice. For (C–E), n = 9–11 from 2 independent experiments. (F) Transfer EAE was induced in C57BL/6 mice by injection of MOG35–55-primed CD3+ T cells re-stimulated in vitro as described in STAR Methods section. N = 7–9 mice/group from 2 independent experiments. For panels (A) and (F), data are the mean ± standard error of the mean (SEM). For panels (B–E), data are the mean ± SD. p values were calculated by two-tailed unpaired Student’s t test. #p < 0.01, p < 0.05, and ∗∗∗∗p < 0.0001, compared to vehicle condition (A–E) or CTRL cell condition (F).
Figure 7
Figure 7
TCR Stimulation Induces PKM2 Upregulation and Nuclear Translocation in Human T Cells, and TEPP-46 Limits Their Activation Human naive CD4+ T cells were stimulated in vitro for 4 days with CD3/CD28 antibodies and collected at different time points of activation. (A) Quantification of PKM2 mRNA in resting versus activated human CD4+ T cells by qRT-PCR (n = 5–6 from three independent experiments). (B) Left, western blot showing upregulation of PKM2 protein in human CD4+ cells following activation. Right, quantification of PKM2 expression by densitometry analysis (n = 3 from 2 independent experiments). (C) Western blots showing time-dependent increase in PKM2 phosphorylation on Tyr105 in activated human T cells. One representative experiment out of two is shown. (D) Cells were collected at different time points of activation, crosslinked with DSS, and analyzed for PKM2 expression by western blot. A representative blot showing the upregulation of monomeric/dimeric and tetrameric PKM2 in activated human CD4+ T cells is presented. (E) Western blots showing time-dependent increase in PKM2 phosphorylation on Ser37 in activated human CD4+ T cells. (F) Cells were collected at different time points of activation. Nuclear and cytoplasmic fractions were isolated by cell fractionation and analyzed for PKM2 expression by western blot. A representative blot showing accumulation of PKM2 in the nucleus of activated human CD4+ T cells is presented. For (D–F), one representative experiment out of three is shown. (G–K) Human naïve CD4+ T cells were stimulated in vitro for 48 h (G and H) or 4 days (I–K) with CD3/CD28 antibodies, in the presence of DMSO (CTRL condition) or TEPP-46 100 μM. (G) Quantification of IL2 mRNA in activated human cells by qRT-PCR (n = 9 from five independent experiments). (H) IL-2 production evaluated by flow cytometry after intracellular cytokine staining. Left, representative plot showing reduced IL-2 production by TEPP-46 treated cells. Right, quantification of the percentage of IL-2-producing cells and IL-2 MFI in CTRL versus TEPP-46-treated cells (n = 5 from 3 independent experiments). (I) Human CD4+ T cells proliferation evaluated as in Figure 2C (n = 5 from 2 independent experiments). (J) Percentage of CD71+ cells (left) and CD71 MFI (right) in CTRL and TEPP-46-treated activated human T cells (n = 7 from three independent experiments). (K) Percentage of FOXP3+CD25highCD127neg cells in CTRL and TEPP-46-treated activated CD4+ human T cells (n = 8 from 3 independent experiments). For all panels, data are the mean ± SD. p < 0.05, ∗∗p < 0.01, ∗∗∗p < 0.001, or ∗∗∗∗p<0.0001, compared to CTRL condition. p values were calculated by one-way ANOVA with Dunnett's post-hoc test (A) or by two-tailed paired (G) or unpaired (H–K) Student’s t test.

References

    1. Anastasiou D., Yu Y., Israelsen W.J., Jiang J.K., Boxer M.B., Hong B.S., Tempel W., Dimov S., Shen M., Jha A. Pyruvate kinase M2 activators promote tetramer formation and suppress tumorigenesis. Nat. Chem. Biol. 2012;8:839–847. - PMC - PubMed
    1. Bettencourt I.A., Powell J.D. Targeting metabolism as a novel therapeutic approach to autoimmunity, inflammation, and transplantation. J. Immunol. 2017;198:999–1005. - PMC - PubMed
    1. Bhardwaj V., Heyne S., Sikora K., Rabbani L., Rauer M., Kilpert F., Richter A.S., Ryan D., Manke T. snakePipes: facilitating flexible, scalable and integrative epigenomic analysis. Bioinformatics. 2019;35:4757–4759. - PMC - PubMed
    1. Bian L., Josefsson E., Jonsson I.M., Verdrengh M., Ohlsson C., Bokarewa M., Tarkowski A., Magnusson M. Dichloroacetate alleviates development of collagen II-induced arthritis in female DBA/1 mice. Arthritis Res. Ther. 2009;11:R132. - PMC - PubMed
    1. Cao Y., Rathmell J.C., Macintyre A.N. Metabolic reprogramming towards aerobic glycolysis correlates with greater proliferative ability and resistance to metabolic inhibition in CD8 versus CD4 T cells. PLoS One. 2014;9:e104104. - PMC - PubMed

Publication types