. 2020 Jan 7;31(1):148-161.e5.
doi: 10.1016/j.cmet.2019.10.013. Epub 2019 Nov 21.

STAT3 Activation-Induced Fatty Acid Oxidation in CD8+ T Effector Cells Is Critical for Obesity-Promoted Breast Tumor Growth

Affiliations

STAT3 Activation-Induced Fatty Acid Oxidation in CD8+ T Effector Cells Is Critical for Obesity-Promoted Breast Tumor Growth

Chunyan Zhang et al. Cell Metab. .

Abstract

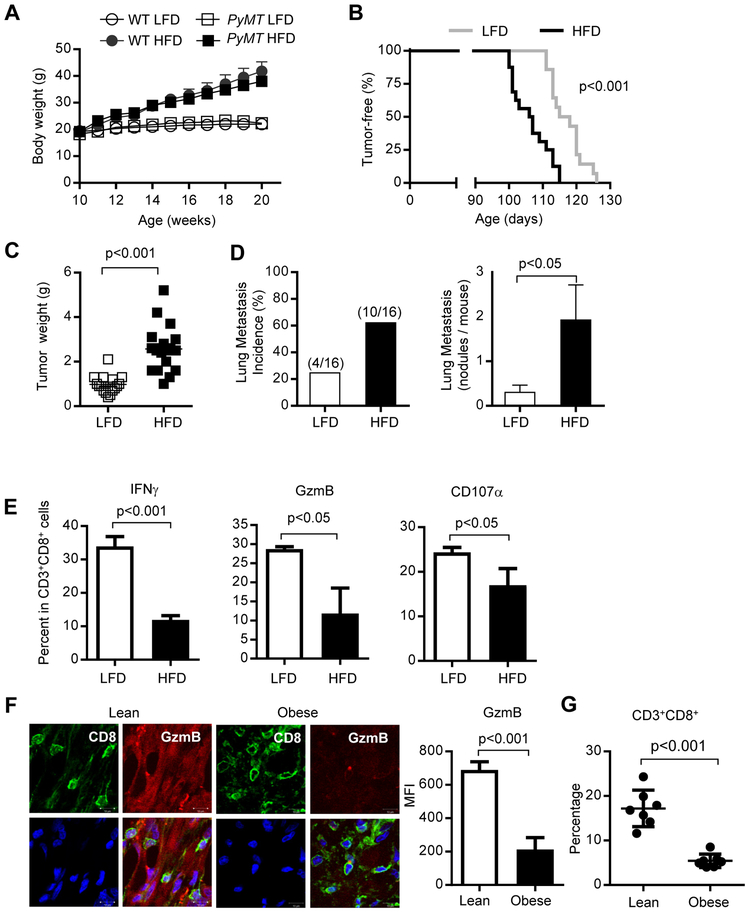
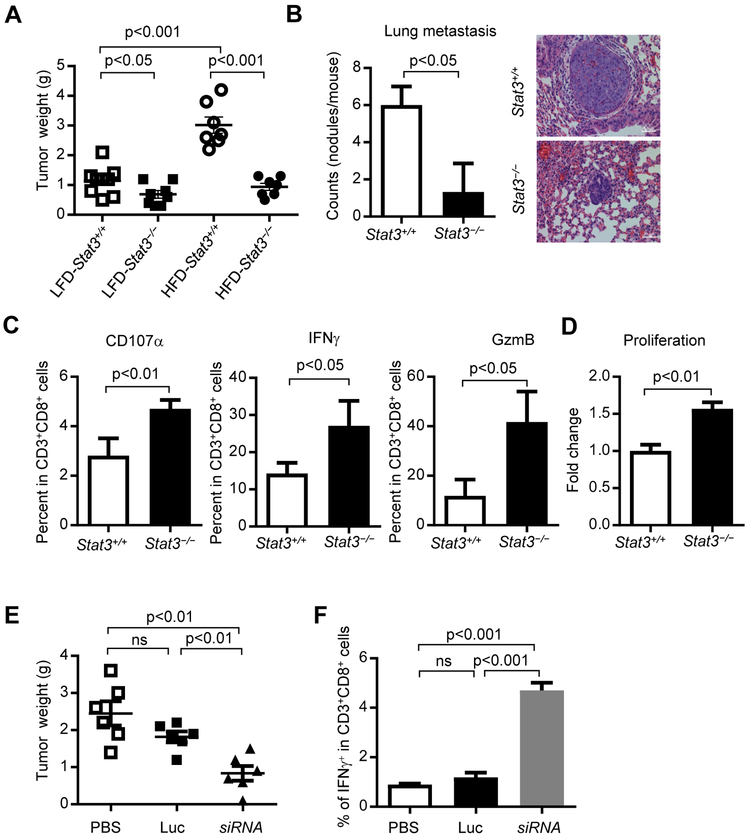
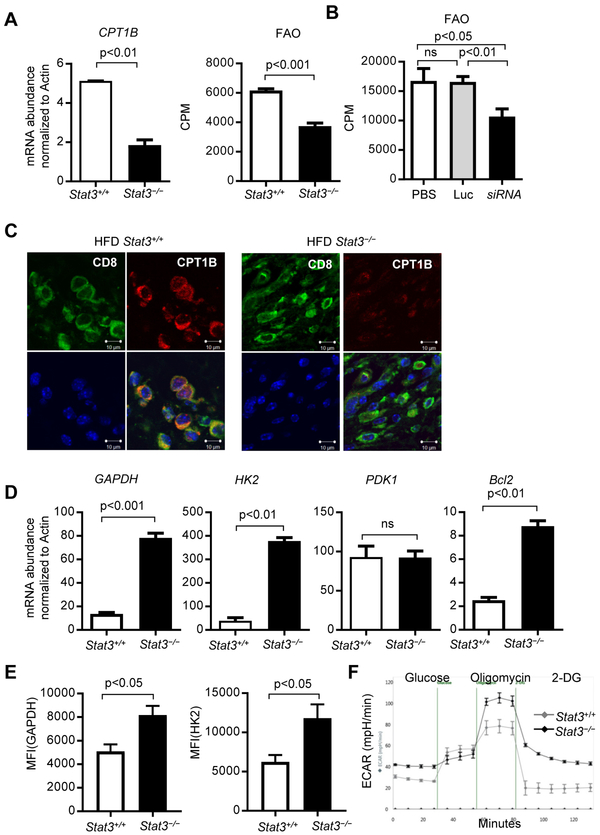
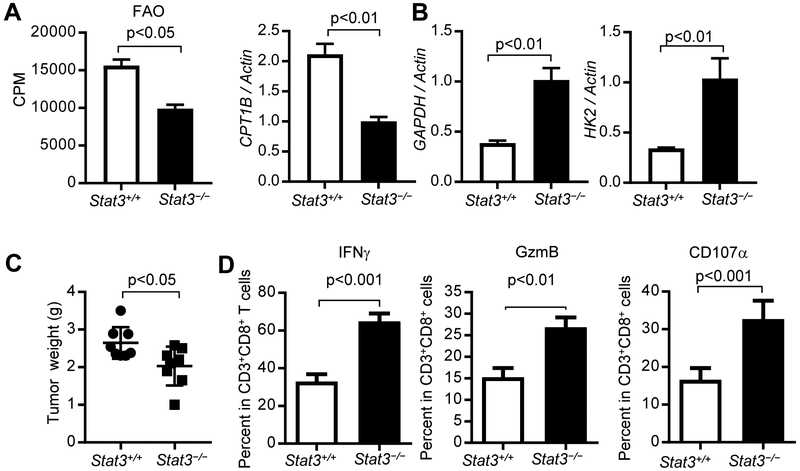
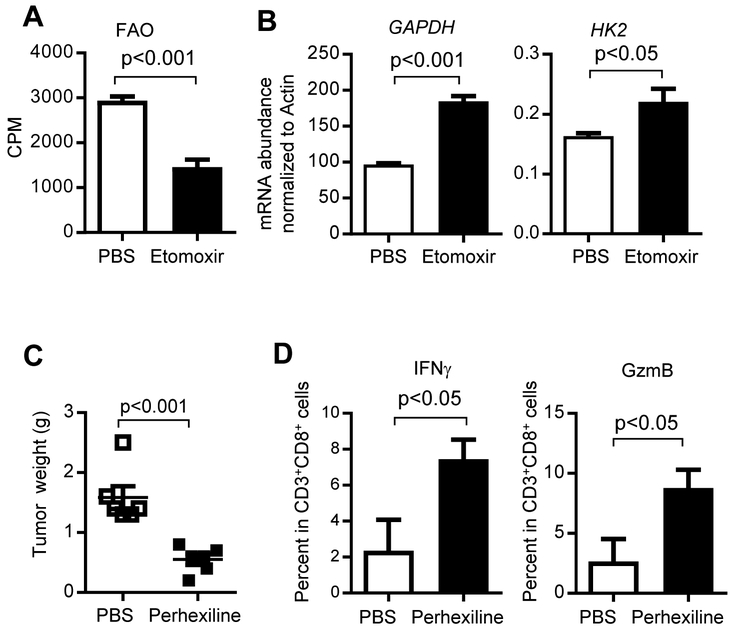
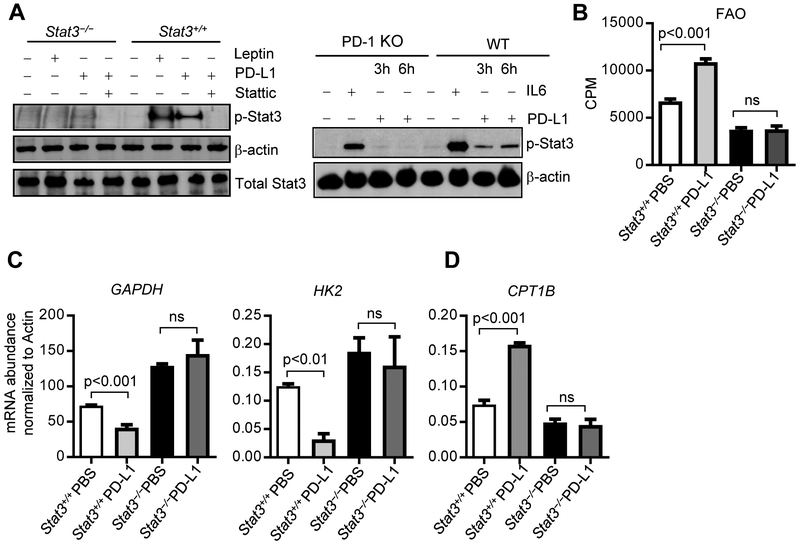
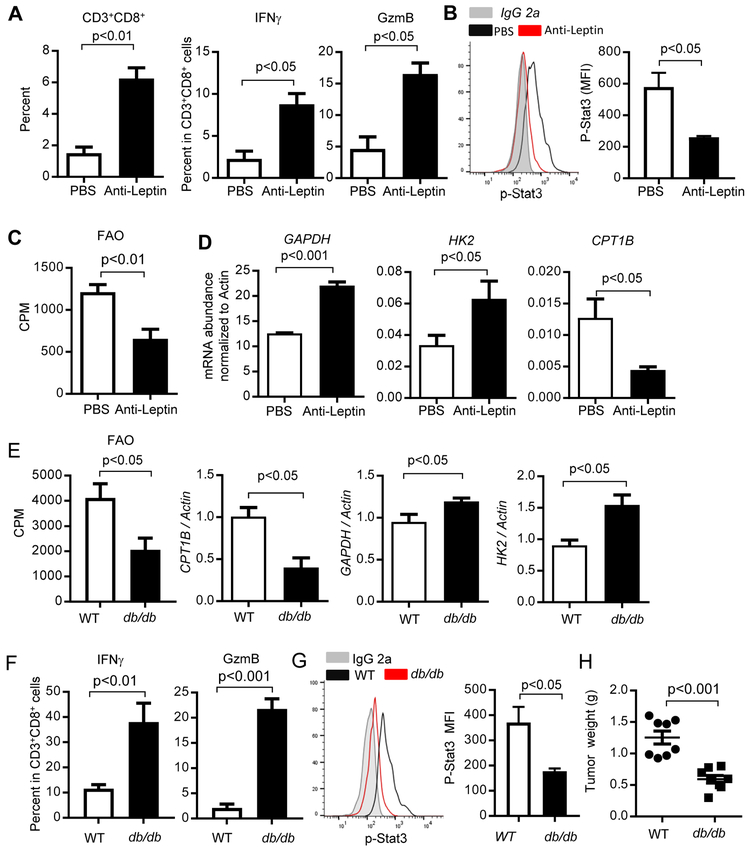
Although obesity is known to be critical for cancer development, how obesity negatively impacts antitumor immune responses remains largely unknown. Here, we show that increased fatty acid oxidation (FAO) driven by activated STAT3 in CD8+ T effector cells is critical for obesity-associated breast tumor progression. Ablating T cell Stat3 or treatment with an FAO inhibitor in obese mice spontaneously developing breast tumor reduces FAO, increases glycolysis and CD8+ T effector cell functions, leading to inhibition of breast tumor development. Moreover, PD-1 ligation in CD8+ T cells activates STAT3 to increase FAO, inhibiting CD8+ T effector cell glycolysis and functions. Finally, leptin enriched in mammary adipocytes and fat tissues downregulates CD8+ T cell effector functions through activating STAT3-FAO and inhibiting glycolysis. We identify a critical role of increased oxidation of fatty acids driven by leptin and PD-1 through STAT3 in inhibiting CD8+ T effector cell glycolysis and in promoting obesity-associated breast tumorigenesis.

Keywords: CD8 T cells; FAO; IFNγ; PD-1; PyMT model; STAT3; leptin; obesity; tumor.


Conflict of interest statement

Declaration of Interests

There are no competing interests.

Figures

Figure 1.
Figure 1.. Obesity-promoted breast cancer is associated with inhibition of tumor infiltrating CD8+ TEFF cells
Wild type (WT) or PyMT mice were fed on HFD or LFD from 8-10 weeks of age. (A) Body weights (n = 4), and (B) tumor onsets were monitored at indicated times (n = 14-16). Mammary tumors were collected for measurement of (C) tumor weights (n = 16-20); and (D) lung metastasis (n = 16) as well as (E) analysis by flow cytometry for TEFF (IFNγ+ or GzmB+ or CD107a+) in CD3+CD8+ T cells (n = 3; n is for number of samples, each of which was pooled from 2-3 mice) . (F) Representative immunofluorescence images of tumor sections from lean (BMI<25) or obese (BMI>32.5) breast cancer patients; CD8 (green), GzmB (red), Hoechst (blue), scale bar =10 μm. Data shown are average positive counts from five random views (CD8+ areas) per section from 4 patient tumors (n = 4). (G) Flow cytometry analysis of CD3+CD8+ T cells from TDLNs of lean (BMI<25) and obese (BMI>32.5) breast cancer patients (n = 7). All data are shown with mean ± SEM. See also Figure S1 and Figure S2.
Figure 2.
Figure 2.. Ablating Stat3 in T cells enhanced tumor infiltrating TEFF accumulation, proliferation and inhibited tumor development
PyMT/Stat3+/+ and PyMT/Stat3−/− mice were fed on a HFD or LFD and tumors were collected. (A) Tumor weights were measured (n = 7- 9), and (B) Counts of lung metastasis and H&E staining, scale bar =50 μm, n = 3; (C) Single-cell suspensions prepared from the tumors were analyzed by flow cytometry for activated TEFF (IFNγ+ or GzmB+ or CD107a+) in CD3+CD8+ T cells, n = 3. n is for number of samples, each of which was pooled from 2-3 mice)(D) Proliferation analysis of PyMT tumor-primed splenic CD3+CD8+ T cells cultured in vitro with 10% tumor supernatant (TSN) for 24 h. (E-F) PyMT mice were fed on a HFD from 8-10 weeks of age followed by treating with PBS (vehicle), Luc (CTLA4 (apt)-Luciferase siRNA) or siRNA (CTLA4 (apt)-Stat3 siRNA) from day 120, once every two days for three weeks, n = 6. Tumors were then harvested for weight measurement (E) and for generating single-cell suspensions for flow cytometry analysis of TEFF cells (F), n = 3. All data are shown with mean ± SEM. See also Figure S3.
Figure 3.
Figure 3.. STAT3 promotes tumor TEFF cell FAO while inhibiting glycolysis
(A) Tumors were harvested from HFD-fed PyMT/Stat3+/+ and PyMT/ Stat3−/− PyMT mice (n = 6), and intra-tumor CD3+CD8+ T cells were sorted for measurement of FAO and CPT1B mRNA expression (n= 2-3, n is for number of samples, each of which was pooled from 2-3 mice). (B) PyMT mice (n = 6) treated with indicated controls or CTLA4 (apt)-Stat3 siRNA (as in Figure 2), and intra-tumor CD3+CD8+ T cells were sorted for FAO measurement (n = 3). (C) Representative immunofluorescence images of CD8 (green), CPT1B (red) and Hoechst (blue) on tumor sections from Stat3+/+ or Stat3−/− PyMT mice, scale bar = 10 μm. (D) CD3+CD8+ T cells sorted same as in (A) were analyzed for expression of the indicated genes by qPCR (n = 2-3). (E) Flow cytometric analysis of GAPDH and HK2 in tumor infiltrated CD8+ T cell from Stat3+/+ or Stat3−/− mice (n = 4-6). Splenic CD3+CD8+ T cells were cultured in vitro with 10% TSN, followed by measurement of extracellular acidification rate (ECAR). All data are shown with mean ± SEM. See also Figure S4 and Figure S5
Figure 4.
Figure 4.. Ablating STAT3 in CD8+ T cell enhanced CD8+ T cell anti-tumor effect by reducing FAO while promoting glycolysis.
(A-B) Purified CD8+T cells from mice with or without functional Stat3 were adoptively transferred into Rag1−/− obese mice, followed by tumor establishment with Py8119 tumor cells. Sorted tumor-infiltrating CD8+ T cells from tumor-bearing mice were analyzed for FAO and CPT1B (A) and GAPDH, HK2 gene expression (B) (n = 3, n is for number of samples, each of which was pooled from 2-3 mice). (C) Tumors were collected and tumor weight was measured (n = 8). (D) Single-cell suspensions prepared from the tumors were analyzed by flow cytometry for activated TEFF (IFNγ+ or GzmB+ or CD107a+) in CD3+CD8+ T cells (n = 7-8) . All data are shown with mean ± SEM. See also Figure S4 and Figure S5.
Figure 5.
Figure 5.. Inhibition of FAO restores tumor TEFF cell functions, leading to restriction of tumor growth
(A-B) PyMT tumor-primed splenic CD3+CD8+ T cells were cultured in vitro with anti-CD3ε (1 μg/ml), anti-CD28 antibody (1 μg/ml) and IL-2 (20 ng/ml), and 10% TSN for 5 days followed by addition of PBS or etomoxir. FAO levels and GAPDH mRNA expression are shown. Representative data from four independent experiments are shown (n = 3). (C-D) PyMT mice were fed on a HFD from 8-10 weeks of age followed by treating with PBS (vehicle), or perhexiline (5mg/kg) from day 120, once every two days for three weeks. Tumors were then collected for weight measurement (C) (n = 6), and single-cell suspensions for flow cytometry analysis of TEFF cells (D) (n = 3). All data are shown with mean ± SEM. See also Figure S6 and Figure S7.
Figure 6.
Figure 6.. PD-1-mediated TEFF cell FAO promotion and glycolysis inhibition requires STAT3
(A) CD8+ T cells harvested from spleens of the indicated mice were treated with leptin (200 ng/ml) or IL-6 (20ng/ml) for 30 min, PD-L1 (500 ng/ml) for 3 h and 6h, or pretreated with Stattic (10 μM) for 30 min followed by PD-L1 for 3 has indicated. Cell lysates were analyzed by Western blotting for indicated proteins. (B-D) PyMT tumor-primed splenic CD3+CD8+ T cells were cultured in vitro with anti-CD3ε (1 μg/ml), anti-CD28 antibody (1 μg/ml) and IL-2 (20 ng/ml), and 10% TSN for 5 days followed by addition of PBS or PD-L1 (100 ng/ml) for 8 days, and measurement of FAO (B), GAPDH and HK2 mRNA expression (C) and CPT1B mRNA expression (D). All data shown are representative of four independent experiments, mean ± SEM.
Figure 7.
Figure 7.. Leptin contributes to STAT3-upregulated FAO and tumor TEFF cell function inhibition
(A-D) PyMT mice were fed on a HFD from 8-10 weeks of age followed by treating with PBS (vehicle), or anti-leptin antibody (250 μg/kg) from day 120 once every two days for three weeks. Tumors were then harvested to prepare single-cell suspension for flow cytometry analysis to measure activated TEFF cells (A) (n = 3); p-STAT3 (Y705) level (B) (n = 4); as well as FAO (C) (n = 3). GAPDH, HK2 and CPT1B mRNA expression levels were determined by qPCR (D) (n = 2-3). All data are shown with mean ± SEM. (E-H) Purified CD8+T cells from C57BL/6 wild type or db/db (leptin-receptor deficient) mice were adoptively transferred into Rag1−/− obese mice, followed by establishing tumors using Py8119 tumor cells (n = 8). Sorted tumor-infiltrating CD8+ T cells from tumor-bearing mice were analyzed for FAO rate and expression of the CPT1B, GAPDH and HK2 genes (E) (n = 3). Tumors were collected to prepare single-cell suspension for flow cytometry analysis of p-STAT3+, IFNγ and GzmB-producing CD8+ T cells (F) (n = 3). Levels of p-Stat3 in tumor infiltrating CD8+ T cells were shown by flow cytometry. Quantification of mean fluorescence intensity (MFI) is shown (n = 6) (G). Tumors were collected and tumor weights were measured (H) (n = 8). All data are shown with mean ± SEM.

References

    1. Ando S, Barone I, Giordano C, Bonofiglio D, and Catalano S (2014). The Multifaceted Mechanism of Leptin Signaling within Tumor Microenvironment in Driving Breast Cancer Growth and Progression. Front Oncol 4, 340. - PMC - PubMed
    1. Assiri AM, Kamel HF, and Hassanien MF (2015). Resistin, visfatin, adiponectin, and leptin: risk of breast cancer in pre- and postmenopausal saudi females and their possible diagnostic and predictive implications as novel biomarkers. Dis Markers 2015, 253519. - PMC - PubMed
    1. Battle M, Gillespie C, Quarshie A, Lanier V, Harmon T, Wilson K, Torroella-Kouri M, and Gonzalez-Perez RR (2014). Obesity induced a leptin-Notch signaling axis in breast cancer. Int J Cancer 134, 1605–1616. - PMC - PubMed
    1. Boldajipour B, Nelson A, and Krummel MF (2016). Tumor-infiltrating lymphocytes are dynamically desensitized to antigen but are maintained by homeostatic cytokine. JCI Insight 1, e89289. - PMC - PubMed
    1. Calle EE, Rodriguez C, Walker-Thurmond K, and Thun MJ (2003). Overweight, obesity, and mortality from cancer in a prospectively studied cohort of U.S. adults. N Engl J Med 348, 1625–1638. - PubMed

Publication types

MeSH terms