. 2020 Jan 7;31(1):189-206.e8.
doi: 10.1016/j.cmet.2019.10.014. Epub 2019 Nov 21.

Neutralization of Oxidized Phospholipids Ameliorates Non-alcoholic Steatohepatitis

Affiliations

Neutralization of Oxidized Phospholipids Ameliorates Non-alcoholic Steatohepatitis

Xiaoli Sun et al. Cell Metab. .

Abstract

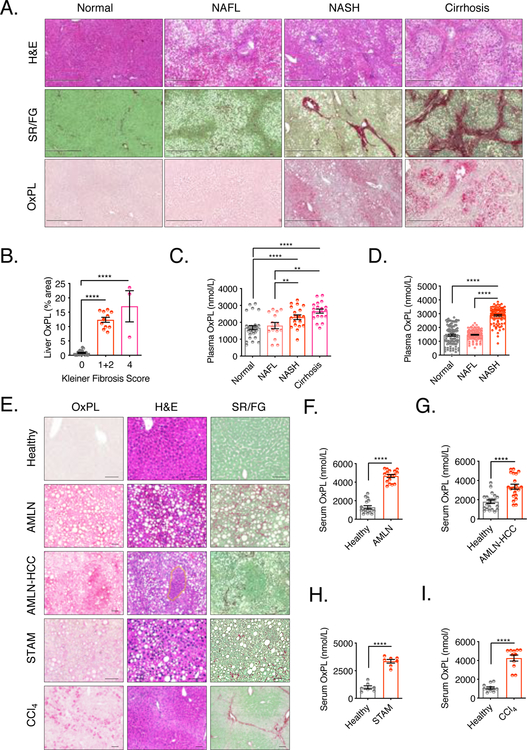
Oxidized phospholipids (OxPLs), which arise due to oxidative stress, are proinflammatory and proatherogenic, but their roles in non-alcoholic steatohepatitis (NASH) are unknown. Here, we show that OxPLs accumulate in human and mouse NASH. Using a transgenic mouse that expresses a functional single-chain variable fragment of E06, a natural antibody that neutralizes OxPLs, we demonstrate the causal role of OxPLs in NASH. Targeting OxPLs in hyperlipidemic Ldlr-/- mice improved multiple aspects of NASH, including steatosis, inflammation, fibrosis, hepatocyte death, and progression to hepatocellular carcinoma. Mechanistically, we found that OxPLs promote ROS accumulation to induce mitochondrial dysfunction in hepatocytes. Neutralizing OxPLs in AMLN-diet-fed Ldlr-/- mice reduced oxidative stress, improved hepatic and adipose-tissue mitochondrial function, and fatty-acid oxidation. These results suggest targeting OxPLs may be an effective therapeutic strategy for NASH.

Keywords: MnSOD; atherosclerosis; fibrosis; inflammation; mitochondria; natural antibody; nonalcoholic steatohepatitis; oxidative stress; oxidized phospholipids; steatosis.


Conflict of interest statement

DECLARATION OF INTEREST

J.L.W, S.T., X.Q. and X.S. are named inventors on patent applications or patents related to the use of oxidation-specific antibodies held by UCSD. J.L.W, S.T. and X.Q. are founding members of Oxitope, Inc, and J.L.W. and S.T. of Kleanthi Diagnostics. J.L.W. is a consultant for Ionis Pharmaceuticals and S.T. is employed by UCSD and by Ionis Pharmaceuticals. The other authors declare that they have no competing interests.

Figures

Figure 1.
Figure 1.. OxPLs accumulate in liver and serum of human and mouse models of NASH.
(A) Human liver sections were classified blindly by a liver pathologist and determined levels of OxPL accumulation, histology and collagen fiber deposition respectively in different stages of liver disease. Normal (no steatosis, Kleiner fibrosis score 0), NAFL (steatosis, Kleiner fibrosis score 0), NASH (steatosis, Kleiner fibrosis score 1–2), cirrhosis (steatosis, Kleiner fibrosis score 4 and plural pseudo-lobules). n = 3–11. Scale bar = 500μm. (B) Quantification of liver OxPL staining in (A), plotted against Kleiner fibrosis scores. (C) Plasma OxPL levels were determined in 82 subjects previously characterized for extent of liver disease by liver biopsy. n = 15–29. (D) Plasma OxPL levels were determined in 322 outpatient subjects diagnosed as Normal (no steatosis by ultrasound with normal liver ALT and AST levels), NAFL (steatosis by ultrasound with normal liver ALT and AST levels) or NASH (steatosis and both elevated ALT and AST). n = 100–118. (E) Healthy mouse model: 20 weeks old Ldlr−/− mice on chow diet; AMLN Model: Ldlr−/− mice were fed AMLN diet for 30 weeks; AMLN-HCC Model: Ldlr−/− mice were fed AMLN diet for 48 weeks; STAM Model: male Ldlr−/− mice were subcutaneously injected with 200μg streptozotocin (STZ) or vehicle within 48 hours after birth and fed with HFD for 4 weeks stating at 4 weeks of age; CCl4 Model: Ldlr−/− mice were injected intraperitoneally with CCl4 (0.5ml/kg body weight, 1:5 diluted in corn oil) or vehicle (corn oil) twice a week for 4 weeks. Paraffin-embedded mouse liver sections were stained with biotinylated-E06 IgM, H&E and SR/FG to determine OxPL deposition, histology and collagen fiber deposition respectively. n = 6. Scale bar = 50μm. (F) OxPL in serum of healthy (littermate control on chow diet) and AMLN-NASH mice. n = 17. (G) Serum OxPL in healthy (littermate control on chow diet) and AMLN-HCC mice. n = 17–21. (H) Serum OxPL in healthy (littermate control injected with vehicle on chow diet) and STAM-NASH mice. n = 7–17. (I) Serum OxPL in healthy (littermate control injected with vehicle) and CCl4-liver fibrosis mice. n = 11–17. Data are mean ± SEM. **, P < 0.01; ****, P < 0.0001. See also Figure S1.
Figure 2.
Figure 2.. Neutralization of OxPL restrains AMLN diet-induced hepatic steatosis, inflammation and fibrosis, increases energy expenditure and attenuates AMLN diet-induced obesity.
(A) Levels of OxPLs; neutral lipid deposition, histology, macrophage accumulation, collagen fiber deposition and apoptosis of liver sections from Ldlr−/− and E06-scFvLdlr−/− mice fed AMLN diet for 30 weeks. n = 6. Scale bar = 100μm. (for TUNEL staining, scale bar = 20μm). (B) Liver weight of indicated mice fed AMLN diet for 30 weeks. n = 10. (C-E) Content of liver triglyceride (C, TG), total cholesterol (D, TC) and hydroxyproline (E) of indicated mice fed AMLN diet for 30 weeks. n = 5–8. (F-H) Serum Alanine Aminotransferase (F, ALT), Aspartate Aminotransferase (G, AST) and Alkaline Phosphatase (H, ALP) of indicated mice fed AMLN diet for 30 weeks. n = 8–9. (I) Representative gross liver morphology and big tumor (big T, >0.4cm) incidence in indicated mice after 48 weeks of AMLN diet. n = 14–16. Scale bar = 1cm. (J, K) Tumor numbers (J) and volumes (K) of same mice as in (I). (L) Body weights of indicated mice at baseline (8weeks old) and after 30 weeks of indicated diet feeding. n = 6–10 per group. (M) Photo of representative indicated mice after 30 weeks of AMLN diet and H&E staining of respective IWAT. Scale bar = 100μm. (N) Percentage of fat mass of mice as determined by DEXA imaging. n = 4–6. (O-Q) IWAT (Q), EWAT (R) or BAT (S) mass in indicated mice fed AMLN diet for 30 weeks. n = 6–10. (R, S) Oxygen consumption rate over time (R, VO2) and ANCOVA analyzed VO2 statistics (S, normalized to body weight) of respective mice of indicated groups fed AMLN diet for 30 weeks. n = 4–5. (T) ANCOVA analyzed energy expenditure (normalized to body weight) of mice in experiment shown in panel R and S. Data are mean ± SEM. *, P < 0.05; **, P < 0.01; ***, P < 0.001; ****, P < 0.0001. See also Figure S2.
Figure 3.
Figure 3.. Neutralization of OxPL promotes mitochondrial biogenesis at the transcriptional level.
(A) Comparison of RNA-seq for poly A transcripts in livers of Ldlr−/− (L) and E06-scFvLdlr−/− (EL) mice on AMLN diet for 30 weeks. Mean log2 (TPM + 1) values (y axis) are plotted versus log2 Fold Change (x axis) of the transcripts of livers between L and EL mice (TPM, transcripts per kilobase million). All transcripts with mean TPM greater than 4 are in grey. Transcripts upregulated in EL mice (EL > L, > 1.5-fold change, P-adj < 0.05) are in blue. Genes highlighted in red are the 72 upregulated genes most closely related to mitochondrial functions. (B) Functional annotations associated with genes expressed more highly in EL mice (> 1.5-fold change, P-adj < 0.05). (C) Relative expression values (Z-scaled log2 (TPM + 1)) for the 72 genes highlighted in red in (A) are illustrated, including 62 oxidative phosphorylation genes, 6 mitochondrial assembly machinery genes and 4 fatty acid transportation genes. See also Figure S3.
Figure 4.
Figure 4.. Neutralization of OxPL protects mitochondria.
(A-D) Primary hepatocytes from Ldlr−/− and E06-scFvLdlr−/− mice were pretreated with Vehicle or OxPAPC (100μg/mL) for 12 hours. Total ROS (A, tROS), mitochondrial membrane potential (B, Ψm preservation), mitochondrial ROS (C, mtROS) and fatty acid oxidation (D) were measured. n = 3–5. (E, F) Primary hepatocytes of Ldlr−/− mice were pretreated with Vehicle or 200μM of MnTBAP for 1 hour, then with OxPAPC (100μg/mL) for 4 hours. Mitochondrial membrane potential (E) and mitochondrial ROS (F) were measured. n = 4–5. (G) Primary hepatocytes of Ldlr−/− mice treated with Vehicle, OxPAPC (20μg/mL) or OxPAPC (1-hour pre-incubation with 50μg/mL E06 IgM) for 1 hour were stained with E06 (green), Mitotracker (red) and DAPI (blue). Scale bar = 20μm. n = 3. (H) Primary hepatocytes of Ldlr−/− mice were treated with Vehicle or OxPAPC (100μg/mL) for 1 hour. SOD activity in the cell lysate was measured. n = 3. (I) ELISA detection of E06 IgM binding to recombinant native MnSOD or POVPC modified MnSOD. n = 3. (J) MnSOD activity was measured in vitro for recombinant native MnSOD and POVPC modified MnSOD. n = 3. (K) Western blot with E06 of liver MnSOD immunoprecipitated from livers of chow or AMLN diet fed Ldlr−/− and E06-scFvLdlr−/− mice. (L) SOD activity measured in liver homogenates of chow or AMLN diet fed Ldlr−/− and E06-scFvLdlr−/− mice. n = 3–4. (M) Thiobarbituric acid reactive substances (TBARS) in the plasma of 30 weeks AMLN diet fed mice. n = 3. (N) Transmission electron micrographs of hepatic mitochondria of fresh liver tissue from indicated mice on AMLN diet. Asterisks indicate lipid droplets. Arrows indicates ballooned or rounded mitochondrial cristae. n = 3. Scale bar = 1μm. (Scale bar=0.3μm for zoomed images) (O) NAD/NADH ratio in the livers of AMLN diet fed mice. n = 3. (P) SIRT1 activity in the fresh liver tissue from indicated mice were measured. n = 4–5. (Q) Normalized distribution of PGC1α ChIP-seq tag density, at promoters and enhancers within 3kb of the transcription start site of E06 up-regulated mitochondrial genes (Fig. 3C) in Ldlr−/− (L) and E06-scFvLdlr−/− (EL) mice on AMLN diet. (R) UCSC genome browser images illustrating normalized tag counts for PGC1α at the indicated mitochondrial genes in same groups of mice described in (Q). The tick marks indicate peaks up-regulated (> 2-fold, P-adj < 0.05) in E06-scFvLdlr−/− mice determined by DESeq2 using duplicate experiments. (S) Mitotracker staining of livers from indicated mice. Circles indicate lipid droplets. Scale bar=20μm. (T) Fatty acid oxidation in the livers of indicated mice fed AMLN diet. n = 3. (U) Cold tolerance test in 30 weeks AMLN diet-fed mice. Shown is the body temperature of indicated mice at indicated times after initiation of cold exposure (4 °C). n=6. Data are mean ± SEM. * P < 0.05; ** P < 0.01; ***P < 0.001, ****P < 0.0001. See also Figure S4.
Figure 5.
Figure 5.. Neutralization of OxPL suppresses AMLN diet-induced liver and systemic inflammation.
(A) Flow cytometry of Ly6ChiCD45+F4/80CD11bhiLy6GCD146 Live and Ly6ClowCD45+ -F4/80CD11bhiLy6GCD146Live recruited macrophages in the liver of Ldlr−/− (L) and E06-scFvLdlr−/− (EL) mice were fed with AMLN diet for 30 weeks. n = 5. (B) Statistical analysis of (A). n = 5. (C-F) Comparison of indicated blood cytokines of indicated mice fed with AMLN diet for 30 weeks. n = 5–10. (G) Flow cytometry of Tim4+CD45+F4/80+CD11bint-CD146 Live and Tim4CD45+F4/80+CD11bintCD146 Live macrophages in the liver of indicated mice fed with AMLN diet for 30 weeks. n = 5. (H) Statistical analysis of (G). n = 5. (I) Comparison of RNA-seq in livers of indicated mice fed with AMLN diet for 30 weeks. Mean log2 (TPM+1) values (y axis) are plotted versus log2 Fold Change (x axis) of the transcripts of livers between L and EL mice. Transcripts exhibiting EL < L (> 1.5-fold changes, P-adj < 0.05) are red. Genes highlighted in green are the 23 genes most closely related to inflammation (EL < L, > 1.5-fold change, P-adj < 0.05). (J) Functional annotations associated with genes expressed lower in EL mice indicated in I (red dots). (K) Relative expression values (Z-scaled log2 (TPM+1)) for the 23 genes highlighted in green in (I) are illustrated, including 7 macrophage marker genes, 15 cytokine/cytokine receptor (R)/inflammatory mediators and 1 apoptosis genes. Data are mean ± SEM, * P < 0.05. See also Figure S5.
Figure 6.
Figure 6.. Targeting OxPL inhibits hepatic fibrosis.
(A) Comparison of RNA-seq in livers of indicated mice fed with AMLN diet for 30 weeks. Mean log2 (TPM+1) values (y axis) are plotted versus log2 Fold Change (x axis) of the transcripts of livers between L and EL mice. Transcripts exhibiting EL < L (> 1.5-fold change, P-adj < 0.05) are red. Genes highlighted in purple are the downregulated genes closely related to fibrogenesis. (B) Functional annotations associated with genes expressed lower in EL mice (> 1.5-fold changes, P-adj < 0.05). (C) Relative expression values (Z-scaled log2 (TPM + 1)) of the 28 genes highlighted in purple in (A) are illustrated, including 15 extracellular matrix/receptor (ECM/R) genes, 6 growth factor/receptor (R) genes and 7 ECM remodeling genes. (D) Ldlr−/− and E06-scFvLdlr−/− mice were injected with CCl4 (0.5ml/kg body weight, 1:5 diluted in corn oil) for 4 weeks. Paraffin-embedded mouse liver sections were stained with SR/FG to determine collagen fiber deposition and E06 IgM antibody to determine OxPL deposition. n = 6. Scale bar = 100μm. (E-H) Serum triglyceride (E), cholesterol (F) and ALT (G) levels, as well as body weight loss (H) of the same groups of mice described in (D) are shown. n = 8–11. (I) Proposed model for roles of OxPL in the pathophysiology of NASH. Data are mean ± SEM, *, P < 0.05; **, P < 0.01. See also Figure S6.

References

    1. Aharoni-Simon M, Hann-Obercyger M, Pen S, Madar Z, and Tirosh O (2011). Fatty liver is associated with impaired activity of PPARgamma-coactivator 1alpha (PGC1alpha) and mitochondrial biogenesis in mice. Lab Invest 91, 1018–1028. - PubMed
    1. Alisi A, Carpino G, Oliveira FL, Panera N, Nobili V, and Gaudio E (2017). The Role of Tissue Macrophage-Mediated Inflammation on NAFLD Pathogenesis and Its Clinical Implications. Mediators Inflamm 2017, 8162421. - PMC - PubMed
    1. Antunes C, and Bhimji SS (2018). Fatty Liver In StatPearls (Treasure Island (FL)).
    1. Ayala A, Munoz MF, and Arguelles S (2014). Lipid peroxidation: production, metabolism, and signaling mechanisms of malondialdehyde and 4-hydroxy-2-nonenal. Oxid Med Cell Longev 2014, 360438. - PMC - PubMed
    1. Baldan A, Gonen A, Choung C, Que X, Marquart TJ, Hernandez I, Bjorkhem I, Ford DA, Witztum JL, and Tarling EJ (2014). ABCG1 is required for pulmonary B-1 B cell and natural antibody homeostasis. J Immunol 193, 5637–5648. - PMC - PubMed

Publication types

MeSH terms