

Aberrant expression of embryonic mesendoderm factor MESP1 promotes tumorigenesis
- PMID: 31761621
- PMCID: PMC6921370
- DOI: 10.1016/j.ebiom.2019.11.012
Aberrant expression of embryonic mesendoderm factor MESP1 promotes tumorigenesis
Abstract
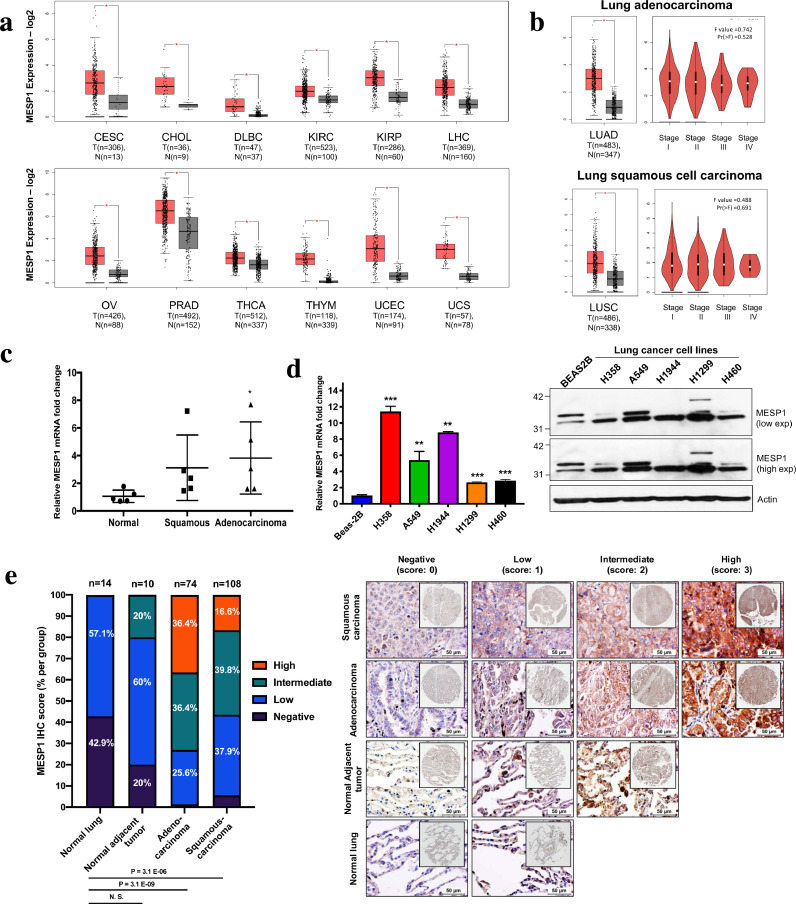
Background: Mesoderm Posterior 1 (MESP1) belongs to the family of basic helix-loop-helix transcription factors. It is a master regulator of mesendoderm development, leading to formation of organs such as heart and lung. However, its role in adult pathophysiology remains unknown. Here, we report for the first time a previously-unknown association of MESP1 with non-small cell lung cancer (NSCLC).
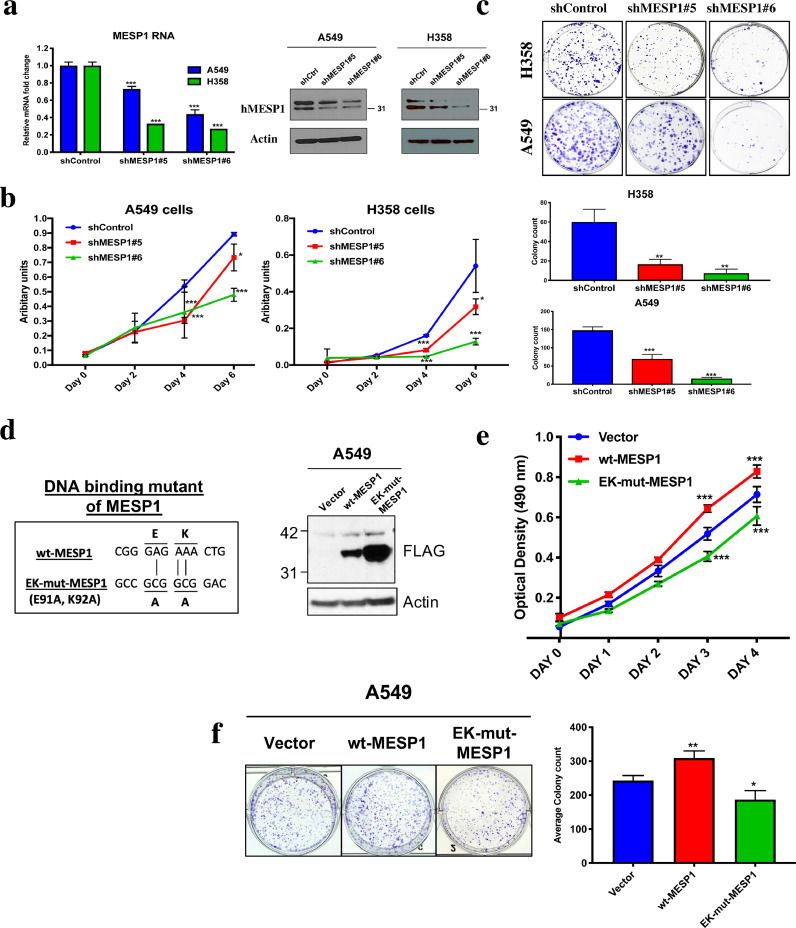
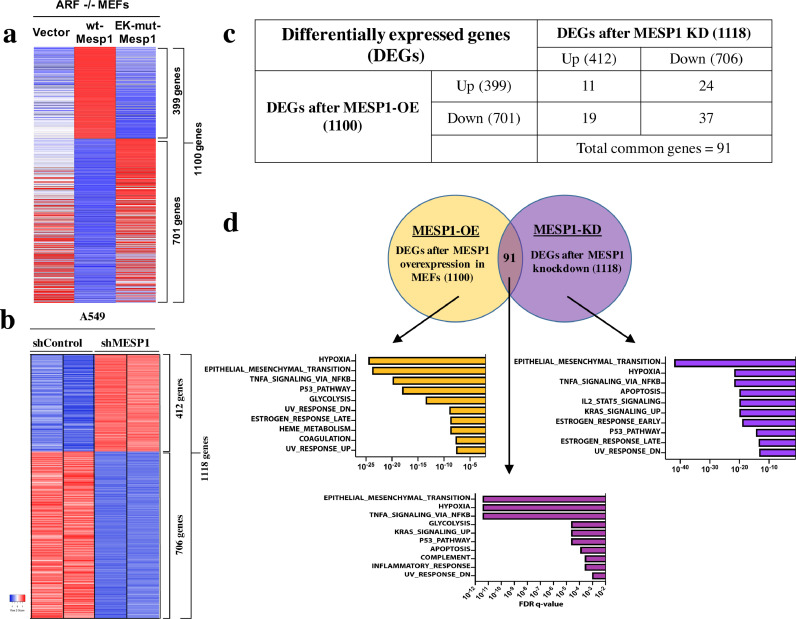
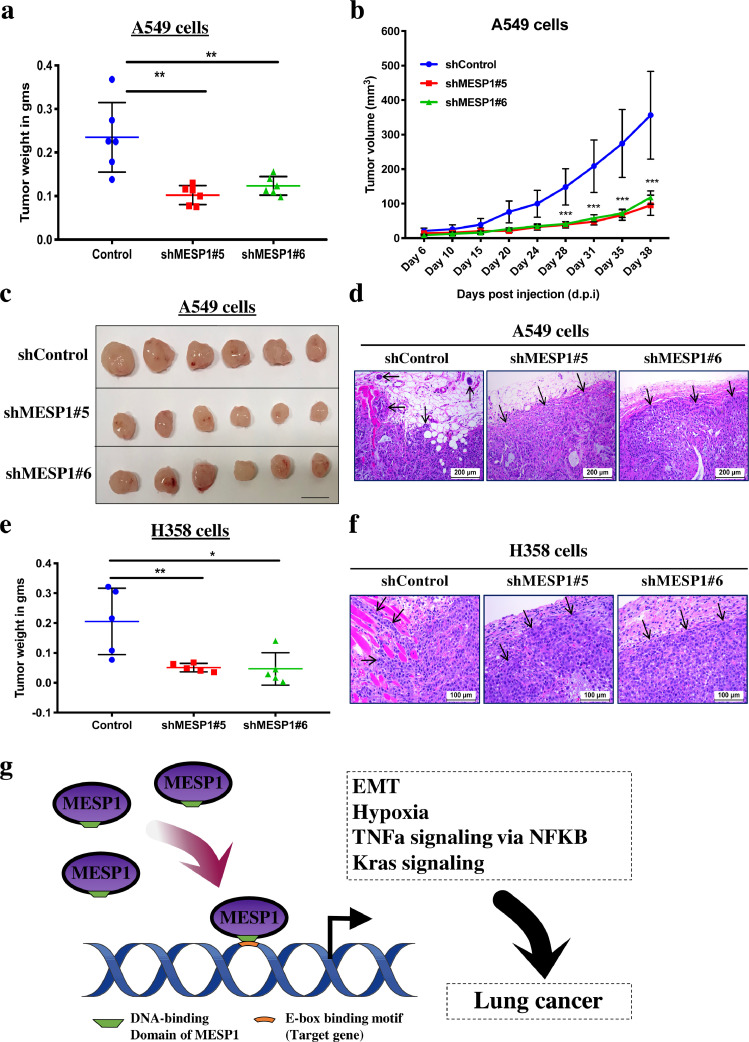
Methods: MESP1 mRNA and protein levels were measured in NSCLC-derived cells by qPCR and immunoblotting respectively. Colony formation assay, colorimetric cell proliferation assay and soft agar colony formation assays were used to assess the effects of MESP1 knockdown and overexpression in vitro. RNA-sequencing and chromatin immunoprecipitation (ChIP)-qPCR were used to determine direct target genes of MESP1. Subcutaneous injection of MESP1-depleted NSCLC cells in immuno-compromised mice was done to study the effects of MESP1 mediated tumor formation in vivo.
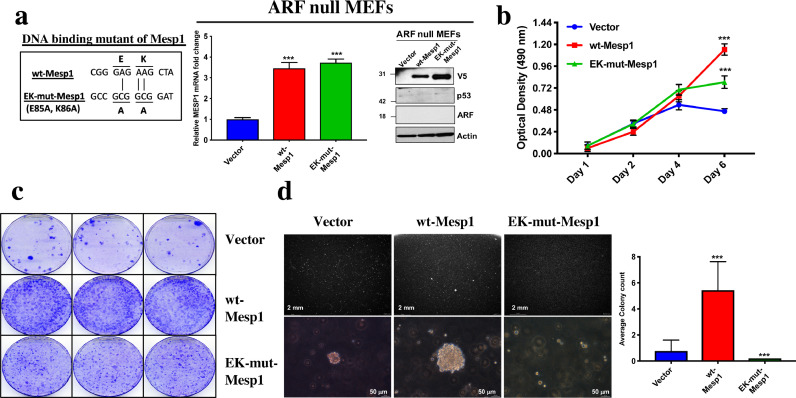
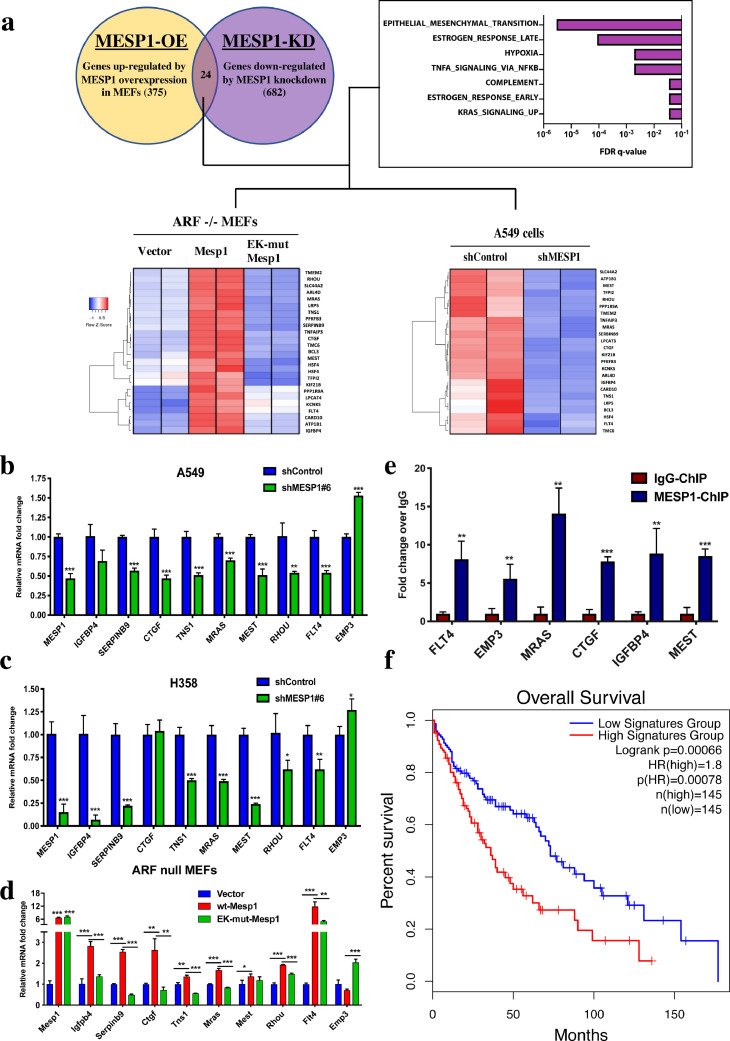
Findings: We found that MESP1 expression correlates with poor prognosis in NSCLC patients, and is critical for proliferation and survival of NSCLC-derived cells, thus implicating MESP1 as a lung cancer oncogene. Ectopic MESP1 expression cooperates with loss of tumor suppressor ARF to transform murine fibroblasts. Xenografts from MESP1-depleted cells showed decreased tumor growth in vivo. Global transcriptome analysis revealed a MESP1 DNA-binding-dependent gene signature associated with various hallmarks of cancer, suggesting that transcription activity of MESP1 is most likely responsible for its oncogenic abilities.
Interpretation: Our study demonstrates MESP1 as a previously-unknown lineage-survival oncogene in NSCLC which may serve as a potential prognostic marker and therapeutic target for lung cancer in the future.
Keywords: ARF; Lineage-survival oncogene; Lung cancer; Mesp1.
Copyright © 2019 The Authors. Published by Elsevier B.V. All rights reserved.
Conflict of interest statement
The authors declare no competing financial interests.
Figures
Similar articles
-
B-Myb Mediates Proliferation and Migration of Non-Small-Cell Lung Cancer via Suppressing IGFBP3.Int J Mol Sci. 2018 May 16;19(5):1479. doi: 10.3390/ijms19051479. Int J Mol Sci. 2018. PMID: 29772705 Free PMC article.
-
Depleting PTOV1 sensitizes non-small cell lung cancer cells to chemotherapy through attenuating cancer stem cell traits.J Exp Clin Cancer Res. 2019 Aug 6;38(1):341. doi: 10.1186/s13046-019-1349-y. J Exp Clin Cancer Res. 2019. PMID: 31387622 Free PMC article.
-
MG53 suppresses tumor progression and stress granule formation by modulating G3BP2 activity in non-small cell lung cancer.Mol Cancer. 2021 Sep 14;20(1):118. doi: 10.1186/s12943-021-01418-3. Mol Cancer. 2021. PMID: 34521423 Free PMC article.
-
Earlier and broader roles of Mesp1 in cardiovascular development.Cell Mol Life Sci. 2017 Jun;74(11):1969-1983. doi: 10.1007/s00018-016-2448-y. Epub 2017 Jan 3. Cell Mol Life Sci. 2017. PMID: 28050627 Free PMC article. Review.
-
Impact of bioinformatic procedures in the development and translation of high-throughput molecular classifiers in oncology.Clin Cancer Res. 2013 Aug 15;19(16):4315-25. doi: 10.1158/1078-0432.CCR-12-3937. Epub 2013 Jun 18. Clin Cancer Res. 2013. PMID: 23780890 Free PMC article. Review.
Cited by
-
Recent Advances in RNA Interference-Based Therapy for Hepatocellular Carcinoma: Emphasis on siRNA.Cell Biochem Biophys. 2024 Sep;82(3):1947-1964. doi: 10.1007/s12013-024-01395-6. Epub 2024 Jul 10. Cell Biochem Biophys. 2024. PMID: 38987439 Review.
-
High levels of MESP1 expression in non-small cell lung cancer can facilitate cell proliferation, metastasis and suppresses cell apoptosis.Transl Cancer Res. 2020 Oct;9(10):5956-5968. doi: 10.21037/tcr-20-1132. Transl Cancer Res. 2020. PMID: 35117208 Free PMC article.
-
SP-8356: A Novel Verbenone Derivative Exerts In Vitro Anti-Non-Small Cell Lung Cancer Effects, Promotes Apoptosis via The P53/MDM2 Axis and Inhibits Tumor Formation in Mice.Cell J. 2023 Dec 31;25(12):839-846. doi: 10.22074/cellj.2023.2008708.1385. Cell J. 2023. PMID: 38192254 Free PMC article.
-
Integrated co-expression analysis of regulatory elements (miRNA, lncRNA, and TFs) in bovine monocytes induced by Str. uberis.Sci Rep. 2023 Sep 12;13(1):15076. doi: 10.1038/s41598-023-42067-4. Sci Rep. 2023. PMID: 37699972 Free PMC article.
-
Soluble expression, purification, and secondary structure determination of human MESP1 transcription factor.Appl Microbiol Biotechnol. 2021 Mar;105(6):2363-2376. doi: 10.1007/s00253-021-11194-1. Epub 2021 Mar 2. Appl Microbiol Biotechnol. 2021. PMID: 33651130
References
-
- Ferlay J., Soerjomataram I., Dikshit R., Eser S., Mathers C., Rebelo M. Cancer incidence and mortality worldwide: sources, methods and major patterns in GLOBOCAN 2012. Int J Cancer. 2015;136(5):E359–E386. - PubMed
-
- Siegel R.L., Miller K.D., Jemal A. Cancer statistics, 2018. CA Cancer J Clin. 2018;68(1):7–30. - PubMed
-
- Howlader N, Noone AM, Krapcho M, Miller D, Brest A, Yu M, Ruhl J, Tatalovich Z, Mariotto A, Lewis DR, Chen HS, Feuer EJ, Cronin KA (eds). SEER Cancer Statistics Review, 1975-2016, National Cancer Institute. Bethesda, MD, https://seer.cancer.gov/csr/1975_2016/, based on November 2018 SEER data submission, posted to the SEER web site, April 2019.
-
- Garraway L.A., Sellers W.R. Lineage dependency and lineage-survival oncogenes in human cancer. Nat Rev Cancer. 2006;6(8):593–602. - PubMed
MeSH terms
Substances
LinkOut - more resources
Full Text Sources
Other Literature Sources
Medical
Molecular Biology Databases
Research Materials
