. 2019 Dec 4;104(5):972-986.e6.
doi: 10.1016/j.neuron.2019.10.002. Epub 2019 Nov 21.

Xenotransplanted Human Cortical Neurons Reveal Species-Specific Development and Functional Integration into Mouse Visual Circuits

Affiliations

Xenotransplanted Human Cortical Neurons Reveal Species-Specific Development and Functional Integration into Mouse Visual Circuits

Daniele Linaro et al. Neuron. .

Abstract

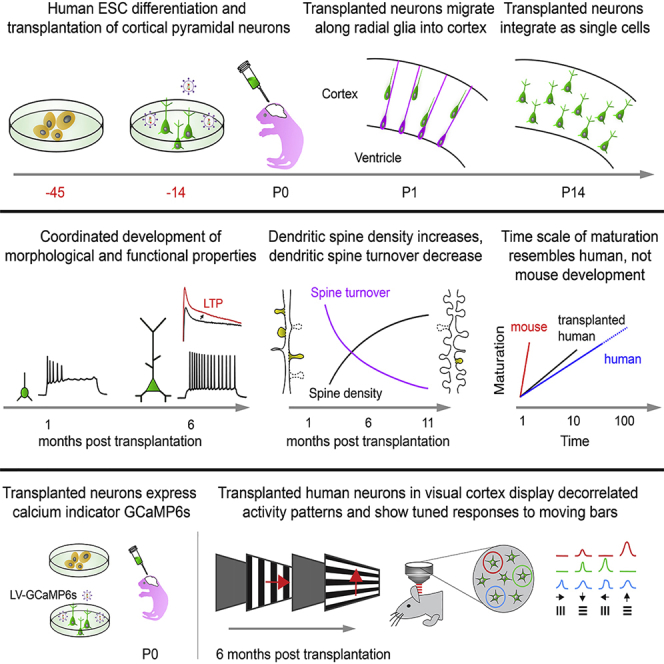
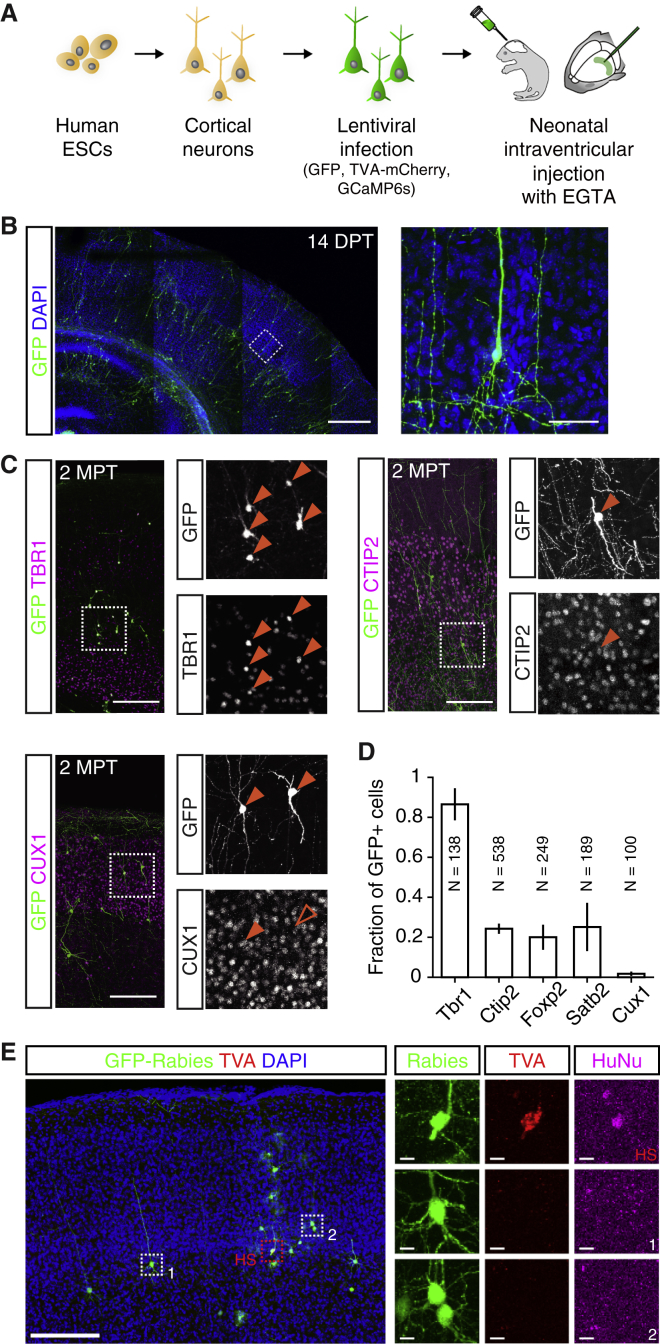
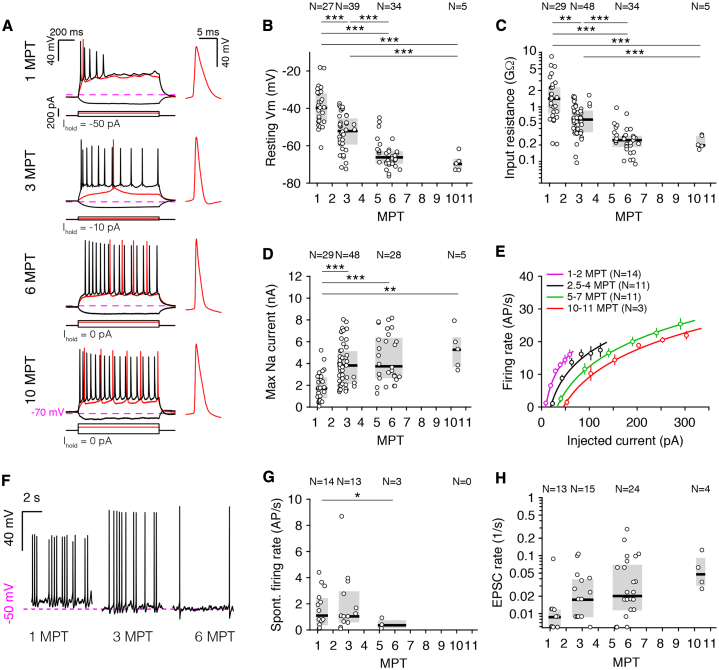
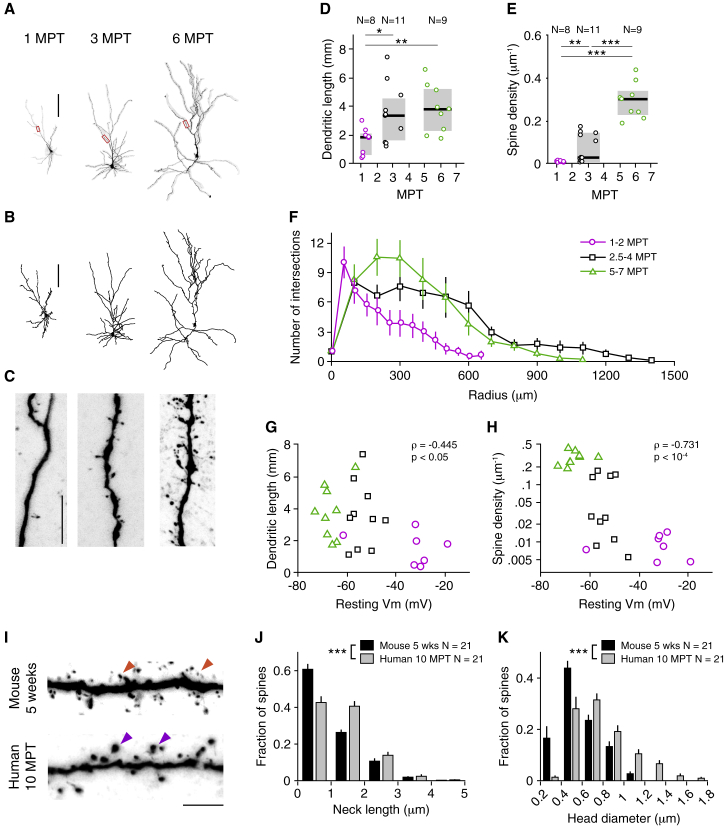
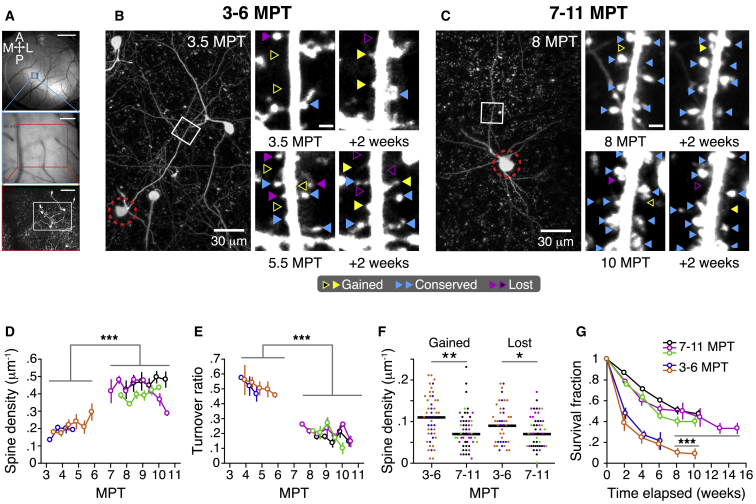
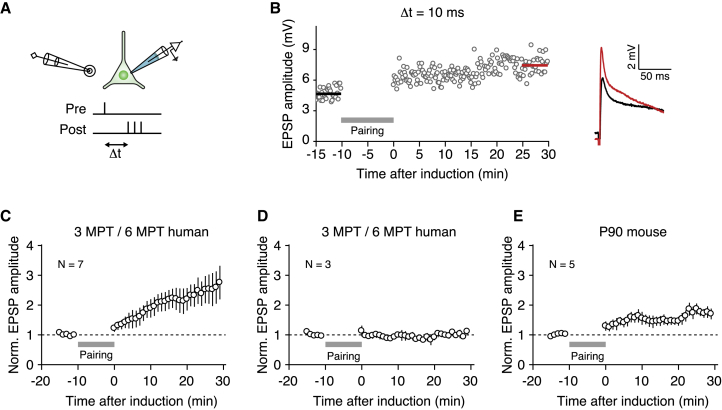
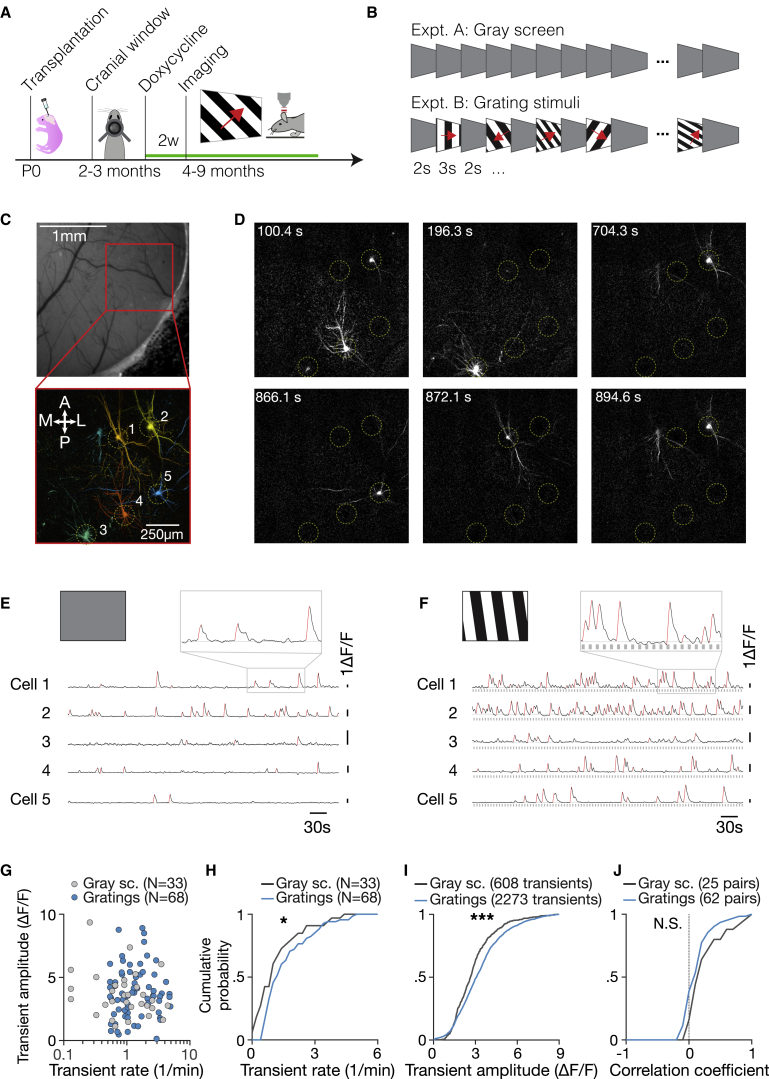
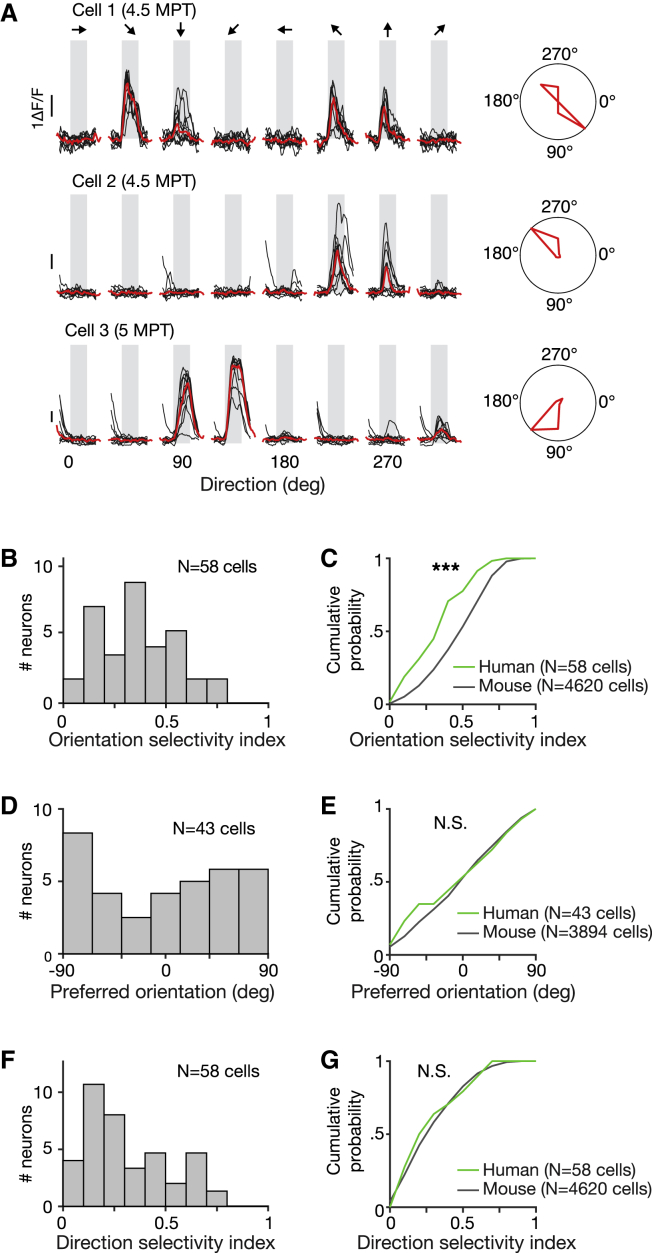
How neural circuits develop in the human brain has remained almost impossible to study at the neuronal level. Here, we investigate human cortical neuron development, plasticity, and function using a mouse/human chimera model in which xenotransplanted human cortical pyramidal neurons integrate as single cells into the mouse cortex. Combined neuronal tracing, electrophysiology, and in vivo structural and functional imaging of the transplanted cells reveal a coordinated developmental roadmap recapitulating key milestones of human cortical neuron development. The human neurons display a prolonged developmental timeline, indicating the neuron-intrinsic retention of juvenile properties as an important component of human brain neoteny. Following maturation, human neurons in the visual cortex display tuned, decorrelated responses to visual stimuli, like mouse neurons, demonstrating their capacity for physiological synaptic integration in host cortical circuits. These findings provide new insights into human neuronal development and open novel avenues for the study of human neuronal function and disease. VIDEO ABSTRACT.

Keywords: brain development; cortical neuron; dendritic spine; gcamp6; human brain evolution; multiphoton imaging; pluripotent stem cell; synapse formation; transplantation; visual cortex.


Conflict of interest statement

The authors declare no conflicts of interest.

Figures

None
Graphical abstract
Figure 1
Figure 1
Transplanted Human PSC-Derived Cortical Neurons Integrate as Single Cells in the Mouse Cortex (A) Human ESC differentiation and transplantation protocol. (B) Left: confocal image of immunostained coronal section from the brain of a transplanted animal showing GFP+ transplanted human neurons (green) integrated in the mouse cortex, 14 days post-transplantation (DPT), with cell bodies stained with DAPI (blue). Right: high magnification of the boxed subregion on the left (dashed lines). Note the radial orientation and extended apical processes of the human cortical neurons. (C) Example images of cortical sections from transplanted animals immunostained for markers of deep (Tbr1, Ctip2, Foxp2) and upper (Satb2, Cux1) cortical layer identity at 2 months post-transplantation (2 MPT). (D) Fraction of GFP+ human neurons expressing markers in (C). N denotes the number of sampled human cells for each marker (n = 4 animals). (E) Monosynaptic rabies virus tracing shows that human neurons make synaptic connections with host mouse cortical neurons at 4 MPT. Left: confocal image of immunostained section of rabies-injected transplanted cortex with starter human cells (HSs) and rabies-labeled presynaptic mouse cortical neurons (1, 2). Right: high magnification of boxed areas on the left (dashed boxes). Scale bars: (B) left, 500 μm, right, 50 μm; (C) 200 μm; (E) low-magnification image, 200 μm, high-magnification enlargements, 10 μm. See also Figure S1.
Figure 2
Figure 2
Xenotransplanted Human Cortical Neurons Show Prolonged Maturation (A) Whole-cell patch-clamp recordings in acute brain slices of xenotransplanted human neurons from 1 to 11 MPT. Left: representative membrane potential responses to hyperpolarizing (black) and depolarizing (red and black) current steps recorded at 1, 3, 6, and 10 MPT. Right: first action potential (AP) to minimal (rheobase) current injection. The offset current (Ihold) was adjusted, so the membrane potential was approximately −70 mV (dashed lines). AP shape and spiking response mature progressively. (B–D) Resting membrane potential (B), input resistance (C), and maximum sodium current (D) of xenotransplanted neurons versus time elapsed since transplantation. N denotes number of cells. (E) Firing rate versus input current (F-I) curves of cells grouped by time elapsed since transplantation. The markers and error bars indicate means ± SEMs for each group. The continuous lines are power-law fits (see Method Details). Note the rightward shifts of the F-I curves with maturation. (F) Example recordings of spontaneous activity (Ihold = 0 pA) at 1, 3, and 6 MPT. Note the progressive hyperpolarization and reduction of spontaneous firing. (G) Spontaneous firing rates versus time elapsed since transplantation. No cells showing spontaneous firing were observed after 6 MPT. (H) Rate of spontaneous incoming excitatory post-synaptic currents versus time elapsed since transplantation. The pooled data in (B)–(D), (G), and (H) are represented as medians and interquartile ranges. p < 0.05; ∗∗p < 0.01; and ∗∗∗p < 0.001; Welch’s one-way ANOVA with Games-Howell post hoc pairwise comparisons. See also Figure S2.
Figure 3
Figure 3
Morphological Maturation of Xenotransplanted Human Cortical Neurons over Months (A) Confocal images of representative biocytin-filled neurons at 1, 3, and 6 MPT. The boxed areas are shown enlarged in (C). (B) Three-dimensional reconstructions of the cells shown in (A). (C) High-magnification confocal images of the dendritic branches highlighted in red in (A). Note the appearance of spines at ∼3 MPT and the significant increase in spine density at ∼5 MPT. (D and E) Development of dendritic length (D) and spine density (E) for 28 reconstructed cells. Notice the marked separation in (E) between cells before 4 MPT and after 5 MPT. (F) Sholl analysis for the reconstructed cells, segregated in three groups according to their age. (G and H) Dendritic length (G) and spine density (H) as a function of resting membrane potential (Vm). Each marker represents a cell: magenta circles are cells aged 1–2 MPT, black squares are cells aged 2.5–4 MPT, and green triangles are cells aged 5–7 MPT. (I–K) Comparison of dendritic spine morphology between mouse cortical neurons at 5 weeks of age and human transplanted neurons at 10 MPT. (I) High-magnification images of mouse (top) and human (bottom) dendritic branches. Orange (purple) arrowheads indicate small- (large-)head dendritic spines. (J and K) Distributions of neck lengths (J) and head diameters (K) for human and mouse dendritic spines. Scale bars: (A) and (B) 100 μm, (C) 10 μm, and (I) 5 μm. Markers and error bars indicate means ± SEMs. In (D) and (E), pooled data are represented as medians and interquartile ranges. p < 0.05; ∗∗p < 0.01; and ∗∗∗p < 0.001. (D) and (E) Welch’s one-way ANOVA with Games-Howell post hoc pairwise comparisons; (J) and (K) Kolmogorov-Smirnov test. In (G) and (H), the reported value of ρ is Spearman’s rank correlation coefficient. See also Figure S3.
Figure 4
Figure 4
Transplanted Human Cortical Neurons Develop Increasingly Stable Dendritic Spines Structural Dynamics (A) Cellular imaging of xenotransplanted cells, dendrites, and spines over weeks. A cranial window was implanted and GFP-labeled transplanted cells in superficial layers of the cortex (100–250 μm) were imaged using a 2-photon microscope at 1- to 2-week intervals for up to 15 weeks starting at 3 MPT (n = 2 animals) or 7 MPT (n = 3 animals). Surface blood vessels and two-photon images were used to target neurons and dendrites across weeks. Top: camera view of the cranial window with 2× lens and blue/green excitation/collection. Center: camera view of targeted region through the 25× multiphoton objective lens. Bottom: maximum intensity projection of a two-photon image stack centered on a cluster of human neurons. Scale bars: 1 mm (top), 200 μm (center), and 100 μm (bottom). (B) Example of dendritic spines dynamics at 3–6 MPT for neuron cluster in (A). Left: maximum intensity projection image showing cell soma (red dashed circle) and a targeted dendritic branch segment (white box). Right: spine annotation of dendritic segment shown on the left at 3.5 and 5.5 MPT (white box, left column) and 14 days later (right column), showing spine gain (yellow), spine loss (purple), and conserved spines (blue). (C) Example of dendritic spine dynamics at 7–10 MPT. The conventions are as in (B). Note the increase in conserved spines (blue) relative to spine gains and losses (yellow and purple). (D) Spine density as a function of time elapsed since transplantation for five animals. Each set of colored symbols summarizes the data of 2–7 targeted dendritic branches from 1 animal. Spine density at 7–10 MPT is significantly higher than at 3–6 MPT (n = 3 versus n = 2 animals, 1-way mixed ANOVA). Note the trend of increasing spine density with elapsed time at 3–6 MPT. Error bars denote SEMs across branches. (E) Spine turnover ratio as a function of elapsed time. Turnover ratio at 7–10 MPT is significantly lower than at 3–6 MPT (n = 3 versus n = 2 animals, 1-way mixed ANOVA). (F) Density of gained and lost spines at 3–6 MPT and 7–10 MPT. Each data point corresponds to one dendritic segment at one time point. Note the significant decreases in the densities of gained and lost spines between 3–6 MPT and 7–10 MPT (n = 2 versus n = 3 animals, 1-way ANOVA). (G) Fraction of conserved spines (survival fraction) as a function of elapsed time. Note how the survival fraction measured at 7–10 MPT decays more slowly than at 3–6 MPT (n = 3 versus n = 2 animals, 1-way mixed ANOVA). Markers and error bars indicate means ± SEMs. p < 0.05; ∗∗p < 0.01; and ∗∗∗p < 0.001.
Figure 5
Figure 5
Transplanted Human Cortical Neurons Show Long-Term Potentiation of Local Cortical Inputs (A) Schematic of paired stimulation long-term potentiation (LTP) induction paradigm. (B) Example of one representative cell that showed potentiation. (C) EPSP amplitude as a function of time in response to 10 min of pre- to post-pairing for the n = 7 human cells that displayed LTP. (D) Same as (C), but for the n = 3 human cells that displayed a stable EPSP amplitude in response to the pairing protocol. (E) Same as (C) and (D), but for n = 5 mouse cells recorded in 3-month-old mice. Markers and error bars indicate means ± SEMs.
Figure 6
Figure 6
Transplanted Human Cortical Neurons Show Decorrelated Spontaneous and Visually Evoked Activity (A) Assay for in vivo calcium imaging of transplanted human neurons in the mouse cortex. Xenotransplanted neurons were engineered to express doxycycline-inducible GCaMP6s and nuclear label dTomato. A chronic cranial window was implanted at 2–3 MPT over left visual cortex, and starting at 4.5 MPT, animals were head fixed awake under a 2-photon microscope with a display monitor facing the right eye. Somatic calcium signals were recorded from xenotransplanted neurons in superficial (100–300 μm) layers. (B) Neurons were stimulated with static gray screen (expt. A) or square-wave drifting gratings of different temporal frequencies, spatial frequencies, spatial orientations, and directions of motion (expt. B). (C) Widefield fluorescence camera image (top) and two-photon field of view showing imaged cell bodies and proximal dendrites (bottom). Images generated using activity correlation analysis (see also Figures S4E and S4F). (D) Differential delta fluorescence (ΔF) images showing human neurons firing at a distinct time points during the drifting gratings experiment. Yellow dashed circles mark the location of five neurons showing activity during the experiment. (E) Spontaneous activity of human neurons in the visual cortex shown in (C) and (D). Somatic calcium time courses of simultaneously imaged neurons (black lines) in the absence of visual stimulation (static gray screen, expt. A) with identified calcium transients highlighted (red) are shown. Calcium transients are defined as epochs where the calcium signal increase per second exceeds 2 × SD of the distribution (STD) of baseline. (F) Same as (E), for the visual stimulation experiment (expt. B). Somatic calcium time courses of simultaneously imaged neurons during the presentation of grating stimuli (expt. B, gray squares) for the same five neurons in (C) and (D) are shown. Note how visual stimulation increases the frequency and amplitude of calcium transients (red lines). (G) Scatter plot of calcium transient rate versus amplitude for all spontaneously active human neurons (33 cells from 5 animals, gray dots) and for visually responsive neurons (68 cells from 6 animals, blue dots). Visually responsive neurons are defined as having a median ΔF/F0 response >3 SD over baseline for >1 s. (H) Cumulative plots show distributions of transient rates for gray screen (gray line, n = 33 neurons) and visual stimulation (blue line, n = 68 neurons). (I) Same as (H), for transient amplitude. (J) Cumulative plots show distributions of activity correlations computed between calcium activity time courses of simultaneously recorded pairs for gray screen (gray line, n = 25 pairs) and visual stimulation data (blue line, n = 62 pairs). The calcium activity of human neurons is only weakly correlated across cell pairs, in the presence and absence of visual stimuli, indicating that they respond to distinct inputs. See also Figure S4.
Figure 7
Figure 7
Transplanted Human Neurons Show Orientation and Direction Tuned Responses Resembling the Responses of Mouse Visual Cortical Neurons (A) Single-trial (black) and median (red) somatic calcium time courses of three human neurons aligned to visual stimulation epoch (gray). The responses shown are for grating stimuli of eight different directions of motion (left or right), together with corresponding median response polar plots. (B) Distributions of orientation selectivity indices computed from calcium time courses of human neurons. (C) Cumulative plots comparing the distributions of orientation selectivity indices of human (green line) and mouse (black line) cortical neurons. Lower orientation selectivity values are consistent with the maturing state of the human neurons. (D) Distributions of preferred orientations computed from calcium time courses of human neurons. (E) Cumulative plots comparing the distributions of preferred orientations of human (green line) and mouse (black line) cortical neurons. (F) Distributions of direction selectivity indices computed from calcium time courses of human neurons. (G) Cumulative plots comparing the distributions of direction selectivity indices of human (green line) and mouse (black line) cortical neurons. The distributions of preferred orientations and direction selectivity indices of human and mouse neurons were similar. Mouse neural recordings are from transgenic mouse V1 L2/3 pyramidal neurons (mouse line CaMKII-tTA x TRE-GCamp6.lineG6s2). See also Figure S5.

References

    1. Andermann M.L., Kerlin A.M., Roumis D.K., Glickfeld L.L., Reid R.C. Functional specialization of mouse higher visual cortical areas. Neuron. 2011;72:1025–1039. - PMC - PubMed
    1. Anderson S., Vanderhaeghen P. Cortical neurogenesis from pluripotent stem cells: complexity emerging from simplicity. Curr. Opin. Neurobiol. 2014;27:151–157. - PMC - PubMed
    1. Astick M., Vanderhaeghen P. From Human Pluripotent Stem Cells to Cortical Circuits. Curr. Top. Dev. Biol. 2018;129:67–98. - PubMed
    1. Bae B.I., Jayaraman D., Walsh C.A. Genetic changes shaping the human brain. Dev. Cell. 2015;32:423–434. - PMC - PubMed
    1. Beaulieu-Laroche L., Toloza E.H.S., van der Goes M.S., Lafourcade M., Barnagian D., Williams Z.M., Eskandar E.N., Frosch M.P., Cash S.S., Harnett M.T. Enhanced Dendritic Compartmentalization in Human Cortical Neurons. Cell. 2018;175:643–651.e14. - PMC - PubMed

Publication types