. 2019 Dec 11;26(6):748-763.e20.
doi: 10.1016/j.chom.2019.10.006. Epub 2019 Nov 21.

Principles Governing Establishment versus Collapse of HIV-1 Cellular Spread

Affiliations

Principles Governing Establishment versus Collapse of HIV-1 Cellular Spread

Jason M Hataye et al. Cell Host Microbe. .

Abstract

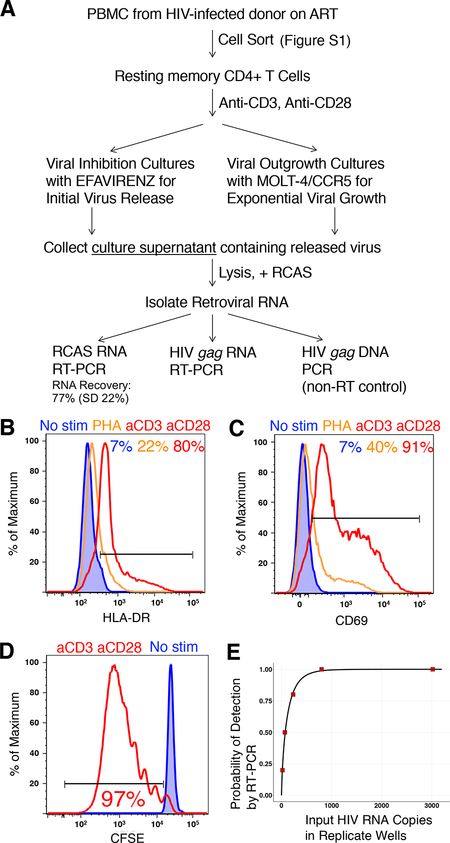
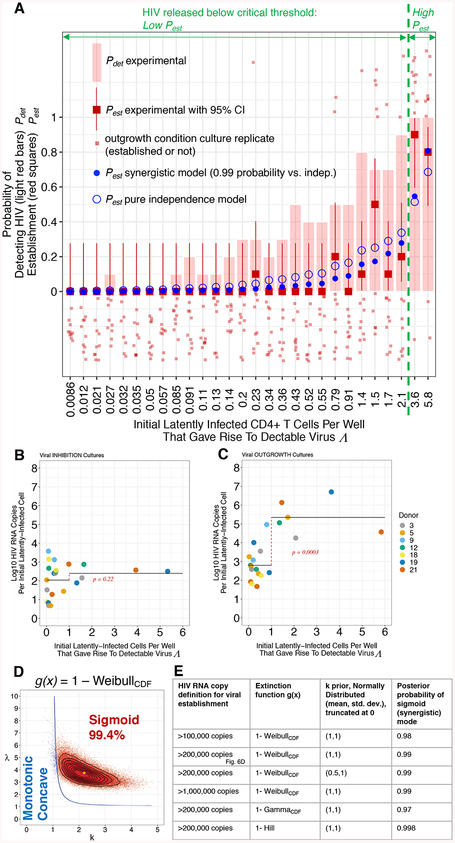
A population at low census might go extinct or instead transition into exponential growth to become firmly established. Whether this pivotal event occurs for a within-host pathogen can be the difference between health and illness. Here, we define the principles governing whether HIV-1 spread among cells fails or becomes established by coupling stochastic modeling with laboratory experiments. Following ex vivo activation of latently infected CD4 T cells without de novo infection, stochastic cell division and death contributes to high variability in the magnitude of initial virus release. Transition to exponential HIV-1 spread often fails due to release of an insufficient amount of replication-competent virus. Establishment of exponential growth occurs when virus produced from multiple infected cells exceeds a critical population size. We quantitatively define the crucial transition to exponential viral spread. Thwarting this process would prevent HIV transmission or rebound from the latent reservoir.

Keywords: Allee effect; HIV; critical threshold; exponential growth; latency; latent reservoir; mathematical modeling; population dynamics; rebound; viral dynamics.


Conflict of interest statement

DECLARATION OF INTERESTS

The content of this publication does not necessarily reflect the views or policies of the Department of Health and Human Services or the Department of Energy, nor does mention of trade names, commercial products, or organizations imply indorsement by the U.S. Government. The authors declare no competing interests.

Figures

Figure 1.
Figure 1.. Detection of Released HIV Following CD4 T Cell Latency Reactivation
(A) Experimental workflow. (B and C) Resting memory (RM) CD4 T cells were cultured for 3 days with no stimulation, PHA, or stimulation through CD3 and CD28, and assayed for expression of HLA-DR (B) and CD69 (C). (D) RM CD4 T cells were stained with CFSE and placed into culture for 8 days with or without stimulation through CD3 and CD28. (E) Detection of ex vivo released HIV following serial dilution into new viral inhibition cultures with stimulated CD4 T cells from an HIV-uninfected donor.
Figure 2.
Figure 2.. Kinetics of HIV RNA Release, and CD4 T Cell Proliferation and Survival, in Limiting Dilution Viral Inhibition Cultures
(A) Detection of HIV release into supernatant (total in red bold), arising from latency reactivation in culture with efavirenz. Of 225 replicate cultures, just the 42 with detectable HIV (5 donors, with Λ ≤ 0.51, Table S2) shown with replicate index. (B) HIV RNA signal decay in viral inhibition CD4 T cell culture. (C) Following stimulation of CD4 T cells isolated from HIV-infected donors 3 and 9, the number of live cells is stable in culture. (D) Day 5 proliferation profile following stimulation of CFSE labeled resting CD4+ T cells. (E) ODE least-squares fit of cell division and death, assuming these rates are equal (Figure 2C), to the CFSE data in Figure 2D (ρ = μ = 0.48/d).
Figure 3.
Figure 3.. Population Dynamic Models of Initial HIV Release Following Latency Disruption
Circles represent cell compartments and arrows represent transitions. L is an initial latently-infected CD4 T cell (LIC) that can transition to one of two eclipse phases E, which can transition to a productive-infected cell state I that releases virus V at rate p, and dies at rate δ. V decays at rate c, and under viral inhibition, there are no new infections. Eclipse phase cells E divide at rate ρ and die at rate μ, and transition to the next compartment in series at rate a or b.
Figure 4.
Figure 4.. Stochastic Population Dynamic Model 3 Recapitulates the Highly Variable Initial HIV Release
Column 1 Indicates the Data Type for a given Row (A–E). Columns 2–5 show HIV RNA on each day (averaged over 225 wells), and histograms scaled to a maximum of 1 for Total HIV RNA Detected, Delay to First HIV Detection, and Detection Duration. Experimental HIV RNA detection data from Figure 2A (Red dots and histograms), ODE model fit (Blue curves), and stochastic model predictions (Orange histograms) are shown. D and p show Kolmogarov-Smirnov statistic comparing experiment and model with p-value. (A) HIV RNA Detection from 225 viral inhibition wells at limiting dilution, from Figure 2A. (B) Model 1 Fits. ρ = μ = 0.48/d, a = 0.40/d, δ = 0.40/d, p = 628/d, c = 0.22/d. fHIV = 0.55 (For a single cell starting in compartment E, fHIV is the probability of virus detection.). (C) Model 2 Fits. ρ = μ = 0.48/d, a = 1.50/d, δ = 1.48 /d, p = 1423/d, c = 0.22 /d for n = 5 eclipse phase compartments. fHIV = 0.40. (D) Model 3 Fits. ρ = δ = 0.48/d, a = 1.54/d, δ = 1.38/d, pA = 2166/d, c = 0.22/d, b = 0.75/d, pB = 112/d, fa = 10/d, fb = 5.5/d, for n = 5. fHIV = 0.41. This parameter set (Table S4) used for Figures 5–7. (E) Model 3 Fits with ρ = μ = 0. a = 1.52/d, δ = 1.44/d, pA = 5600/d, c = 0.22/d, b = 1.05/d, pB = 112/d, fa = 10/d, fb = 15/d, for n = 5. fHIV = 0.64. (F) Model 3 simulations (with parameters in 4D) of 225 limiting dilution viral inhibition wells (Figure 2A), only the 42 on average that resulted in detectable HIV are shown. Each panel indicates L, the total high producer IA, total low producer IB, and simulated total HIV detected.
Figure 5.
Figure 5.. Initial Release of Replication-Competent HIV Is Often Not Sufficient for Viral Establishment
The dotted red lines depict viral establishment definitions at 1 × 10⁵, 2 × 10⁵, or 1 × 10⁶ HIV RNA copies. The dashed green line at 5100 HIV RNA copies indicates the critical threshold, predicted from analysis in Figures 6A & 6D and the fit Model 3 (Figure 4D and Table S4). Each panel in A, B, and D represents 10 replicate cultures, many of which had no detectable HIV RNA. Solid red lines (5B) and filled red dots (5C) designate primary outgrowth condition supernatants that were HIV RNA positive on day 8 and that resulted in de novo virus production following transfer to secondary culture, confirming replication-competent (rc) virus. (A) Primary viral inhibition with efavirenz for Donor 19. (B) Primary viral outgrowth cultures for Donor 19 with excess target cells. (C) Each dot indicates the maximum HIV RNA copies detected from 3 samplings (typically days 4, 8 and 12) of one replicate culture, in viral inhibition or outgrowth conditions, pooled from experiments with 7 donors on ART. Figure S5 features faceting by donor and CD4 T cell dilution. (D) Tertiary cultures in which virus passaged from a Donor 19 primary well was serially diluted (right column) on day 0 with cell wash on day 1. Orange-brown designates establishment to > 2 × 10⁵ HIV RNA copies, purple wells did not establish despite de novo virus production following day 1, indicating the infecting virus was rc. (E) Count of the 51 replicates, binned by Log10 maximum HIV RNA copies, that were positive beyond day 0 from 5D.
Figure 6.
Figure 6.. Viral Establishment Depends on an Initial Release Exceeding a Critical Threshold
(A) Probabilities of outcomes (y-axis) versus Λ (x-axis). Light red bar: Probability of HIV RNA detection, Pdet. Red filled squares: Probability of viral establishment Pest to > 2 × 10⁵ HIV RNA copies for experimental, with 95% confidence interval. Fit to non-summarized outgrowth well data (light red squares): wells that established (top) and did not establish (bottom): Pest synergistic model (Equations [1] and [6] in STAR Methods; Blue filled circle, Figures 6D and S6, and Table S6), and Pest independence model (Equations [1] and [4] in STAR methods; Blue open circle, Figure S6 and Table S7). Critical threshold predicted in 6D shown in green. (B-C) Expected initial LICs that gave rise to detectable HIV RNA Λ per well (x-axis) versus average log10 maximum HIV RNA copies per cell (y-axis) for viral INHIBITION (B) or OUTGROWTH (C) cultures. Horizontal black lines represent mean log10 HIV RNA copies per Λ, for Λ ≤ 1 and Λ > 1. Cell dilutions with no HIV RNA positive wells were excluded. Welch t-test for comparing these 2 groups, t = −1.26, df = 17.3, p = 0.22 shown in red for viral inhibition (B) and for (C) outgrowth, t = −5.75, df = 8.78, p = 0.0003. (D) Posterior distribution for k and λ parameters for Weibull-based statistical model to test for an Allee effect (See STAR Methods; Equations [1] and [6]). Pest(Λ) is monotonic concave (blue) up to and including line; inside this line Pest(Λ) is sigmoid (red) with the percentage of posterior k and λ estimates producing sigmoid form (Figure S6) indicated. (E) Bayesian inference results in a sigmoid (synergistic) mode using 3 distinct dual-mode (monotonic concave versus sigmoid) extinction functions g(x), 3 viral establishment definitions, and a prior for k with a maximum frequency at 1 or 0.5, outside the sigmoid regime (6D).
Figure 7.
Figure 7.. A Cascade of Stochastic Processes and an Allee Effect Result in Rare Viral Establishment
Exact number of initial LICs, x (from Model 3 simulation, Figure 4D). Establishment probability to 2 × 10⁵ HIV RNA copies, Pest, for exactly x cells (Equation [5] in STAR Methods), and mapped to the initial HIV release (red shading in A-E) using Model 3 (parameters: Table S4). Dashed green lines depict critical threshold at 5100 HIV RNA copies. (A-E) Simulated probability density of total initial HIV release detected (lower x-axis) arising from 1–5 exact initial LICs, with percentage resulting in detectable HIV (second column) and Pest (third column). (F-G) Outcomes of 100 lineages, each from a single initial LIC receiving stimulation. (H) Pest as a function of x. Pest (x = 1) = 0.02.

Comment in

References

    1. Altschul SF, Gish W, Miller W, Myers EW, and Lipman DJ (1990). Basic local alignment search tool. J. Mol. Biol 215, 403–410. - PubMed
    1. Andreu-Moreno I, and Sanjuán R (2018). Collective Infection of Cells by Viral Aggregates Promotes Early Viral Proliferation and Reveals a Cellular-Level Allee Effect. Curr. Biol. CB 28, 3212–3219.e4. - PMC - PubMed
    1. Baba M, Miyake H, Okamoto M, Iizawa Y, and Okonogi K (2000). Establishment of a CCR5-expressing T-lymphoblastoid cell line highly susceptible to R5 HIV type 1. AIDS Res. Hum. Retroviruses 16, 935–941. - PubMed
    1. Banga R, Procopio FA, Noto A, Pollakis G, Cavassini M, Ohmiti K, Corpataux J-M, de Leval L, Pantaleo G, and Perreau M (2016). PD-1(+) and follicular helper T cells are responsible for persistent HIV-1 transcription in treated aviremic individuals. Nat. Med 22, 754–761. - PubMed
    1. Beliakova-Bethell N, Hezareh M, Wong JK, Strain MC, Lewinski MK, Richman DD, and Spina CA (2017). Relative efficacy of T cell stimuli as inducers of productive HIV-1 replication in latently infected CD4 lymphocytes from patients on suppressive cART. Virology 508, 127–133. - PMC - PubMed

Publication types