. 2019 Dec 5;25(6):768-783.e6.
doi: 10.1016/j.stem.2019.10.006. Epub 2019 Nov 21.

Apelin+ Endothelial Niche Cells Control Hematopoiesis and Mediate Vascular Regeneration after Myeloablative Injury

Affiliations

Apelin+ Endothelial Niche Cells Control Hematopoiesis and Mediate Vascular Regeneration after Myeloablative Injury

Qi Chen et al. Cell Stem Cell. .

Abstract

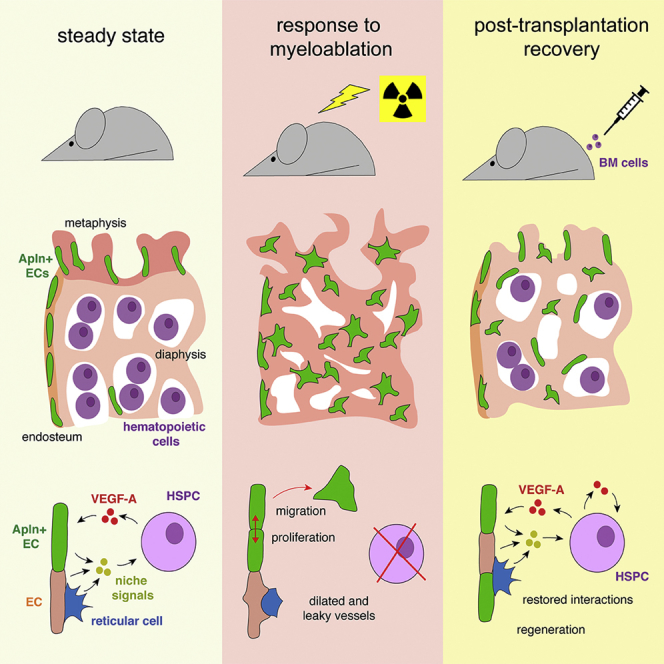
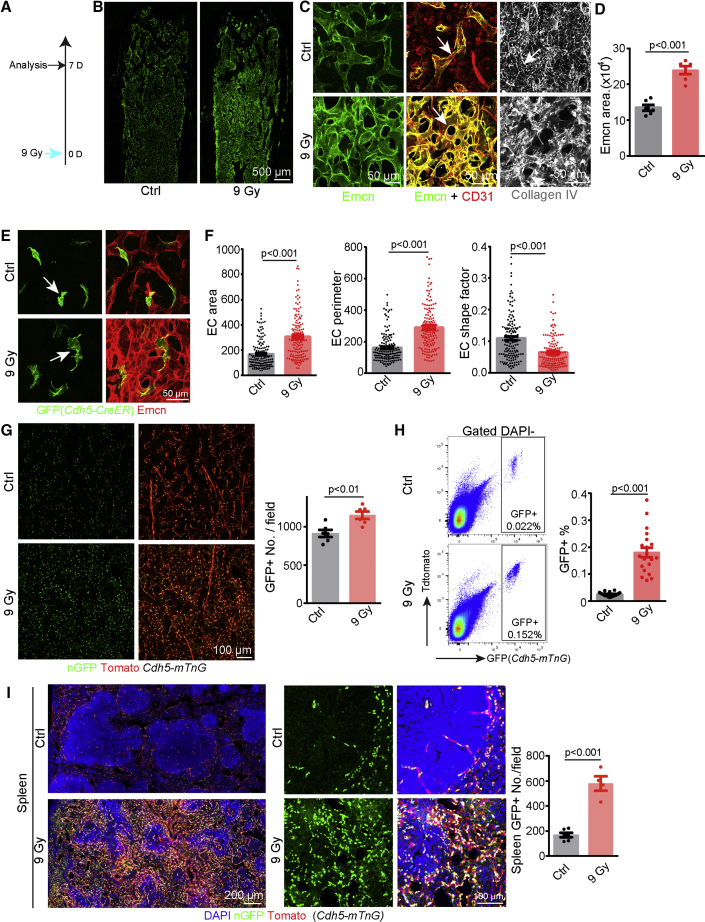
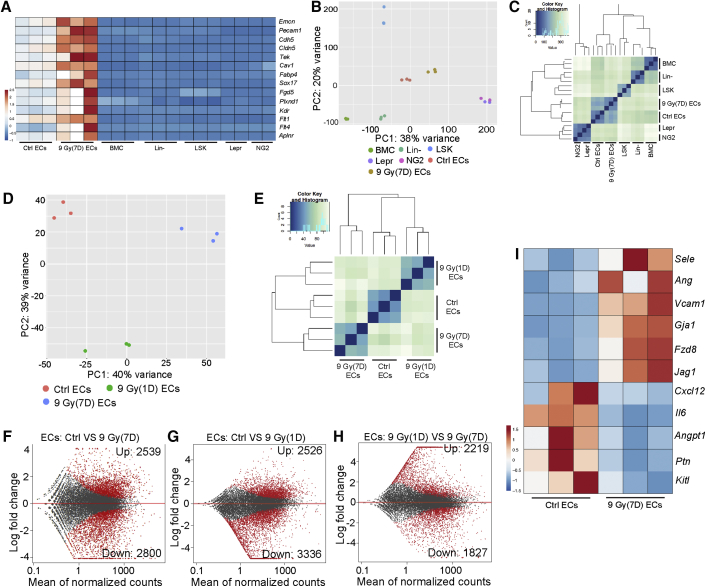
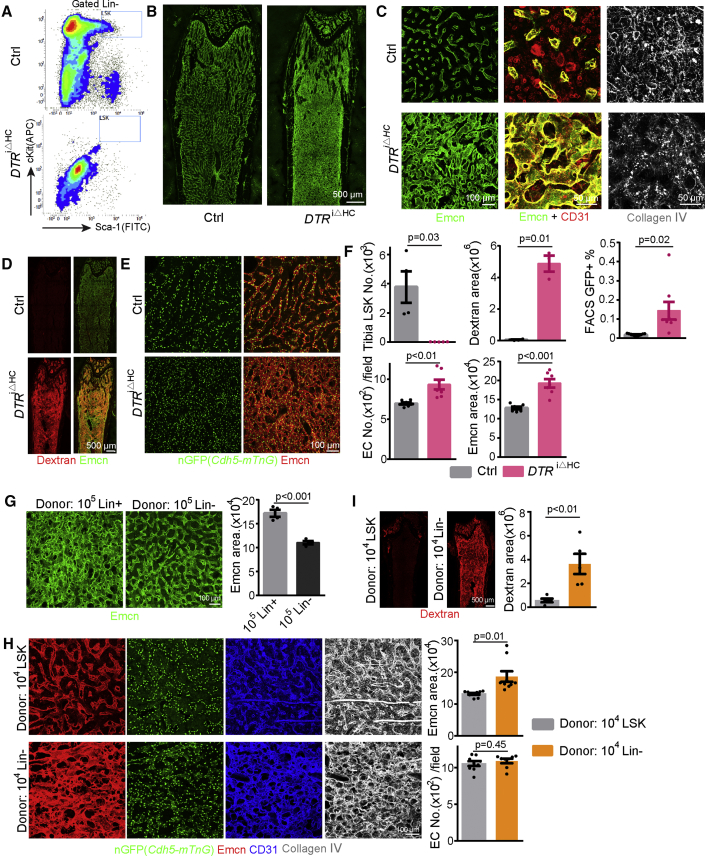
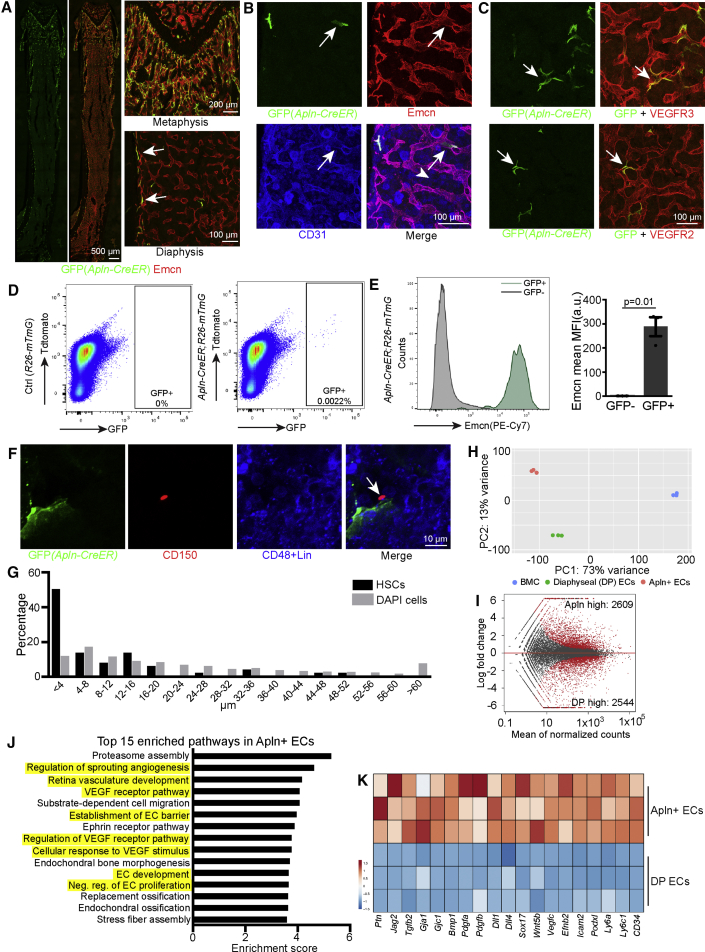
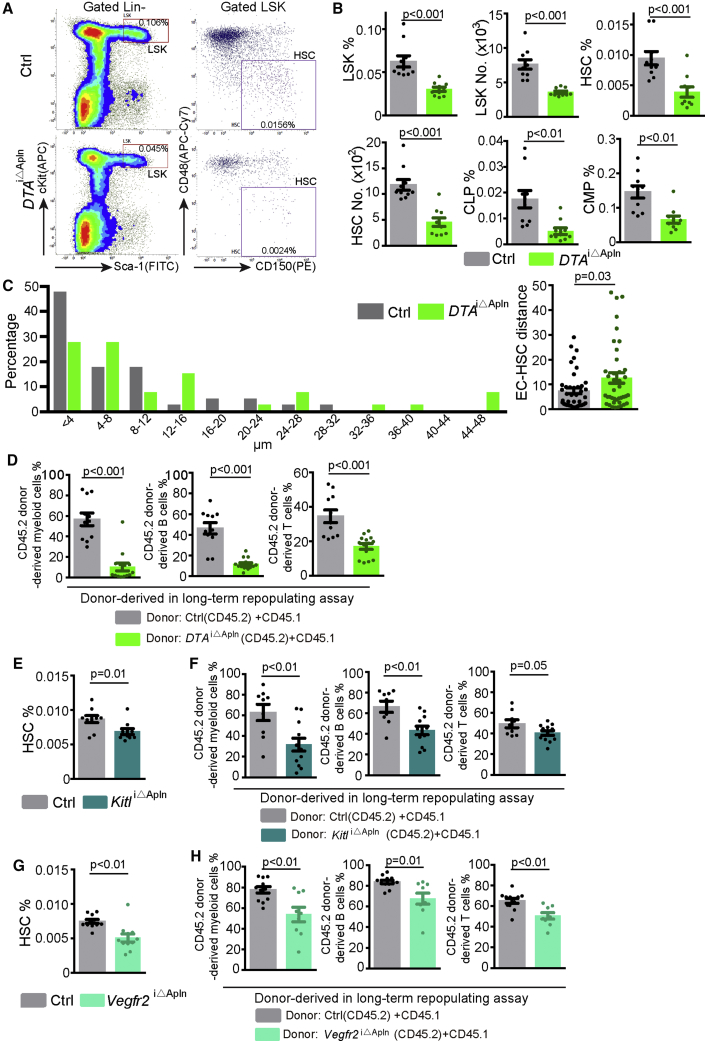
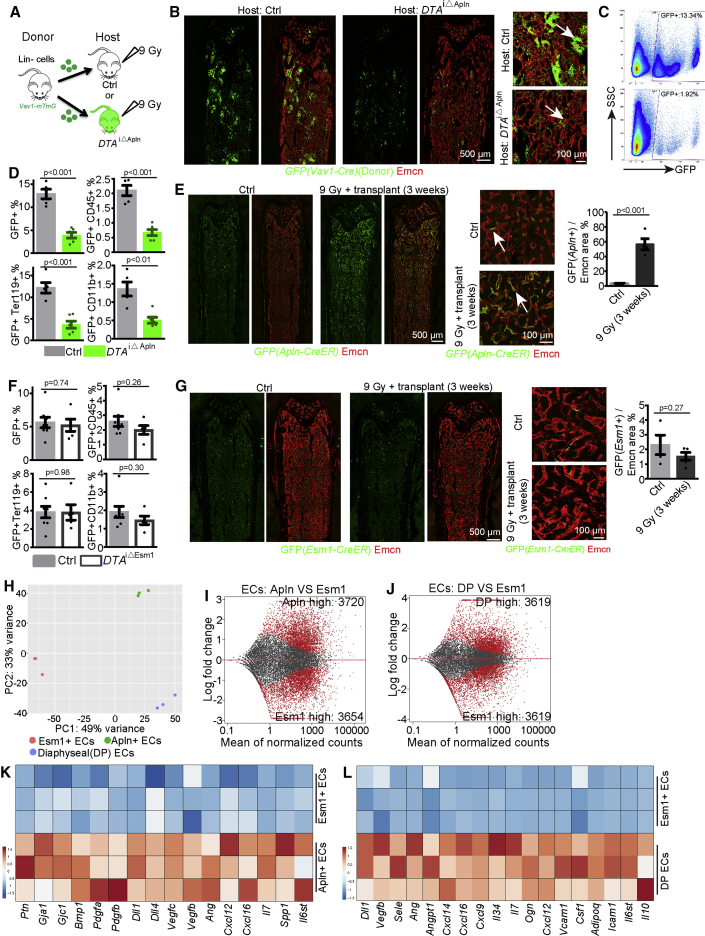
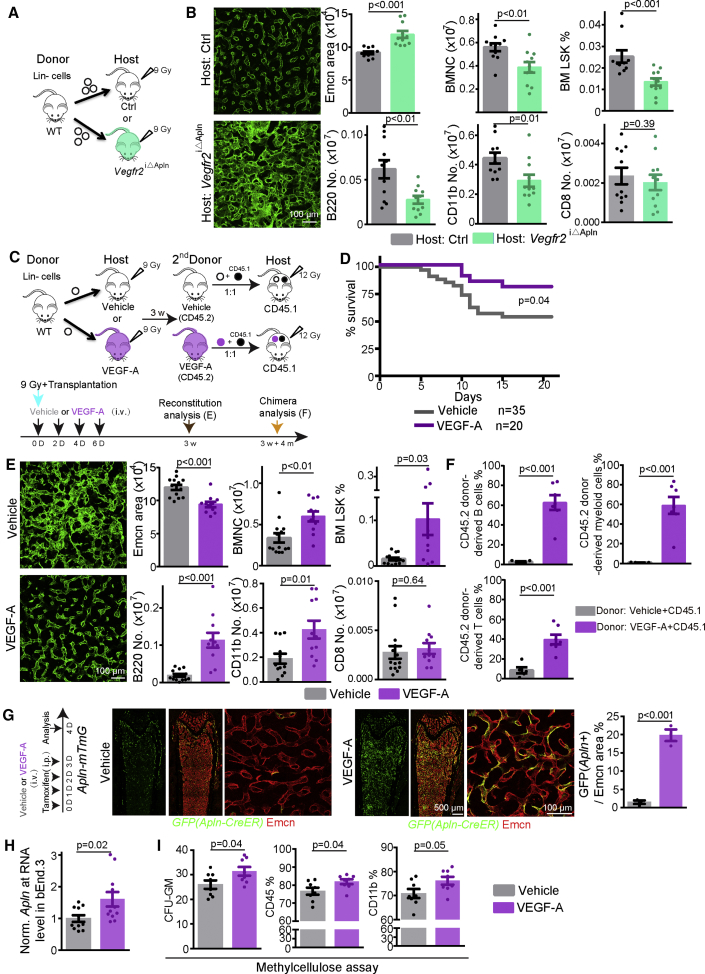
Radiotherapy and chemotherapy disrupt bone vasculature, but the underlying causes and mechanisms enabling vessel regeneration after bone marrow (BM) transplantation remain poorly understood. Here, we show that loss of hematopoietic cells per se, in response to irradiation and other treatments, triggers vessel dilation, permeability, and endothelial cell (EC) proliferation. We further identify a small subpopulation of Apelin-expressing (Apln+) ECs, representing 0.003% of BM cells, that is critical for physiological homeostasis and transplant-induced BM regeneration. Genetic ablation of Apln+ ECs or Apln-CreER-mediated deletion of Kitl and Vegfr2 disrupt hematopoietic stem cell (HSC) maintenance and contributions to regeneration. Consistently, the fraction of Apln+ ECs increases substantially after irradiation and promotes normalization of the bone vasculature in response to VEGF-A, which is provided by transplanted hematopoietic stem and progenitor cells (HSPCs). Together, these findings reveal critical functional roles for HSPCs in maintaining vascular integrity and for Apln+ ECs in hematopoiesis, suggesting potential targets for improving BM transplantation.

Keywords: Apln (Apelin); Esm1; VEGF; VEGFR; bone marrow transplantation; endothelial cell heterogeneity; hematopoietic stem cell; irradiation; stem cell niche; vessel regeneration.


Conflict of interest statement

The authors declare no competing interests.

Figures

None
Graphical abstract
Figure 1
Figure 1
Irradiation-Induced Changes in the Vasculature of BM and Spleen (A) Schematic representation of protocol for lethal irradiation analysis. (B) Tile scan overview images of Emcn-stained vessels in adult femur after irradiation. (C) Emcn, CD31, and collagen IV immunostaining of control and irradiated BM, as indicated. Arrows mark Emcn+ CD31+ vessels in middle panel and collagen IV+ reticular fiber on the right. (D) Quantification of Emcn+ area in imaging field (n = 6 per group). (E) Morphology of individual ECs (arrows) in control and irradiated bones of Cdh5-CreER R26-mTmG mice. Low dosage of tamoxifen was injected 6 days after irradiation. (F) Quantification of area, perimeter, and shape factor from control (n = 147 from 3 mice) and 9 Gy (n = 140 from 4 mice) single ECs. Shape factor is a numerical indication of how similar a 2D shape is to a perfect circle, which has a shape factor of 1. (G) Nuclear GFP+ (nGFP+) ECs in control and irradiated Cdh5-mTnG diaphysis. Graph shows quantitation of GFP+ cells (n = 6 in each group). (H) FACS plot of GFP+ cells from control and irradiated Cdh5-mTnG mice. Graph show frequency of GFP+ cells (n = 20 in each group). (I) Tile scan overview images and selected maximum intensity projections of spleen vessels in Cdh5-mTnG mice. Quantification of GFP+ nuclei in each image field (Ctrl n = 6; 9 Gy n = 4) is shown. Error bars, mean ± SEM. p values, two-tailed unpaired Student’s t test. See also Figure S1.
Figure 2
Figure 2
Irradiation Induces Dynamic Changes in the Transcription Profile of BM ECs (A) Heatmap of selected EC-enriched genes in BM cells, Lin cells, LSK cells, ECs, irradiated ECs (9 Gy, 7 days), Lepr+, and NG2+ cells. (B) PCA plot of control and irradiated ECs together with other BM cell types. Data for Lepr+ and NG2+ cells were previously published (Asada et al., 2017). (C) Sample distance analysis of different BM cell types, as indicated. (D and E) PCA plot (D) and sample distance analysis (E) of ctrl ECs and ECs at 1 day or 7 days after irradiation. (F–H) MA plot showing differentially expressed genes (red dots) between Ctrl ECs and ECs at 7 days after irradiation (9 Gy) (F), Ctrl ECs and ECs at 1 day after irradiation (G), and ECs at 1 and 7 days after irradiation (H), as indicated. (I) Heatmap of selected HSC niche-related genes after irradiation. See also Figure S2.
Figure 3
Figure 3
Diphtheria Toxin-Mediated Hematopoietic Cell Ablation Mimics Irradiation-Induced Vascular Defects (A) FACS plot of LSK cells 4 days after diphtheria toxin injection in DTRiΔHC and control mice. (B) Tile scan overview images of Emcn-stained vessels in DTA-treated control and DTRiΔHC long bone. (C) High-magnification images showing Emcn, CD31, and collagen IV immunostaining in DTRiΔHC and control femur. (D) Tile scan images showing extravasation of fluorescent Dextran in DTRiΔHC and control long bone. (E) Cdh5-mTnG–controlled GFP+ EC nuclei and Emcn staining in DTRiΔHC and control diaphysis. (F) Quantification of LSK cell number (Ctrl = 4, DTRiΔHC= 5), Emcn+ area (Ctrl = 7, DTRiΔHC= 7), Dextran+ area (Ctrl = 4, DTRiΔHC= 3), and GFP+ cells per image (Ctrl = 7, DTRiΔHC= 7, frequency of GFP+ cells by FACS (Ctrl = 11, DTRiΔHC= 8). (G) Representative images and quantification of Emcn+ area at 16 days after irradiation and transplantation of 4 × 105 Lin or Lin+ cells (n = 4 in each group) (H) Emcn, GFP+ EC nuclei, CD31, and collagen IV at 16 days after irradiation and transplantation of 2 × 104 Lin or LSK cells. Quantification of Emcn area (LSK = 10, Lin = 9) and GFP+ EC nuclei in each image field (LSK = 9, Lin = 8). (I) Tile scan overview images showing Dextran extravasation at 16 days after irradiation and transplantation of 2 × 104 Lin or LSK cells. Quantification of Dextran+ area (LSK = 5, Lin = 5). Error bars, mean ± SEM. p values, two-tailed unpaired Student’s t test. See also Figure S3.
Figure 4
Figure 4
Identification of Apln+ ECs in Adult BM (A) Confocal tile scan images (left) showing distribution of GFP+ cells in Apln-mTmG mice. High magnifications (right) show enlarged regions of the metaphysis and diaphysis. Arrows mark GFP+ cells in endosteum. (B and C) Emcn and CD31 (B) and VEGFR2 and VEGFR3 (C) staining in adult Apln-mTmG femur. Arrows mark GFP+ ECs. (D) FACS plots of GFP+ cells isolated from Apln-mTmG mice. (E) Histogram of Emcn expression in GFP and GFP+ cells. Quantification of mean fluorescence intensity (MFI) in GFP and GFP+ cells (n = 3 per group). Error bars, mean ± SEM. p values, two-tailed unpaired Students’ t test. (F) CD150+ Lin CD48 HSC (arrow) and GFP+ EC in the metaphysis and metaphysis-diaphysis transition area of Apln-mTmG mice. (G) Distribution of distance between DAPI+ cells (n = 3,872) or CD150+ Lin CD48 HSCs (n = 52) and GFP+ ECs cells in the metaphysis and metaphysis-diaphysis transition area of Apln-mTmG mice. (H) PCA plot of total BM cells (BMC), Apln+ ECs (from whole bone), and diaphyseal ECs (DP ECs). (I) MA plot showing differentially expressed genes between Apln+ ECs and DP ECs. (J) Top 15 enriched pathways in GO analysis in Apln+ ECs relative to DP ECs. (K) Heatmap of selected genes in Apln+ ECs. See also Figure S4.
Figure 5
Figure 5
Apln+ ECs Regulate HSC Maintenance and Steady-State Hematopoiesis (A) FACS plot of LSK cells and HSCs in control and DTAiΔApln mice. Numbers in boxes represent the percentage of the cell population among all BM cells. (B) Quantification of the number and percentage of LSK cells, HSCs, and oligopotent progenitor cells in control (n = 10) and DTAiΔApln (n = 10) mice. CLP, common lymphoid progenitor; CMP, common myeloid progenitor. (C) Quantitative distribution of distance between CD150+CD48-Lin HSCs and vessels in whole BM of control (n = 40 HSC from 4 mice) and DTAiΔApln mice (n = 40 HSC from 5 mice). (D) Long-term competitive repopulation assay showing donor-derived (CD45.2, control = 11 and DTAiΔApln = 14) myeloid cells, B cells, and T cells. (E) Percentage of BM HSCs in control (n = 10) and KitliΔApln mice (n = 10). (F) Long-term competitive repopulation assay showing donor-derived (CD45.2, control = 9 and KitliΔApln = 12) myeloid cells, B cells, and T cells. (G) Percentage of BM HSCs in control (n = 11) and Vegfr2iΔApln mice (n = 11). (H) Long-term competitive repopulating assay showing donor-derived (CD45.2, control = 12 and Vegfr2iΔApln = 9) myeloid cells, B cells, and T cells. Error bars, mean ± SEM. p values, two-tailed unpaired Student’s t test. See also Figure S5.
Figure 6
Figure 6
Apln+ ECs Are Necessary for BM Transplantation (A) Transplantation of cells from Vav1-Cre R26-mTmG mice into Ctrl and DTAiΔApln hosts. (B) Tile scan overview images and selected maximum intensity projections of control and DTAiΔApln bone 5 days after irradiation and transplantation with 3 × 105Vav1-Cre R26-mTmG Lin cells. Arrows indicate donor-derived GFP+ cells. (C) FACS plots of GFP+ cells from control and DTAiΔApln host BM. (D) Quantification of GFP+, GFP+CD45+, GFP+Ter119+, and GFP+CD11b+ cells in control (n = 5) and DTAiΔApln (n = 6) host BM. (E) Tile scan overview images and selected maximum intensity projections showing lineage tracing of GFP+ cells in Apln-mTmG long bone with or without irradiation and transplantation. Arrows mark GFP+ Emcn+ ECs. Quantification of GFP+ area relative to Emcn+ area in diaphysis (n = 4 in each group). (F) Quantitative analysis of transplantation efficiency in DTAiΔEsm1 mice at 5 days after irradiation and transplantation of 105 Lin cells from Vav1-mTmG mice (Ctrl = 8; DTAiΔEsm1 = 5). (G) Lineage tracing of GFP+ cells in Esm1-CreER R26-mTmG mice with the same protocol as in (E). Quantification of GFP+ area relative to Emcn+ area in diaphysis (Ctrl = 4; 9 Gy = 5). (H) PCA plot of Apln+ ECs, Esm1+ ECs, and total DP ECs under steady state. (I and J) MA plot showing genes with differential expression between Esm1+ ECs and Apln+ ECs (I) and between Esm1+ ECs and total DP ECs (J). (K and L) Heatmap showing expression of selected angiocrine or niche-related genes in Apln+ ECs relative to Esm1+ ECs (K), and in Esm1+ ECs relative to total DP ECs (L). Error bars, mean ± SEM. p values, two-tailed unpaired Student’s t test. See also Figure S6.
Figure 7
Figure 7
Crosstalk of HSPC with Apln+ ECs in BM Vascular Regeneration and Hematopoietic Reconstitution (A) Diagram depicting the transplantation of wild-type Lin cells into Ctrl and Vegfr2iΔApln host mice. (B) Bone vessels at 2.5 weeks after transplantation in control or Vegfr2iΔApln host mice. Quantification of Emcn+ area, percentage of LSK cells, number of BMNCs, B220+, CD11b+, and CD8+ cells in control (n = 10–11) and Vegfr2iΔApln (n = 11) host mice. (C) Scheme depicting VEGF-A treatment in combination with transplantation of wild-type Lin cells. (D) Survival curve of irradiated mice transplanted with 104 Lin cells and intravenous injection of PBS (vehicle; n = 35) or recombinant VEGF-A (n = 20). (E) Bone vessels at 3 weeks after irradiation and treatment with vehicle (PBS + Lin cells) or VEGF-A (VEGF-A + Lin cells). Quantification of Emcn+ area, percentage of LSK cells, number of BMNCs, B220+, CD11b+, and CD8+ cells in vehicle (n = 12–14) and VEGF-A (n = 11)-treated mice. (F) Secondary long-term competitive repopulating assay with donor-derived CD45.2 cells from 1st transplant of vehicle or VEGF-A-treated recipients. Graphs show percentage of CD45.2 donor-derived myeloid cells, B cells, and T cells (vehicle = 5, VEGF-A = 7). (G) Confocal tile scan overview and high-magnification images of GFP and Emcn signals in the Apln-mTmG diaphysis after infusion of vehicle or VEGF-A. Quantification of GFP+ cell relative to Emcn+ (vehicle = 3, VEGF-A = 3). (H) Apln transcripts in cultured bEnd.3 cells. Actb was used as control (vehicle = 11, VEGF-A = 11). (I) Quantification of CFU-GM number, CD45% and CD11b% in methylcellulose assays (700 Lin HSPC were seeded). Vehicle (n = 8) or VEGF-A (4 μg/ml; n = 8) were added to standard culture medium. Error bars, mean ± SEM. p values, two-tailed unpaired Student’s t test. See also Figure S7.

Comment in

  • Mutualism in the Marrow.
    Chute JP, Termini CM. Chute JP, et al. Cell Stem Cell. 2019 Dec 5;25(6):731-733. doi: 10.1016/j.stem.2019.11.007. Cell Stem Cell. 2019. PMID: 31809734

Similar articles

Cited by

References

    1. Aguirre A., Blázquez-Prieto J., Amado-Rodriguez L., López-Alonso I., Batalla-Solís E., González-López A., Sánchez-Pérez M., Mayoral-Garcia C., Gutiérrez-Fernández A., Albaiceta G.M. Matrix metalloproteinase-14 triggers an anti-inflammatory proteolytic cascade in endotoxemia. J. Mol. Med. (Berl.) 2017;95:487–497. - PubMed
    1. Asada N., Kunisaki Y., Pierce H., Wang Z., Fernandez N.F., Birbrair A., Ma’ayan A., Frenette P.S. Differential cytokine contributions of perivascular haematopoietic stem cell niches. Nat. Cell Biol. 2017;19:214–223. - PMC - PubMed
    1. Ballen K.K., Gluckman E., Broxmeyer H.E. Umbilical cord blood transplantation: the first 25 years and beyond. Blood. 2013;122:491–498. - PMC - PubMed
    1. Baryawno N., Przybylski D., Kowalczyk M.S., Kfoury Y., Severe N., Gustafsson K., Kokkaliaris K.D., Mercier F., Tabaka M., Hofree M. A Cellular Taxonomy of the Bone Marrow Stroma in Homeostasis and Leukemia. Cell. 2019;177:1915–1932. - PMC - PubMed
    1. Bougaki M., Searles R.J., Kida K., Yu J., Buys E.S., Ichinose F. Nos3 protects against systemic inflammation and myocardial dysfunction in murine polymicrobial sepsis. Shock. 2010;34:281–290. - PMC - PubMed

MeSH terms

Substances