

A Parsimonious Host Inflammatory Biomarker Signature Predicts Incident Tuberculosis and Mortality in Advanced Human Immunodeficiency Virus
- PMID: 31761933
- PMCID: PMC7744990
- DOI: 10.1093/cid/ciz1147
A Parsimonious Host Inflammatory Biomarker Signature Predicts Incident Tuberculosis and Mortality in Advanced Human Immunodeficiency Virus
Abstract
Background: People with advanced human immunodeficiency virus (HIV) (CD4 < 50) remain at high risk of tuberculosis (TB) or death despite the initiation of antiretroviral therapy (ART). We aimed to identify immunological profiles that were most predictive of incident TB disease and death.
Methods: The REMEMBER randomized clinical trial enrolled 850 participants with HIV (CD4 < 50 cells/µL) at ART initiation to receive either empiric TB treatment or isoniazid preventive therapy (IPT). A case-cohort study (n = 257) stratified by country and treatment arm was performed. Cases were defined as incident TB or all-cause death within 48 weeks after ART initiation. Using multiplexed immunoassay panels and ELISA, 26 biomarkers were assessed in plasma.
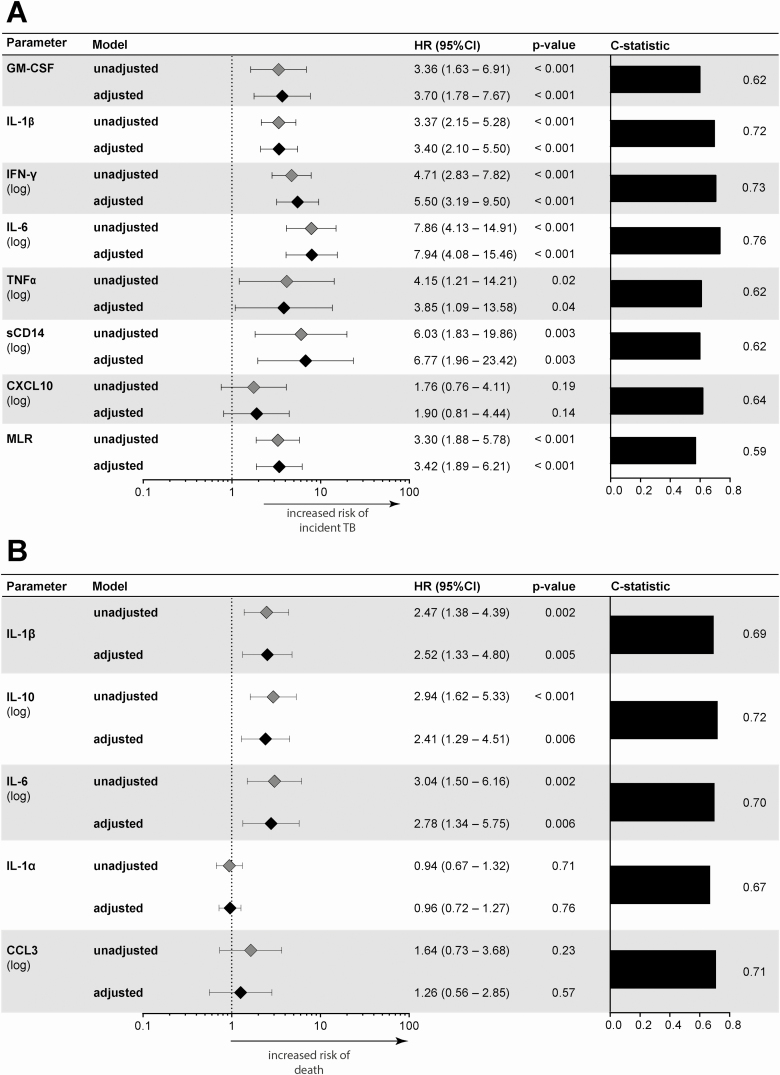
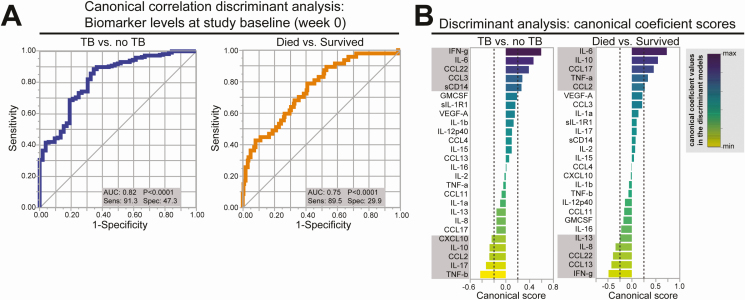
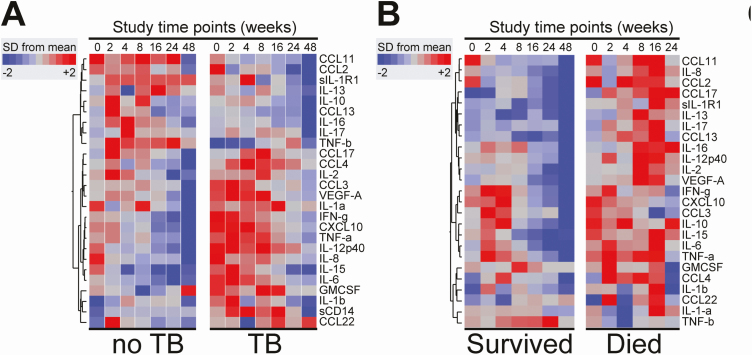
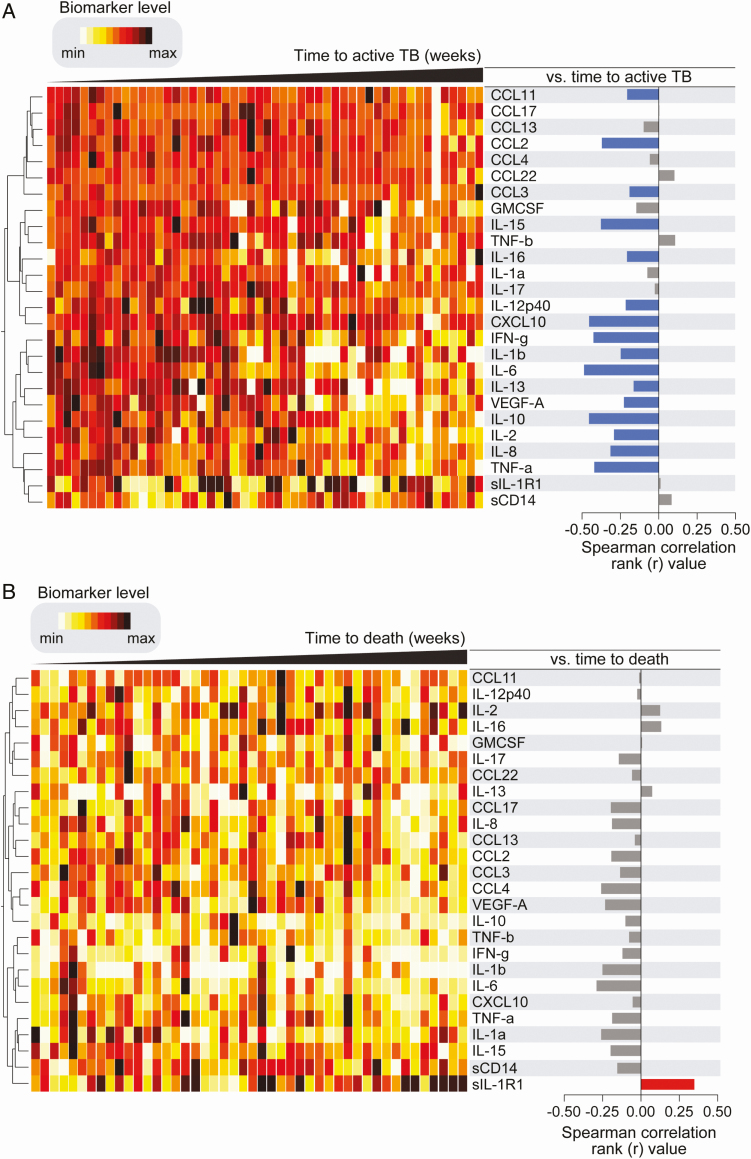
Results: In total, 52 (6.1%) of 850 participants developed TB; 47 (5.5%) died (13 of whom had antecedent TB). Biomarkers associated with incident TB overlapped with those associated with death (interleukin [IL]-1β, IL-6). Biomarker levels declined over time in individuals with incident TB while remaining persistently elevated in those who died. Dividing the cohort into development and validation sets, the final model of 6 biomarkers (CXCL10, IL-1β, IL-10, sCD14, tumor necrosis factor [TNF]-α, and TNF-β) achieved a sensitivity of 0.90 (95% confidence interval [CI]: .87-.94) and a specificity of 0.71(95% CI: .68-.75) with an area under the curve (AUC) of 0.81 (95% CI: .78-.83) for incident TB.
Conclusion: Among people with advanced HIV, a parsimonious inflammatory biomarker signature predicted those at highest risk for developing TB despite initiation of ART and TB preventive therapies. The signature may be a promising stratification tool to select patients who may benefit from increased monitoring and novel interventions.
Clinical trials registration: NCT01380080.
Keywords: antiretroviral therapy; biomarker; early mortality; tuberculosis.
© The Author(s) 2019. Published by Oxford University Press for the Infectious Diseases Society of America. All rights reserved. For permissions, e-mail: journals.permissions@oup.com.
Figures
References
-
- WHO. Global Tuberculosis report 2018. World Health Organization, 2018. Available at: http://www.who.int/tb/publications/global_report/en/. Accessed 8 December 2019.
-
- Castelnuovo B, Manabe YC, Kiragga A, Kamya M, Easterbrook P, Kambugu A. Cause-specific mortality and the contribution of immune reconstitution inflammatory syndrome in the first 3 years after antiretroviral therapy initiation in an urban African cohort. Clin Infect Dis 2009; 49:965–72. - PubMed
-
- Moore D, Liechty C, Ekwaru P, et al. . Prevalence, incidence and mortality associated with tuberculosis in HIV-infected patients initiating antiretroviral therapy in rural Uganda. AIDS 2007; 21:713–9. - PubMed
-
- Badje A, Moh R, Gabillard D, et al. ; Temprano ANRS 12136 Study Group Effect of isoniazid preventive therapy on risk of death in west African, HIV-infected adults with high CD4 cell counts: long-term follow-up of the Temprano ANRS 12136 trial. Lancet Glob Health 2017; 5:e1080–9. - PubMed
Publication types
MeSH terms
Substances
Associated data
Grants and funding
LinkOut - more resources
Full Text Sources
Medical
Research Materials
