. 2019 Oct 15;10(24):6014-6024.
doi: 10.7150/jca.35017. eCollection 2019.

Suppression of non-small cell lung cancer migration and invasion by hsa-miR-486-5p via the TGF-β/SMAD2 signaling pathway

Affiliations

Suppression of non-small cell lung cancer migration and invasion by hsa-miR-486-5p via the TGF-β/SMAD2 signaling pathway

Tao Chen et al. J Cancer. .

Abstract

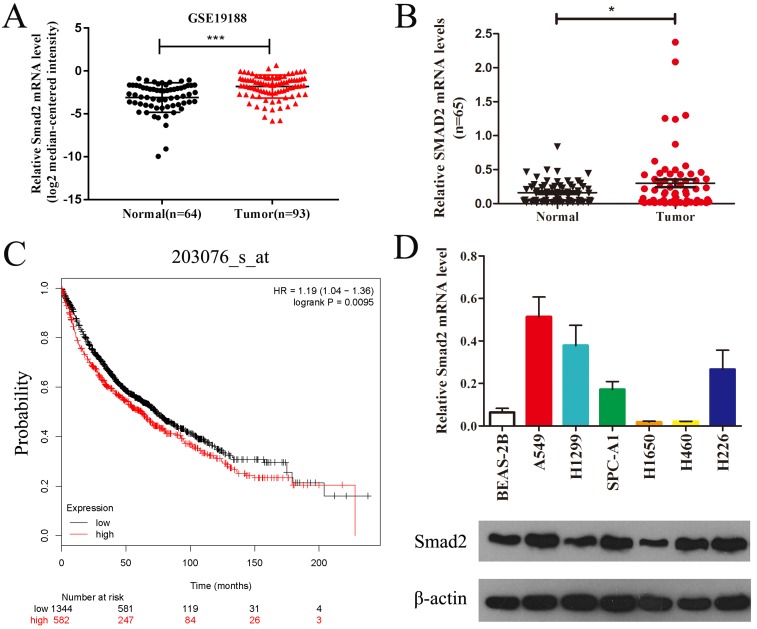
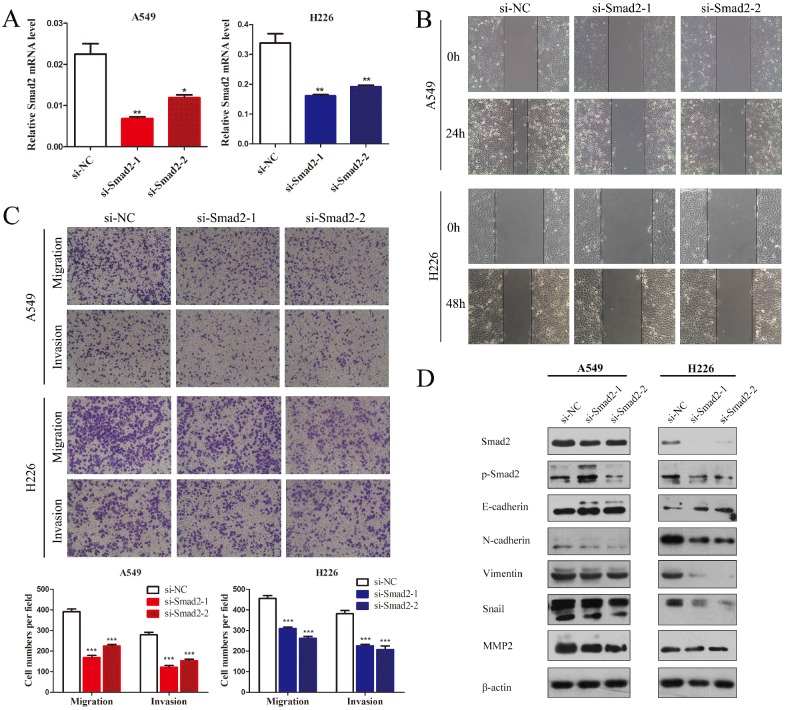
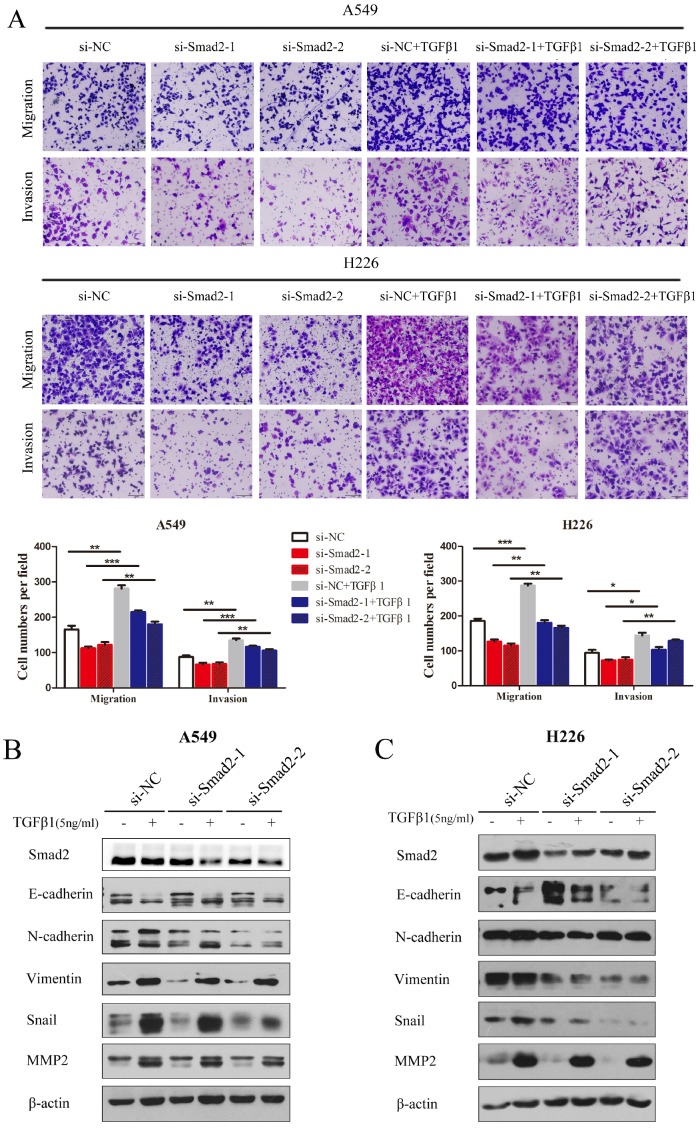
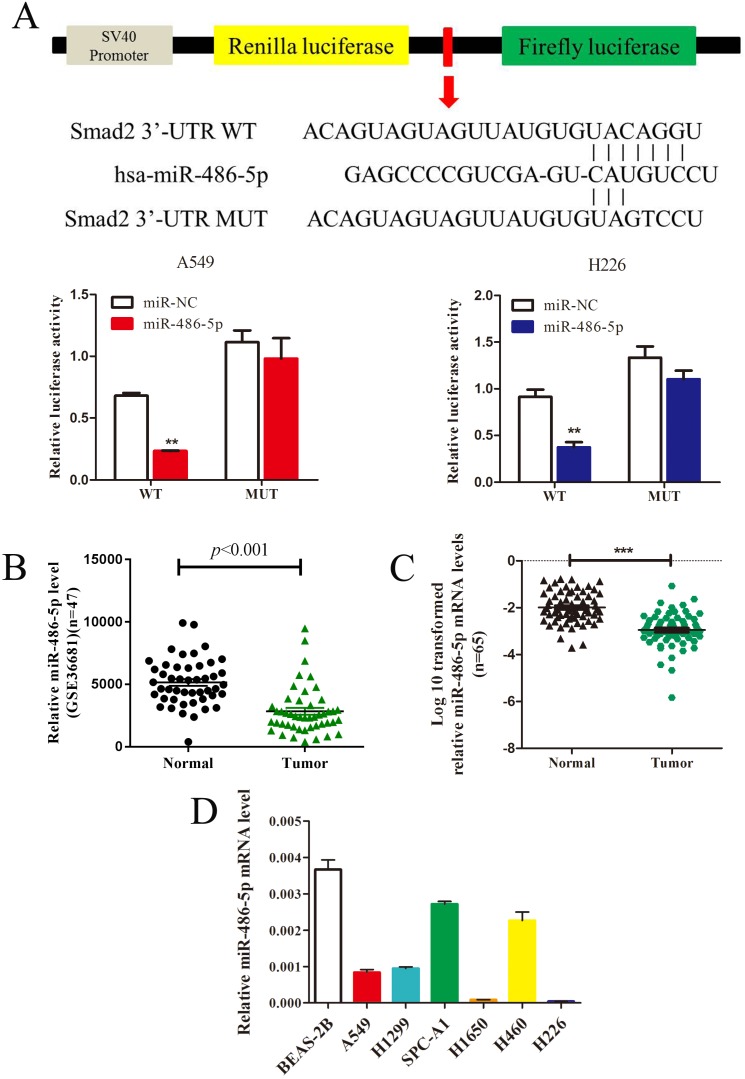
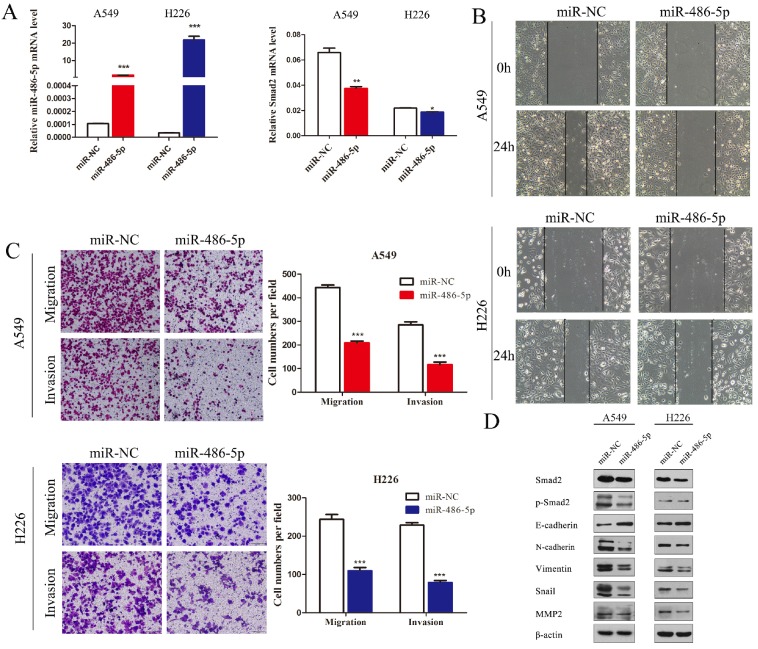
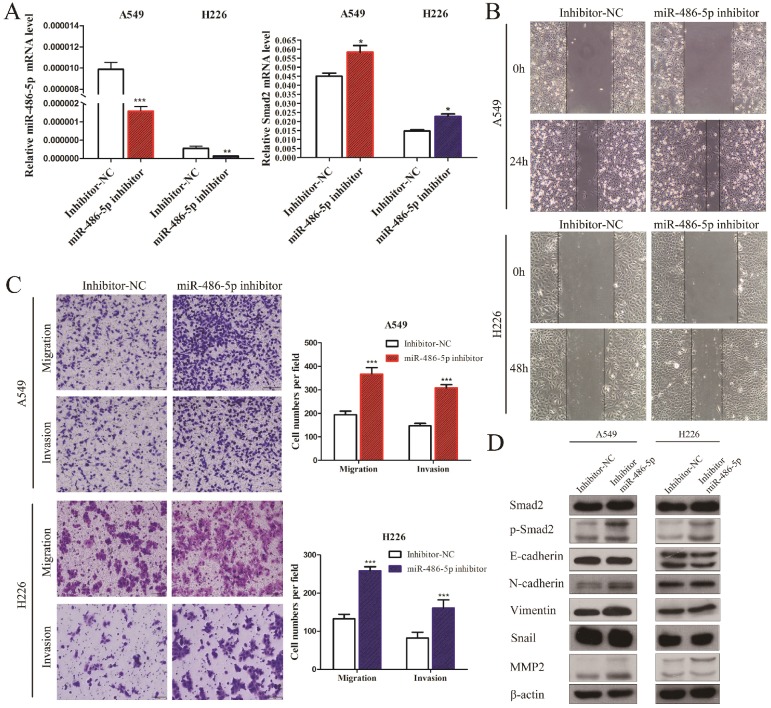
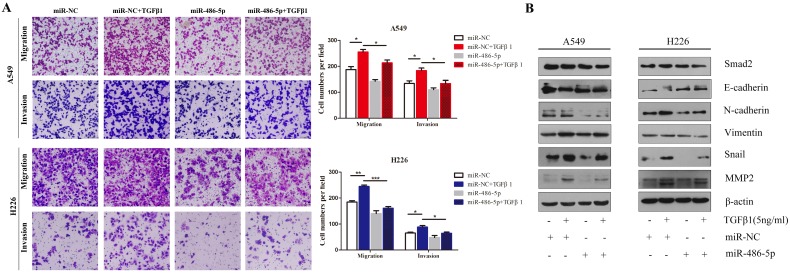
Non-small cell lung cancer (NSCLC) is the leading cause of cancer-related death worldwide. SMAD family member 2 (SMAD2) is a key element downstream of the transforming growth factor beta (TGF-β) signaling pathway that regulates cancer metastasis by promoting the epithelial-mesenchyme transition (EMT). MicroRNA miR-486-5p is a tumor suppressor in NSCLC progression. However, it remains unclear whether miR-486-5p is implicated in TGF-β signaling and EMT in NSCLC. In the present study, high expression of SMAD2 mRNA was detected in NSCLC tissues and cell lines, and was associated with poor survival of patients with NSCLC. By contrast, miR-486-5p was downregulated in NSCLC tissues and cell lines. In silico prediction showed that SMAD2 was a potential target of miR-486-5p. The prediction was verified using a dual-luciferase reporter assay. Transwell assays showed that knockdown of SMAD2 inhibited TGF-β-induced EMT and migration and invasion in NSCLC cells. Similarly, miR-486-5p overexpression suppressed TGF-β-induced EMT and migration and invasion of NSCLC cells. The present study provides a new insight into the role of miR-486-5p in regulating TGF-β-mediated EMT and invasion in NSCLC.


Conflict of interest statement

Competing Interests: The authors have declared that no competing interest exists.

Figures

Figure 1
Figure 1
SMAD2 is upregulated in NSCLC tissues and cell lines. (A) Data obtained from GEO (GSE19188) were analyzed to compare the expression difference of SMAD2 between NSCLC tissues and noncancerous lung tissues. (B) The mRNA expression levels of SMAD2 were determined by qRT-PCR, and the data were compared between 65 NSCLC and paired adjacent noncancerous lung tissues.(C) The relationship between the expression levels of SMAD2 and overall survival for 1926 NSCLC patients were analyzed, and Kaplan-Meier plots were generated using the Kaplan-Meier Plotter (http://www.kmplot.com).(D) Total RNA and protein were extracted from several cell lines, and the levels of SMAD2 mRNA and protein were detected by qRT-PCR and western blotting assay, respectively. β-actin was used as an internal control. Data are shown as the mean ± SE. *, **, and *** indicate significant differences compared with the control (* P<0.05; ** P < 0.01; ***P<0.001).
Figure 2
Figure 2
Knockdown of SMAD2 inhibits cell EMT and the migration and invasion of NSCLC cells. (A) Si-RNAs against SMAD2 were transfected into A549 (left) and H226 (right) cells for 48 h. The cells were subjected to determination of SMAD2 mRNA expression using qRT-PCR. (B) A uniform scratch was made in each confluent monolayer of A549 (upper) cells and H226 (bottom) cells transfected with siRNAs for SMAD2. Images were acquired at 0 h and 24 h post scratching under a microscope. (C) A549 and H226 cells knocked down for SMAD2 were allowed to migrate through an 8-µm pore in a Transwell apparatus. Migrated cells were stained and counted in at least three microscopic fields 24 h later. One representative image (upper) is shown, and the number of migrated cells was compared between groups of SMAD2-silenced and negative control (bottom). After transfection with SMAD2 siRNAs for 48 h, A549 and H226 cells were subjected to western blotting to determine the expression of various proteins. β -actin was used as an internal control. Data are shown as the mean ± SD. *, **, and *** indicate significant differences compared with the control (* P < 0.05; ** P < 0.01; ***P < 0.001).
Figure 3
Figure 3
Knockdown of SMAD2 represses TGF-β-induced EMT, and migration and invasion in NSCLC cells. (A) In the presence or absence of TGF-β1 (5 ng/mL), A549 and H226 cells knocked down for SMAD2 were allowed to migrate through an 8-µm pore in a Transwell apparatus. One day later, migrated cells were stained and counted in at least three microscopic fields. One representative image (upper) is shown, and the number of migrated cells was compared between groups of si-SMAD2 and si-NC in the presence of TGF-β1 (bottom).(B and C) A549 (B) and H226 (C) cells transfected with siRNAs for SMAD2 or si-NC were treated with TGF-β1 (5 ng/mL) for 24 h, and then the expression of various proteins were determined by western blotting. β-actin was used as an internal control. Data are shown as the mean ± SD. *, **, and *** indicate significant differences compared with the control (* P < 0.05; ** P < 0.01; ***P < 0.001).
Figure 4
Figure 4
MiR-486-5p inhibits SMAD2 expression via binding to its 3' UTR and is downregulated in NSCLC tissues and cell lines. (A) Schematic diagram showing the subcloning of the predicted miR-486-5p-binding site at position 304-310 of the SMAD2 3' UTR into a psiCHECK-2 luciferase construct. Predicted duplex formation between miR-486-5p and the wild-type or mutant miR-486-5p-binding site is indicated (upper). Luciferase activity of the construct containing the wild-type or mutant SMAD2 reporter gene in A549 (bottom, left) and H226 (bottom, right) cells co-transfected with the negative control (miR-NC) or miR-486-5p. Scrambled sequences were used as the NC. Relative Renilla luciferase activity was determined and normalized against firefly luciferase activity. (B) Data obtained from the GEO database (GSE36681) were analyzed to compare the expression of miR-486-5p between NSCLC tissues and noncancerous lung tissues. (C) The mRNA expression levels of miR-486-5p were determined using qRT-PCR, and the data were compared between 65 NSCLC and paired adjacent noncancerous lung tissues. (D) qRT-PCR analysis of relative miR-486-5p expression in human NSCLC cell lines. Data are shown as the mean ± SD. *, **, and *** indicate significant differences compared with the control (* P < 0.05; ** P < 0.01; ***P < 0.001).
Figure 5
Figure 5
MiR-486-5p represses SMAD2 expression, and the migration and invasion abilities of NSCLC cells. (A) miR-486-5p mimics were transfected into A549 and H226 cells for 48 h. The expression levels of miR-486-5p (left) and SMAD2 mRNA (right) were determined in the cells using qRT-PCR assay. (B) A uniform scratch was made in each confluent monolayer of A549 (upper) cells and H226 (bottom) cells transfected with miR-486-5p or miR-NC. Images were acquired at 0 h and 24 h post scratching under a microscope. (C) A549 and H226 cells transfected with miR-486-5p or miR-NC were allowed to migrate through an 8-µm pore in a Transwell apparatus. Migrated cells were stained and counted in at least three microscopic fields 24 h later. One representative image (left) is shown, and the number of migrated cells was compared between the miR-486-5p and miR-NC groups (right). After transfection with miR-486-5p for 48 h, A549 and H226 cells were subjected to western blotting to determine the expression of various proteins. β-actin was used as an internal control. Data are shown as the mean ± SD. *, **, and *** indicate significant differences compared with the control (* P < 0.05; ** P < 0.01; ***P < 0.001).
Figure 6
Figure 6
MiR-486-5p inhibitor enhances SMAD2 expression, and the capability of migration and invasion of NSCLC cells. (A) The miR-486-5p inhibitor mimics or negative control (inhibitor-NC) were transfected into A549 and H226 cells for 48 h. The expression levels of miR-486-5p (left) and SMAD2 mRNA (right) were then determined using qRT-PCR. (B) A uniform scratch was made in confluent monolayers of A549 (upper) cells and H226 (bottom) cells the transfected of the miR-486-5p inhibitor or inhibitor-NC. Images were acquired at 0 h and 24 h post scratching under a microscope. (C) A549 and H226 cells transfected with the miR-486-5p inhibitor or inhibitor-NC were allowed to migrate through an 8-µm pore in a Transwell apparatus. Migrated cells were stained and counted in at least three microscopic fields 24 h later. One representative image (left) is shown, and the number of migrated cells was compared between the miR-486-5p inhibitor and inhibitor-NC groups (right). After transfection with the miR-486-5p inhibitor for 48 h, A549 and H226 cells were subjected to western blotting to determine the expression of various proteins. β-actin was used as an internal control. Data are shown as the mean ± SD. *, **, and *** indicate significant differences compared with the control (* P < 0.05; ** P < 0.01; ***P < 0.001).
Figure 7
Figure 7
MiR-486-5p inhibits TGF-β-induced cell EMT, and migration and invasion in NSCLC cells. (A) In the presence or absence of TGF-β1 (5 ng/mL), A549 and H226 cells transfected with miR-486-5p were allowed to migrate through an 8-µm pore in a Transwell apparatus. One day later, migrated cells were stained and counted in at least three microscopic fields. One representative image (upper) is shown, and the number of migrated cells was compared between the miR-486-5p and miR-NC groups in the presence of TGF-β1 (bottom). (B and C) A549 (B) and H226 (C) cells transfected with miR-486-5p or miR-NC were treated with TGF-β1 (5 ng/mL) for 24 h, and then the expression of various proteins was determined by western blotting. β-actin was used as an internal control. Data are shown as the mean ± SD. *, **, and *** indicate significant differences compared with the control (* P < 0.05; ** P < 0.01; ***P < 0.001).

Similar articles

Cited by

References

    1. Li JJ, Li R, Wang W, Zhang B, Song X, Zhang C. et al. IDH2 is a novel diagnostic and prognostic serum biomarker for non-small-cell lung cancer. Molecular oncology. 2018;12:602–10. - PMC - PubMed
    1. Alidousty C, Baar T, Heydt C, Wagener-Ryczek S, Kron A, Wolf J. et al. Advance of theragnosis biomarkers in lung cancer: from clinical to molecular pathology and biology. Journal of thoracic disease. 2019;11:S3–S8. - PMC - PubMed
    1. Yu M, Chen Y, Li X, Yang R, Zhang L, Huangfu L. et al. YAP1 contributes to NSCLC invasion and migration by promoting Slug transcription via the transcription co-factor TEAD. Cell death & disease. 2018;9:464. - PMC - PubMed
    1. Li Z, Zhang Y, Jin T, Men J, Lin Z, Qi P. et al. NQO1 protein expression predicts poor prognosis of non-small cell lung cancers. BMC cancer. 2015;15:207. - PMC - PubMed
    1. Wrzesinski SH, Wan YY, Flavell RA. Transforming growth factor-beta and the immune response: implications for anticancer therapy. Clinical cancer research. 2007;13:5262–70. - PubMed