. 2019 Jul;11(2):210-237.
doi: 10.1007/s12561-018-9227-2. Epub 2019 Jan 12.

Accelerometry data in health research: challenges and opportunities

Affiliations

Accelerometry data in health research: challenges and opportunities

Marta Karas et al. Stat Biosci. 2019 Jul.

Abstract

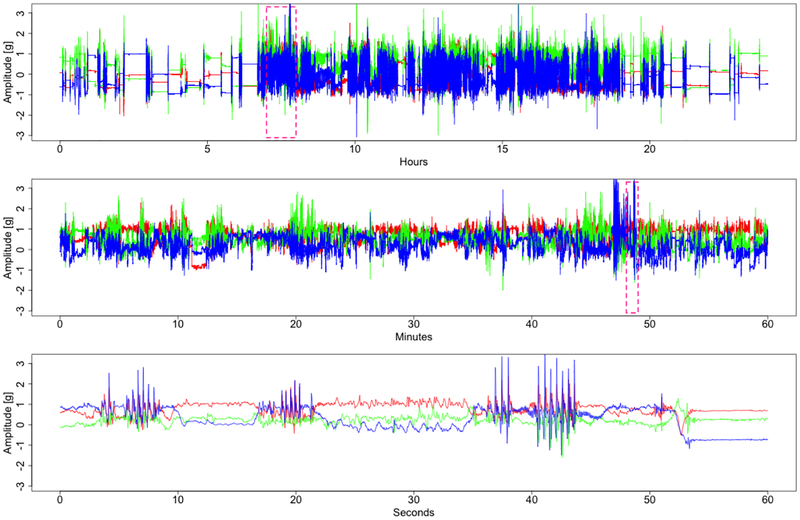
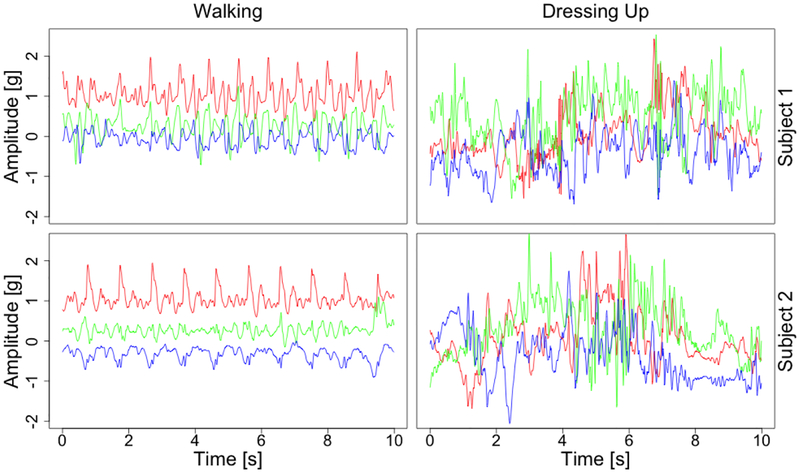
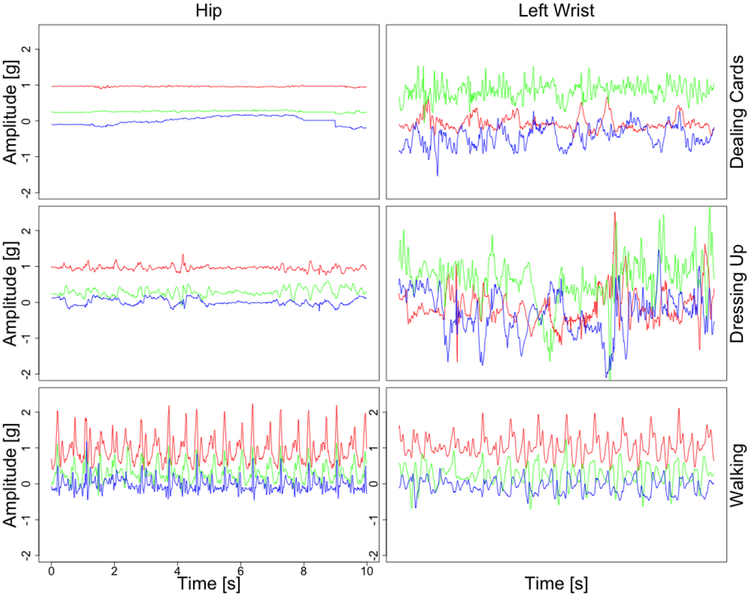
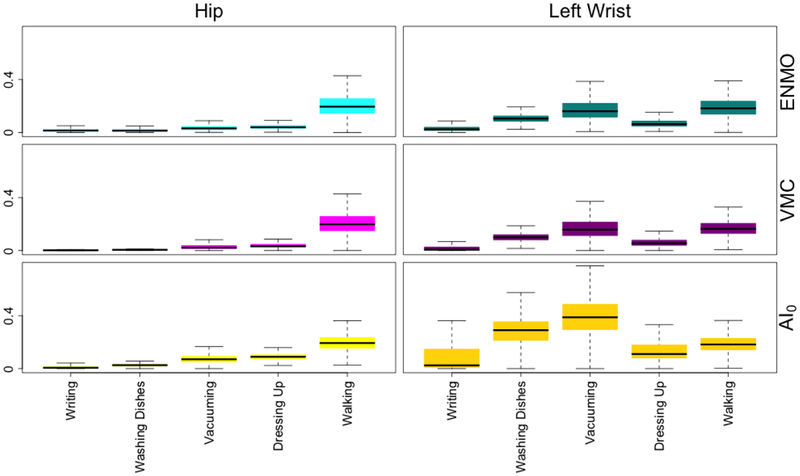
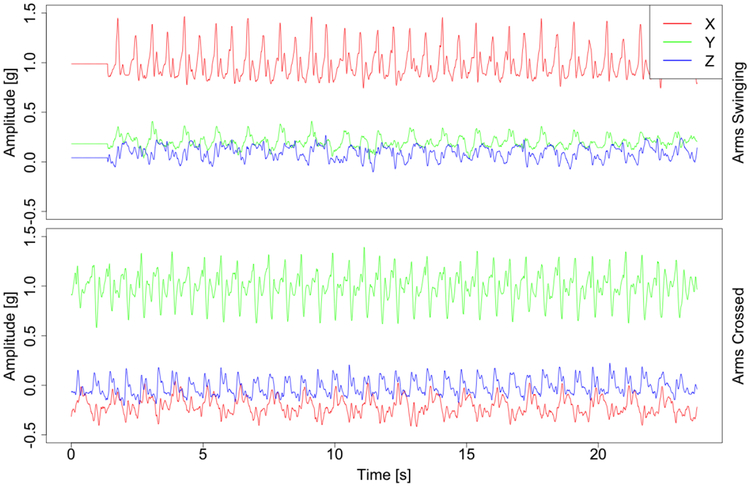
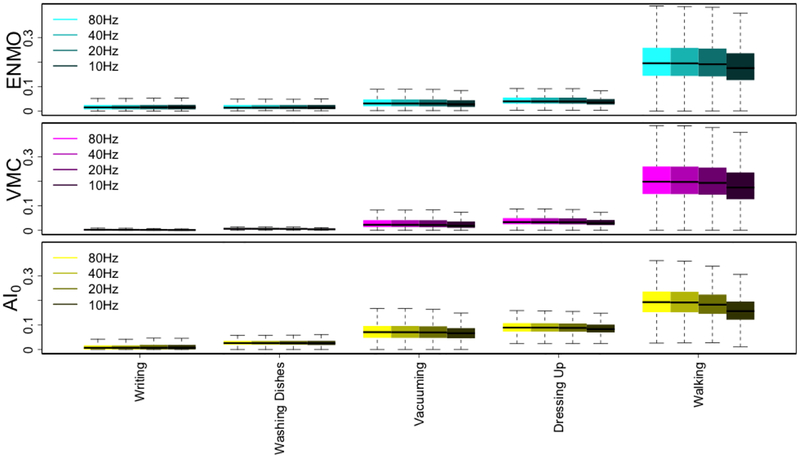
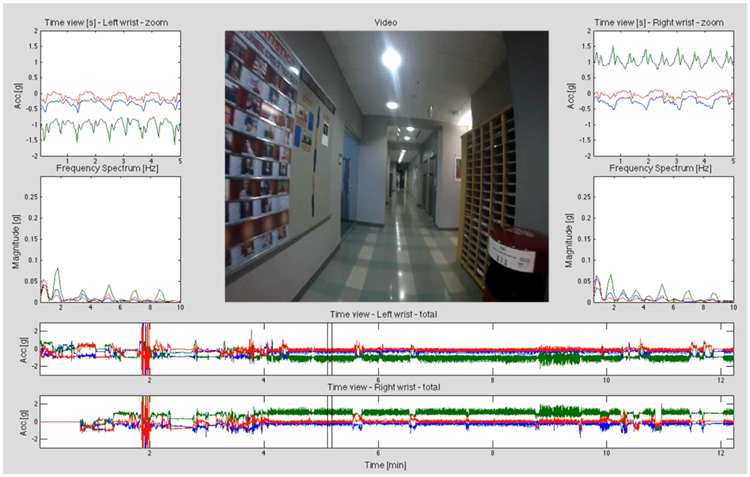
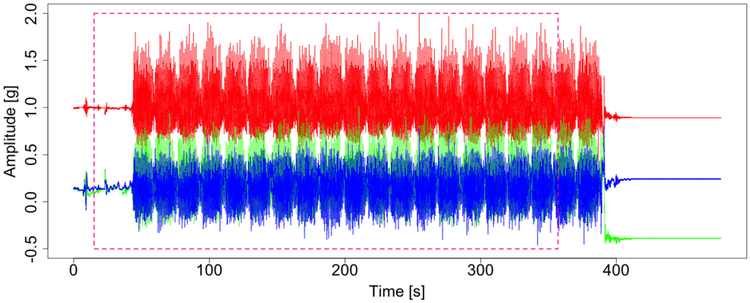
Wearable accelerometers provide detailed, objective, and continuous measurements of physical activity (PA). Recent advances in technology and the decreasing cost of wearable devices led to an explosion in the popularity of wearable technology in health research. An ever-increasing number of studies collect high-throughput, sub-second level raw acceleration data. In this paper, we discuss problems related to the collection and analysis of raw accelerometry data and refer to published solutions. In particular, we describe the size and complexity of the data, the within- and between-subject variability, and the effects of sensor location on the body. We also discuss challenges related to sampling frequency, device calibration, data labeling and multiple PA monitors synchronization. We illustrate these points using the Developmental Epidemiological Cohort Study (DECOS), which collected raw accelerometry data on individuals both in a controlled and the free-living environment.

Keywords: Accelerometers; Accelerometry; Physical activity; Wearable accelerometers; Wearable computing.


Figures

Figure 1
Figure 1
Accelerometry data from three orthogonal axes of an accelerometer located on the left wrist. Each axis data is shown in a different color. The top panel displays 24 h of data collected between 12 a.m. and 12 a.m. The middle panel displays a 1-h interval from 8:40 a.m. to 9:40 a.m. (indicated in the top panel as a dashed-line rectangle). The bottom panel displays a 1-min interval from 8:51 a.m. to 8:52 a.m. marked as a dashed-line rectangle in the middle panel. The signal was acquired at a sampling frequency of fs = 80Hz.
Figure 2
Figure 2
Data recorded by an accelerometer located on the left wrist while walking (left column) and getting dressed (right column), for two individuals (top and bottom row). Each axis is shown in a different color.
Figure 3
Figure 3
Accelerometry data from three orthogonal axes of an accelerometer located on the hip (left column) and left wrist (right column), while dealing cards (top row), getting dressed (middle row) and walking (bottom row). Each axis data are shown in a different color.
Figure 4
Figure 4
Boxplots of ENMO, (top panels) VMC (middle panels) and AI0 (bottom panels) statistics derived for τ = 5-s length intervals of data collected from the hip (left column) and left wrist (right column) during writing, washing dishes, vacuuming, getting dressed and walking (x-axis), for all 49 individuals.
Figure 5
Figure 5
Accelerometry data from three orthogonal axes of an accelerometer located on the left wrist, collected during two walking tasks performed by the same individual. Each axis data is shown in a different color. The upper panel corresponds to walking with both hands moving naturally, whereas the bottom panel corresponds to walking with arms crossed on the chest.
Figure 6
Figure 6
Boxplots of ENMO, (top panels) VMC (middle panels) and AI0 (bottom panels) for 5 second time windows. Data is shown for all 49 individuals in the study and were collected from the left wrist during writing, washing dishes, vacuuming, getting dressed and walking (x-axis). Data were collected with the original sampling frequency fs = 80 Hz and then decimated to simulate sampling frequencies of 40, 20 and 10 Hz.
Figure 7
Figure 7
View of a software used for labeling of raw accelerometry data synchronized with video recordings from a body-worn camera.
Figure 8
Figure 8
Accelerometry data from three orthogonal axes at the hip collected around the time when a participant performed a 400-meter-walk activity. The dashed-line red box indicates the portion of the 400-meter-walk period identified by a human observer.
Figure 9
Figure 9
Accelerometry data representing 20 s of data collected in the free-living environment using two monitors located on the left wrist (top panels) and the right wrist (bottom panels). The two sensors were synchronized at the beginning of the experiment. The left and right column provide data collected on the first and seventh day of observation, respectively.

References

    1. ActiGraph (2016) What are counts? URL https://actigraph.desk.com/customer/en/portal/articles/2515580-what-are-..., accessed: 2017-11-23
    1. Altini M, Penders J, Vullers R, Amft O (2015) Estimating energy expenditure using body-worn accelerometers: A comparison of methods, sensors number and positioning. IEEE Journal of Biomedical and Health Informatics 19(1):219–226, DOI 10.1109/JBHI.2014.2313039 - DOI - PubMed
    1. Attal F, Mohammed S, Dedabrishvili M, Chamroukhi F, Oukhellou L, Amirat Y (2015) Physical Human Activity Recognition Using Wearable Sensors. Sensors (Basel) 15(12):31, 314–38, DOI 10.3390/sl51229858 - DOI - PMC - PubMed
    1. Bai J, Goldsmith J, Caffo B, Glass TA, Crainiceanu CM (2012) Movelets: A dictionary of movement. Electronic Journal of Statistics 6:559–578, DOI 10.1214/12-EJS684 - DOI - PMC - PubMed
    1. Bai J, He B, Shou H, Zipunnikov V, Glass TA, Crainiceanu CM (2014) Normalization and extraction of interpretable metrics from raw accelerometry data. Biostatistics 15(1): 102–116, DOI 10.1093/biostatistics/kxt029 - DOI - PMC - PubMed

LinkOut - more resources