

SO2 Emission Estimates Using OMI SO2 Retrievals for 2005-2017
- PMID: 31763109
- PMCID: PMC6853235
- DOI: 10.1029/2019JD030243
SO2 Emission Estimates Using OMI SO2 Retrievals for 2005-2017
Abstract
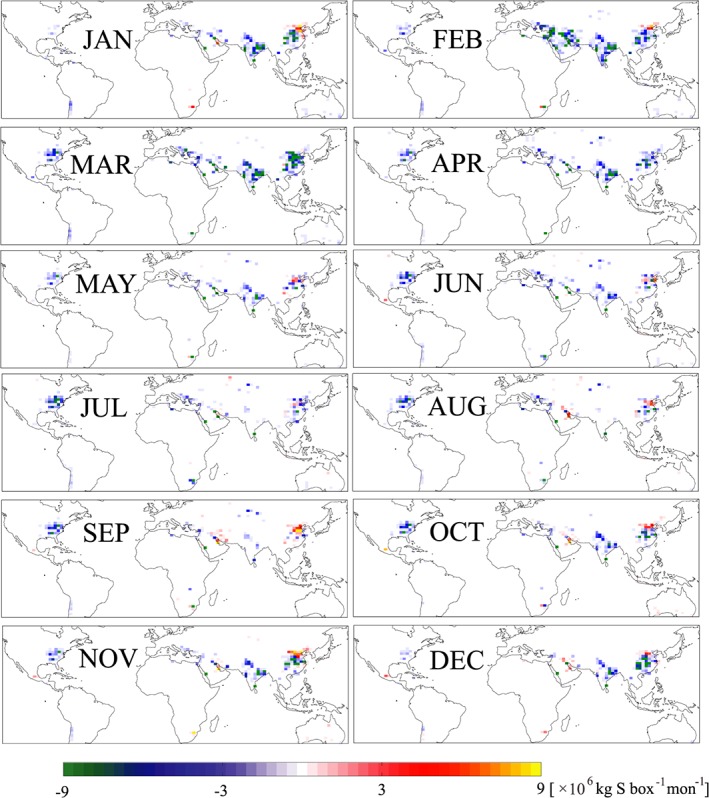
SO2 column densities from Ozone Monitoring Instrument provide important information on emission trends and missing sources, but there are discrepancies between different retrieval products. We employ three Ozone Monitoring Instrument SO2 retrieval products (National Aeronautics and Space Administration (NASA) standard (SP), NASA prototype, and BIRA) to study the magnitude and trend of SO2 emissions. SO2 column densities from these retrievals are most consistent when viewing angles and solar zenith angles are small, suggesting more robust emission estimates in summer and at low latitudes. We then apply a hybrid 4D-Var/mass balance emission inversion to derive monthly SO2 emissions from the NASA SP and BIRA products. Compared to HTAPv2 emissions in 2010, both posterior emission estimates are lower in United States, India, and Southeast China, but show different changes of emissions in North China Plain. The discrepancies between monthly NASA and BIRA posterior emissions in 2010 are less than or equal to 17% in China and 34% in India. SO2 emissions increase from 2005 to 2016 by 35% (NASA)-48% (BIRA) in India, but decrease in China by 23% (NASA)-33% (BIRA) since 2008. Compared to in situ measurements, the posterior GEOS-Chem surface SO2 concentrations have reduced NMB in China, the United States, and India but not in South Korea in 2010. BIRA posteriors have better consistency with the annual growth rate of surface SO2 measurement in China and spatial variability of SO2 concentration in China, South Korea, and India, whereas NASA SP posteriors have better seasonality. These evaluations demonstrate the capability to recover SO2 emissions using Ozone Monitoring Instrument observations.
Keywords: 4D‐Var; data assimilation; inverse modeling; mass balance; satellite observation; top‐down SO2 emission.
©2019. The Authors.
Figures


References
-
- Arndt, R. L. , Carmichael, G. R. , Streets, D. G. , & Bhatti, N. (1997). Sulfur dioxide emissions and sectorial contributions to sulfur deposition in Asia. Atmospheric Environment, 31(10), 1553–1572. 10.1016/S1352-2310(96)00236-1 - DOI
-
- Boersma, K. F. , Vinken, G. C. M. , & Eskes, H. J. (2016). Representativeness errors in comparing chemistry transport and chemistry climate models with satellite UV‐Vis tropospheric column retrievals. Geoscientific Model Development, 9(2), 875–898. 10.5194/gmd-9-875-2016 - DOI
-
- Bousserez, N. , Henze, D. K. , Perkins, A. , Bowman, K. W. , Lee, M. , Liu, J. , Deng, F. , & Jones, D. B. A. (2015). Improved analysis‐error covariance matrix for high‐dimensional variational inversions: Application to source estimation using a 3D atmospheric transport model. Quarterly Journal of the Royal Meteorological Society, 141(690), 1906–1921. 10.1002/qj.2495 - DOI
-
- Burrows, J. P. , Weber, M. , Buchwitz, M. , Rozanov, V. , Ladstätter‐Weißenmayer, A. , Richter, A. , DeBeek, R. , Hoogen, R. , Bramstedt, K. , Eichmann, K. U. , Eisinger, M. , & Perner, D. (1999). The Global Ozone Monitoring Experiment (GOME): Mission concept and first scientific results. Journal of the Atmospheric Sciences, 56(2), 151–175. 10.1175/1520-0469(1999)056<0151:TGOMEG>2.0.CO;2 - DOI
LinkOut - more resources
Full Text Sources