Review
. 2019 Sep 30;6(22):1901358.
doi: 10.1002/advs.201901358. eCollection 2019 Nov.

Recent Progress of Rare-Earth Doped Upconversion Nanoparticles: Synthesis, Optimization, and Applications

Affiliations
Review

Recent Progress of Rare-Earth Doped Upconversion Nanoparticles: Synthesis, Optimization, and Applications

Xiaohui Zhu et al. Adv Sci (Weinh). .

Abstract

Upconversion is a nonlinear optical phenomenon that involves the emission of high-energy photons by sequential absorption of two or more low-energy excitation photons. Due to their excellent physiochemical properties such as deep penetration depth, little damage to samples, and high chemical stability, upconversion nanoparticles (UCNPs) are extensively applied in bioimaging, biosensing, theranostic, and photochemical reactions. Here, recent achievements in the synthesis, optimization, and applications of UCNP-based nanomaterials are reviewed. The state-of-the-art approaches to synthesize UCNPs in the past few years are introduced first, followed by a summary of several strategies to optimize upconversion emissive properties and various applications of UCNPs. Lastly, the challenges and future perspectives of UCNPs are provided as a conclusion.

Keywords: NIR light; optimization; rare earth; synthesis; upconversion.


Conflict of interest statement

The authors declare no conflict of interest.

Figures

Figure 1
Figure 1
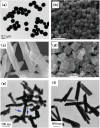
TEM images of β‐NaYF4:Yb, Er UCNPs synthesized at various ratios of OA to ODE of a) 2:19, b) 4:17, c) 6:15, d) 10.5:10.5, e) 15:6, f) 17:4. Reproduced with permission.50 Copyright 2013, Royal Society of Chemistry. g) The four digital condition codes (R, T, F, and RE) represent different reaction conditions where R = 0 and R = 1 represents the low and high ratio of OA/OAH, respectively; T = 0 and T = 1 represents the temperature at 290 and 310 °C, respectively; F = 0 and F = 1 represents the absence and presence of an F ion source, respectively; RE represents the rare‐earth ion source. By combining these different growth processes into a synthesis procedure, NaREF4 nanocrystals with various nanostructures can be obtained, including hourglass shaped NaYF4/NaGdF4/NaNdF4 nanocrystals, NaYF4/NaGdF4/NaNdF4 nanoflowers, NaYF4/NaLuF4 co‐axial nanocylinders, NaYF4/NaLuF4/NaGdF4 nanoscale spins with double rings, and NaYF4/NaGdF4/NaNdF4 nanodumbbells with smooth or sharp ends (scale bar, 50 nm). Reproduced with permission.33 Copyright 2016, Nature Publishing Group.
Figure 2
Figure 2
a) TEM and b) FESEM image of BaYF5 with RE3+/EDTA of a) 1:8 and b) 1:10, respectively. Reproduced with permission.51 Copyright 2011, Royal Society of Chemistry. c,d) FESEM image of NaYF4 using NaF as fluoride source at pH = 3 and pH = 5, respectively. Reproduced with permission.52 Copyright 2015, Elsevier. e,f) TEM image of β‐NaYF4:Yb3+, Er3+ nanocrystals synthesized with 1.00 and 1.25 g NaOH, respectively. Reproduced with permission.53 Copyright 2017, Elsevier.
Figure 3
Figure 3
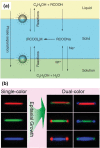
a) Scheme of liquid–solid–solution (LSS) phase transfer synthetic strategy. Reproduced with permission.60 Copyright 2005, Nature Publishing Group. b) Hydrothermal synthesis of dual‐color‐banded β‐NaYF4 microrods with different activators doped at the tips. Reproduced with permission.67 Copyright 2014, American Chemical Society.
Figure 4
Figure 4
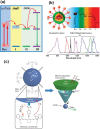
a) Proposed energy‐cascaded upconversion (ECU), involving the use of an organic dye, three types of lanthanide ions, and a core–shell design. Reproduced with permission.72 Copyright 2015, American Chemical Society. b) Schematic illustrations of energy transfer pathway from ICG on the surface of NaYF4:Yb3+/X3+@NaYbF4@NaYF4:Nd3+ nanocrystal, to the Nd3+ ions in the outer shell, then to the Yb3+ in the inner shell, and finally to the Yb3+/X3+ (X = null, Er, Ho, Tm, or Pr) in the core, producing large Stokes‐shifted NIR‐II emissions. Reproduced with permission.73 Copyright 2016, American Chemical Society. c) Cartoon schematic of the dye‐sensitized UCNP system, showing the antenna‐like nature of IR806 in sensitizing the UCNP upconversion, conveying the much larger absorption cross‐section of IR806 relative to the UCNP, as well as S1→T1 ISC enhancement by Ln3+. Reproduced with permission.36 Copyright 2018, Nature Publishing Group.
Figure 5
Figure 5
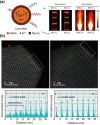
a) Schematic illustration of the NaErF4–NaLuF4 core–shell nanocrystals, which showed strong both upconversion and downshifted emission at variable excitation wavelengths. Reproduced with permission.75 Copyright 2017, American Chemical Society. b) HAADF‐STEM images of KLu2F7:38%Yb3+,2%Er3+ UCNPs before (top left) and after (top right) annealing at 240°C. Intensity profiles recorded by scanning along the directions of the orange (bottom left) and green arrows (bottom right) of the UCNPs before and after annealing, respectively. Reproduced with permission.77 Copyright 2018, American Chemical Society.
Figure 6
Figure 6
a) Schematic design of a NaYF4@NaYbF4:Tm@NaYF4 core–shell–shell nanoparticle for confining the migration of excitation energy generated in the Yb3+ ions. b) Upconversion emission intensity versus inner shell thickness (1–17 nm). c) Simulation of shell thickness on the probability distribution function of excitation energy. With increasing inner shell thickness (from left to right), the energy migrates to a larger area and the probability distribution function of excitation energy drops significantly. Reproduced with permission.35 Copyright 2016, Nature Publishing Group.
Figure 7
Figure 7
a) Schematic design active‐core/active‐shell nanoparticle architecture showing the NIR light absorbed by the active Yb3+‐rich shell and subsequently transferred to the luminescent core. Reproduced with permission.80 Copyright 2009, John Wiley & Sons, Inc. b) Cartoon schematic of the two LSPR peaks of the gold nanorods matching the excitation and emission light of ZrO2 UCNPs, leading to an enhancement factor of upconversion emission of ZrO2 UCNPs up to 35000. Reproduced with permission.83 Copyright 2015, John Wiley & Sons, Inc. c) Schematic illustration of the experimental setup for amplification of upconversion emission through dielectric microbeads. d) Comparison of simulation of the far‐field accumulation with and without dielectric microbeads. Panels (c) and (d) reproduced with permission.34 Copyright 2019, Nature Publishing Group.
Figure 8
Figure 8
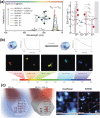
a) Upconversion emission spectra of the NaYF4:Er/Tm@NaYF4 nanoparticles doped with different Er3+ and Tm3+ concentration in the core (left) and the proposed upconversion mechanisms for NaErF4:Tm (0.5 mol %) nanoparticles under excitation with a 980 nm diode laser (right). Reproduced with permission.100 Copyright 2017, John Wiley & Sons, Inc. b) Manipulation of the luminescence decay lifetimes of NaYF4:Yb3+, Tm3+ UCNPs by increasing concentration of Tm3+. Reproduced with permission.101 Copyright 2014, Nature Publishing Group. c) Diagrams of energy levels of highly Tm3+ doped UCNPs under 980 nm and under both 980 and 808 nm laser illumination (left) and comparison of Confocal and STED image of the 13 nm 8% Tm‐doped UCNPs (right). Reproduced with permission.38 Copyright 2017, Nature Publishing Group.
Figure 9
Figure 9
a) Scheme of deep animal imaging using high‐efficiency multi‐shell UCNPs for in vivo PAI, UCL, and MRI. Reproduced with permission.120 Copyright 2016, John Wiley & Sons, Inc. b) In vivo micro‐PET images of mouse acquired at 5 min after intravenous injection 18F‐labeled UCNPs. Reproduced with permission.121 Copyright 2011, Elsevier. c) In vivo UCL and d) SPECT imaging after intravenous injection of Sm‐UCNPs. Reproduced with permission.122 Copyright 2013, Elsevier.
Figure 10
Figure 10
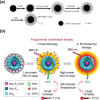
a) Schematic image showing how to load ZnPc into mesoporous silica shell on NaYF4@silica nanoparticles and use them for PDT. Reproduced with permission.123 Copyright 2009, John Wiley & Sons, Inc. b) Schematic diagram of programmed combination therapy. Reproduced with permission.126 Copyright 2018, Nature Publishing Group.
Figure 11
Figure 11
a) Schematic representation of current approaches to construct UCNP based DDSs: i) hydrophobic pockets, ii) mesoporous silica shells, and iii) hollow mesoporous‐coated spheres. Reproduced with permission.135 Copyright 2012, Elsevier. b) Schematic illustration of the UCNP‐based drug delivery system. DOX molecules were physically adsorbed into the oleic acid layer on the nanoparticle surface by hydrophobic and released from UCNP triggered by decreasing pH. Reproduced with permission.134 Copyright 2011, Elsevier. c) Synthetic route to UCNPs@mSiO2‐P(NIPAm‐co‐MAA). With increasing the temperature and decreasing the pH value, the anti‐cancer drugs would be released to cause cell death. Reproduced with permission.136 Copyright 2013, John Wiley & Sons, Inc.
Figure 12
Figure 12
a) Cartoon schematic of UCNP‐mediated NIR upconversion optogenetics. b) Confocal images of the VTA after transcranial NIR stimulation under different treatments. Extensive NIR‐driven c‐Fos (red) expression was observed only in the presence of both UCNPs (blue) and ChR2 expression (labeled with EYFP), Scale bars: 100 µm. c) An illustration of in vivo upconversion optogenetics for multiple neural systems, including the inhibition of HIP activity, stimulation of MS, and stimulation of the hippocampal engram for memory recall. Reproduced with permission.39 Copyright 2018, American Association for the Advancement of Science (AAAS).
Figure 13
Figure 13
a) Illustration of sub‐retinal injection of pbUCNPs in mice. b) Images showing pupil constriction from non‐injected control and pbUCNP‐injected mice under 980 nm light stimulation. c) Diagram of Y‐shaped water maze for different tasks. d) Stimuli of one task to evaluate the mice's ability to discriminate between the two orientations (horizontal or vertical) of NIR light gratings. Experiments were under dark background. e) Correct rates of task for light grating discrimination. f) Visual spatial resolutions of pbUCNP‐injected and control mice for 535 and 980 nm light gratings. Reproduced with permission.40 Copyright 2019, Elsevier.
Figure 14
Figure 14
a) Illustration of sensing and imaging of the pH sensor film using the RGB technique. The sensor is excited by the IR light and emits light with different colors. The camera collects the red, green, and blue light in three independent channels, which can then be used for referenced ratiometric read‐out and imaging. pH is calculated based on rationing data from the red by the green channel data. Reproduced with permission.154 Copyright 2014, American Chemical Society. b) Ratiometric imaging of pH probes reveals their localization in different types of microenvironment including small endosome, large endosome, and lysosome. The intensity of ratio of I 590/I 550 was used to measure the pH variations in different regions of the cells. Reproduced with permission.155 Copyright 2017, American Chemical Society.
Figure 15
Figure 15
a) Schematic of the inner filter‐effect‐based UCNP O2 sensor. The absorbance spectrum of oxygen sensor [Ir(CS)2(acac)] overlapped with the emission of NaYF4:Yb, Tm UCNPs while the green emission of [Ir(CS)2(acac)] could be quenched by the O2. Reproduced with permission.156 Copyright 2011, John Wiley & Sons, Inc. b) Schematic illustration of the sensing principle of the upconversion nanoprobe for ratiometric luminescent measurement of nitric oxide. Reproduced with permission.157 Copyright 2017, American Chemical Society.
Figure 16
Figure 16
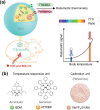
Schematic illustration of the TTA‐Nd‐NPs based ratiometric thermometry in vivo. a) TTA‐upconversion is sensitively responsive to temperature changes. With the assistance of an internal reference, the calibrated TTA–UCL signals become capable for accurate temperature monitoring in a small animal. b) Chemical structures of the TTA chromophores containing BDM (TTA annihilator) and PtTPBP (TTA sensitizer), and schematic structure of the Nd3+nanophosphor (reference). BSA: bovine serum albumin, ISC: intersystem crossing, TTET: triplet–triplet energy transfer, TTA: triplet–triplet annihilation. Reproduced with permission.160 Copyright 2018, Nature Publishing Group.
Figure 17
Figure 17
a) Schematic illustration of 1) the synthesis of Nile red derivative (NRD). 2) mPEG‐UCNPs‐NRD and their use for detecting Fe3+ based on change in UCL emission. Reproduced with permission.161 Copyright 2016, American Chemical Society. b) Schematic representation of the proposed sensor platform under the presence or absence of complementary DNA. Reproduced with permission.166 Copyright 2015, American Chemical Society. c) Scheme illustrating the ring‐opening and release reactions of bicyclic compound as it is irradiated with visible or NIR light. Reproduced with permission.176 Copyright 2009, American Chemical Society. d) Scheme illustrating UCNP nanophosphors into the azotolane‐containing cross‐linked liquid‐crystal polymer (CLCP) film bending toward the light source along the alignment direction of the mesogens, remaining bent in response to the 980 nm laser irradiation, and becoming flat again after the light source was removed. Reproduced with permission.179 Copyright 2011, American Chemical Society.

References

    1. Leiner M. J. P., Anal. Chim. Acta 1991, 255, 209.
    1. Roda A., Guardiglia M., Pasinia P., Mirasoli M., Michelini E., Musiani M., Anal. Chim. Acta 2005, 541, 25.
    1. Sagara Y., Kato T., Nat. Chem. 2009, 1, 605. - PubMed
    1. Valeur B., Berberan‐Santos M. N., Molecular Fluorescence Principles and Applications, Wiley‐VCH, Weinheim: 2012.
    1. Bloembergen N., Phys. Rev. Lett. 1959, 2, 84.

LinkOut - more resources