. 2019 Dec;20(12):127-137.
doi: 10.1002/acm2.12777. Epub 2019 Nov 25.

Validation of the RayStation Monte Carlo dose calculation algorithm using a realistic lung phantom

Affiliations

Validation of the RayStation Monte Carlo dose calculation algorithm using a realistic lung phantom

Andries N Schreuder et al. J Appl Clin Med Phys. 2019 Dec.

Abstract

Purpose: Our purposes are to compare the accuracy of RaySearch's analytical pencil beam (APB) and Monte Carlo (MC) algorithms for clinical proton therapy and to present clinical validation data using a novel animal tissue lung phantom.

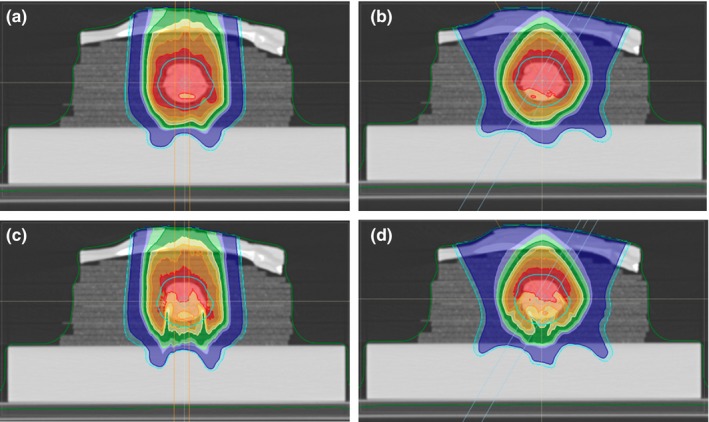
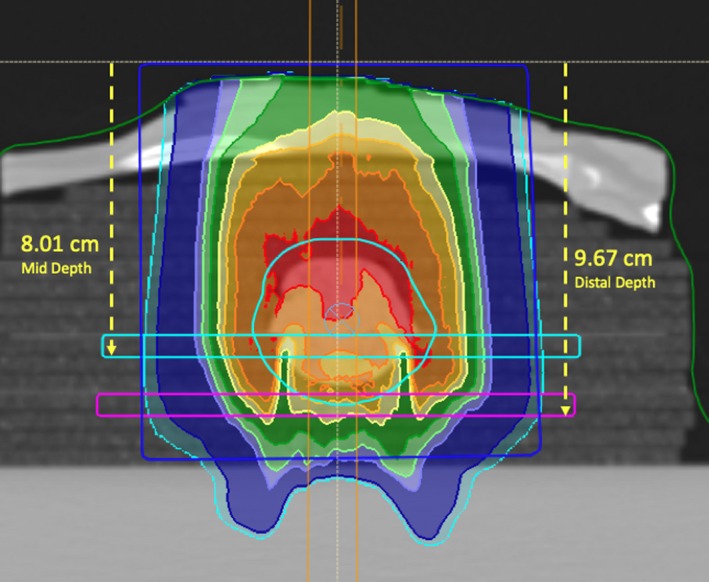
Methods: We constructed a realistic lung phantom composed of a rack of lamb resting on a stack of rectangular natural cork slabs simulating lung tissue. The tumor was simulated using 70% lean ground lamb meat inserted in a spherical hole with diameter 40 ± 5 mm carved into the cork slabs. A single-field plan using an anterior beam and a two-field plan using two anterior-oblique beams were delivered to the phantom. Ion chamber array measurements were taken medial and distal to the tumor. Measured doses were compared with calculated RayStation APB and MC calculated doses.

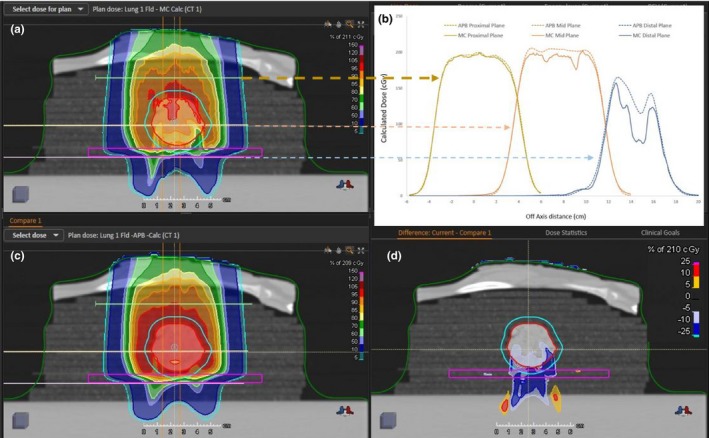
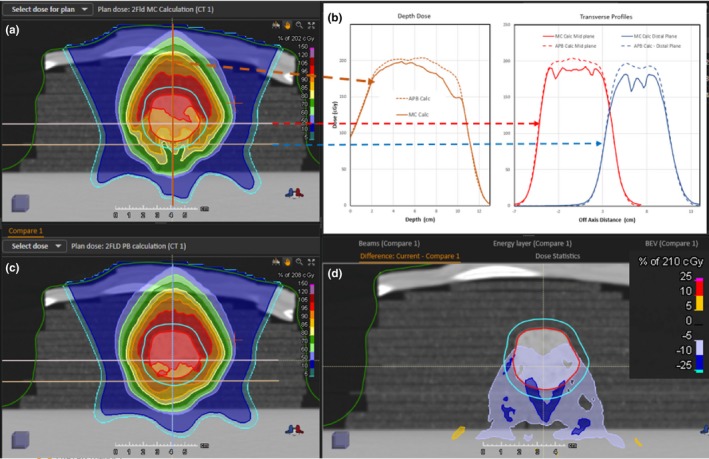
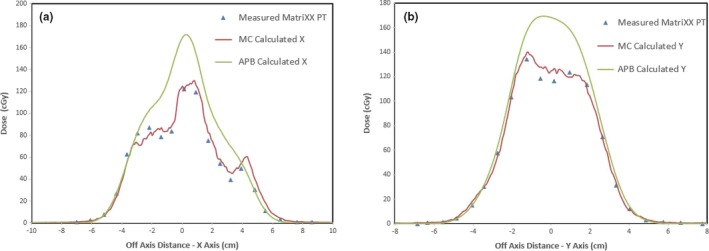
Results: Our lung phantom enabled measurements with the MatriXX PT at multiple depths in the phantom. Using the MC calculations, the 3%/3 mm gamma index pass rates, comparing measured with calculated doses, for the distal planes were 74.5% and 85.3% for the APB and 99.1% and 92% for the MC algorithms. The measured data revealed up to 46% and 30% underdosing within the distal regions of the target volume for the single and the two field plans when APB calculations are used. These discrepancies reduced to less than 18% and 7% respectively using the MC calculations.

Conclusions: RaySearch Laboratories' Monte Carlo dose calculation algorithm is superior to the pencil-beam algorithm for lung targets. Clinicians relying on the analytical pencil-beam algorithm should be aware of its pitfalls for this site and verify dose prior to delivery. We conclude that the RayStation MC algorithm is reliable and more accurate than the APB algorithm for lung targets and therefore should be used to plan proton therapy for patients with lung cancer.

Keywords: Monte Carlo; charged particle therapy; lung; pencil beam scanning; pencil-beam algorithm; radiation.


Conflict of interest statement

No duality of interest disclosed.

Figures

Figure 1
Figure 1
A CT image of the realistic lung phantom (panel a) placed on solid water in the position to be irradiated (panel b) for the left anterior oblique beam of the two‐field lung plan. Panel c shows a 3 D rendering from the CT data illustrating the ribs in the beam path. Panel d shows the orthogonal x rays and Digital Reconstructed Radiographs (DRRs) used for positioning the phantom using the VeriSuite IGRT System.
Figure 2
Figure 2
Dose distributions for the two lung phantom plans shown in the axial CT slices through the isocenter. The 1 Field lung phantom plan dose distribution calculated with APB is shown in panel a and the corresponding MC dose distribution is shown in panel c. The 2 Field lung phantom plan dose distribution calculated with APB is shown in panel b and the corresponding MC dose distribution is shown in panel d. APB, analytical pencil beam.
Figure 3
Figure 3
A comparison between measured and calculated central axis (CAX) doses for a PBS beam for different air gaps between the range shifter and the water surface. The measured data points are indicated by the red squares while the MC data and the APB calculated doses are shown by the green and blue lines respectively. The extent of the airgap for each graph is printed as the title of each panel. APB, analytical pencil beam.
Figure 4
Figure 4
Measurement depths illustrated for verifying the calculated dose for the Anterior 1 field plan. The MatriXX PT rectangular slab contours for the mid and the distal measurement planes are illustrated with the teal and violet contours respectively. The dark blue rectangular contour shows the volume used to calculate the HU histogram shown in Fig. 5.
Figure 5
Figure 5
The frequency distribution of the number of voxels vs. Hounsfield unit (HU) in the calculation volume only of the lung phantom, that is, the voxels traversed by the beams, is shown by the blue line. The red line and red diamonds show the HU to Relative Mass Density calibration curve used in RayStation for routine treatment planning. The purple squares show the 5% increased mass density values in the cork region highlighted in the zoomed box.
Figure 6
Figure 6
The 3D 2%/2 mm gamma pass rates for the 1 Field and 2 Field MC calculated lung plans at the expected depths as a function of the percentage correction applied to the entire HU to Mass density curve in RayStation.
Figure 7
Figure 7
The calculated dose distributions for the single field AP beam lung plan. The Monte Carlo dose calculation is shown in panel a and the pencil beam calculation in panel c. Calculated dose profile comparisons at three different depths in the central axis plane are shown in panel b. The profiles for Monte Carlo (solid line) and analytical pencil beam algorithms (dotted line) are indicated by the yellow arrow for the proximal depth at 5.37 cm, the brown arrow for the mid depth at 7.39 cm and the blue arrow for the distal depth at 9.05 cm (expected depth = 9.65 cm). The profiles shown in panel b are offset in the horizontal axis for display purposes. Panel d shows the dose difference map between the MC and APB dose distribution in the CAX plane (MC dose minus APB dose. APB, analytical pencil beam; CAX, calculated central axis.
Figure 8
Figure 8
In‐Plane (panel a) and Cross‐Plane (Panel b) line dose profiles for the 1 Field lung plan at 9.65 cm depth in the dose cube. The green dots represent the APB calculated dose while the red dots are from the MC calculated dose cube. The blue triangles show the dose measured with the MatriXX PT detector. APB, analytical pencil beam.
Figure 9
Figure 9
Calculated dose distributions for the two‐field beam lung plan. The Monte Carlo dose calculation is shown in panel a and the pencil beam calculation in panel c. Calculated dose profile comparisons at two different depths in the central axis plane and a depth dose comparison are shown in panel b. The profiles for the MC (solid lines) and APB algorithms (dashed lines) are indicated by the red arrow for the mid depth at 7.39 cm and the blue arrow for the distal depth at 9.05 cm. The transverse profiles are offset in the horizontal axis for display purposes. The brown arrow indicates the CAX depth dose comparison between the MC dose (solid line) and the APB dose (dotted line). Panel d shows the dose difference map between the MC and APB dose distribution in the CAX plane (MC dose minus APB dose. APB, analytical pencil beam; CAX, calculated central axis.
Figure 10
Figure 10
In‐Plane (panel a) and Cross‐Plane (Panel b) line dose profiles for the 2 Field lung plan at 9.65 cm depth in the dose cube. The green dots represent the APB calculated dose while the red dots are from the MC calculated dose cube. The blue triangles show the dose measured with the MatriXX PT detector. APB, analytical pencil beam.
Figure 11
Figure 11
Frequency distributions of the normalized number of voxels having a certain HU for two real lung tumors treated in our clinic and for the simulated lung tumor. The data is normalized to a maximum of 100 to accommodate the different volumes of the tumors evaluated.

References

    1. American Cancer Society . Cancer Facts & Figures 2018. Atlanta: American Cancer Society; 2018.
    1. Meinhold C, Abrahamson S, Adelstein S, et al. NCRP Report No. 116: Limitation of Exposure to Ionizing Radiation. Bethesda, MD: National Council on Radiation Protection and Measurements; 1993.
    1. Berman A, James S, Rengan R. Proton beam therapy for non‐small cell lung cancer: current clinical evidence and future directions. Cancers (Basel). 2015;7:1178–1190. - PMC - PubMed
    1. Durante M, Paganetti H. Nuclear physics in particle therapy: a review. Rep Prog Phys. 2016;79:096702. - PubMed
    1. Nakamura N, Hotta K, Zenda S, et al. Hypofractionated proton beam therapy for centrally located lung cancer. Int J Radiat Oncol Biol Phys. 2018;102:e698. - PubMed

Publication types