. 2020 Jan 2;130(1):214-230.
doi: 10.1172/JCI130711.

Differential skewing of donor-unrestricted and γδ T cell repertoires in tuberculosis-infected human lungs

Affiliations

Differential skewing of donor-unrestricted and γδ T cell repertoires in tuberculosis-infected human lungs

Paul Ogongo et al. J Clin Invest. .

Abstract

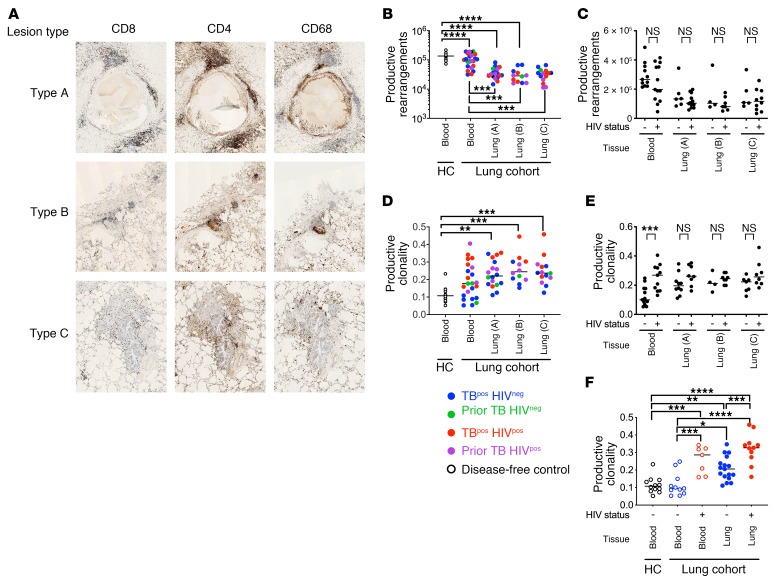
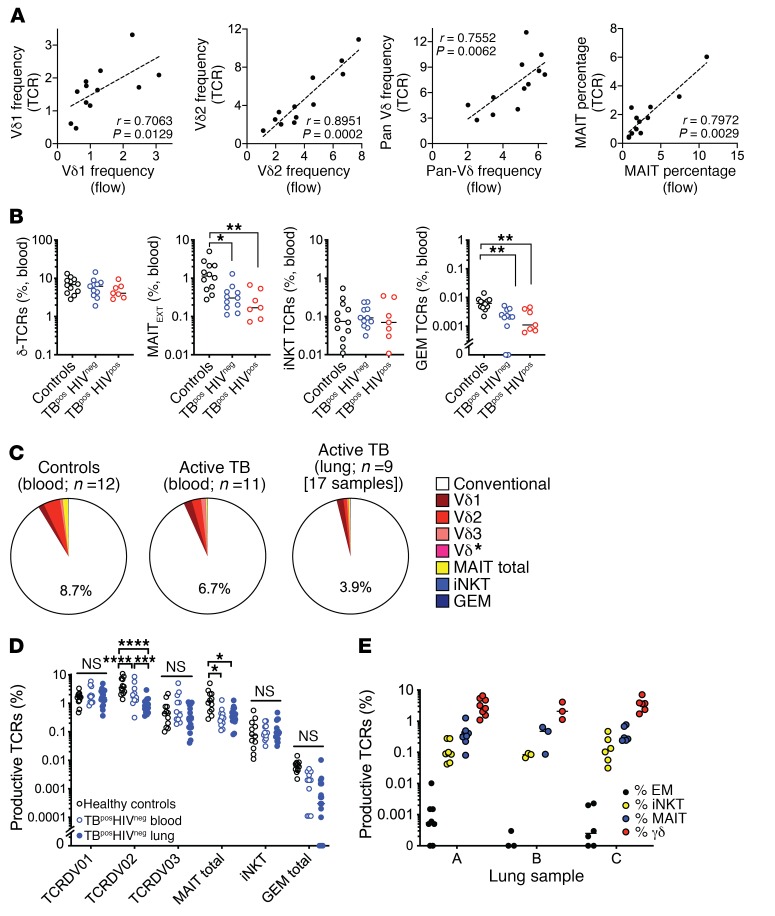
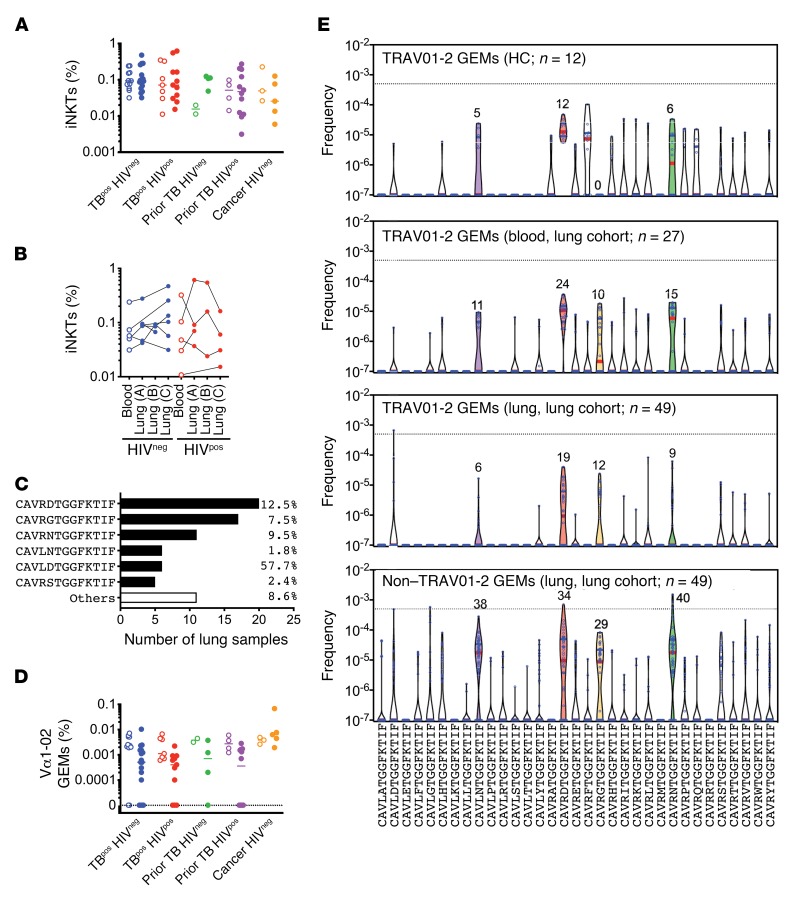
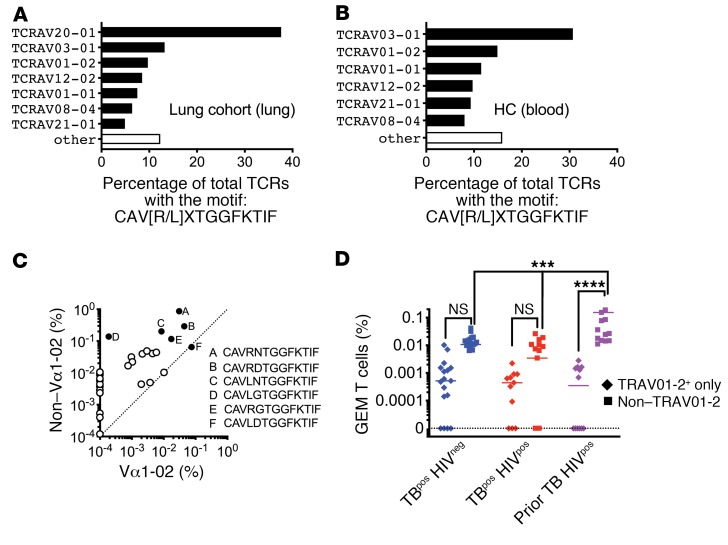
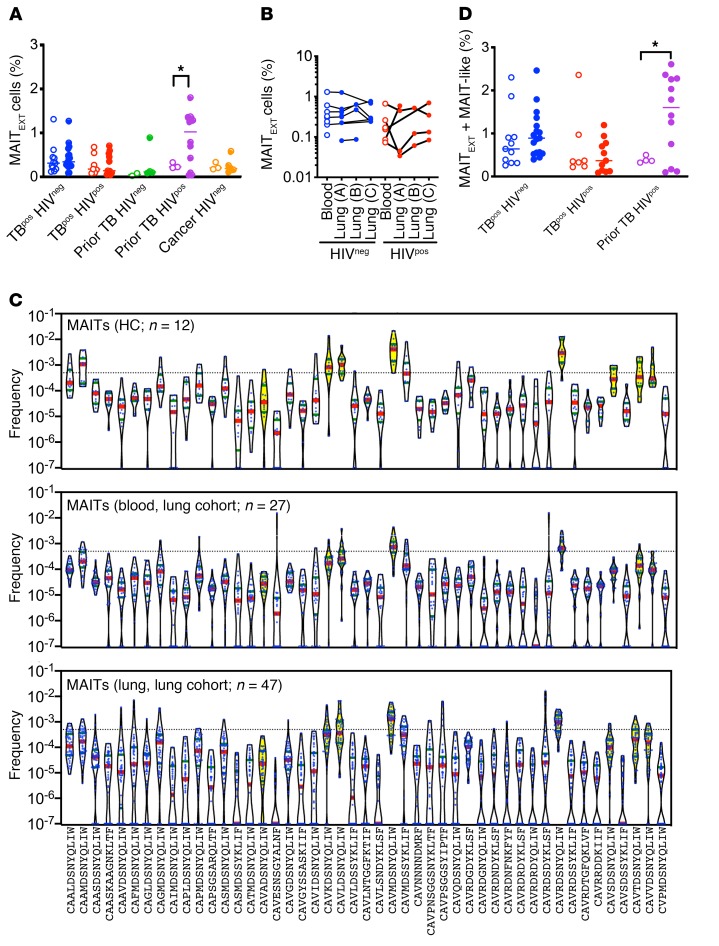
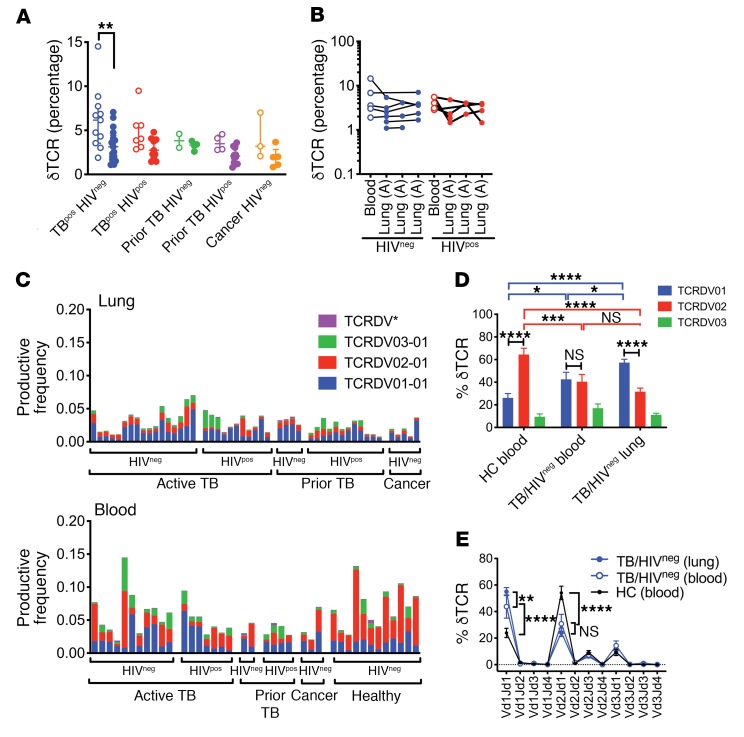
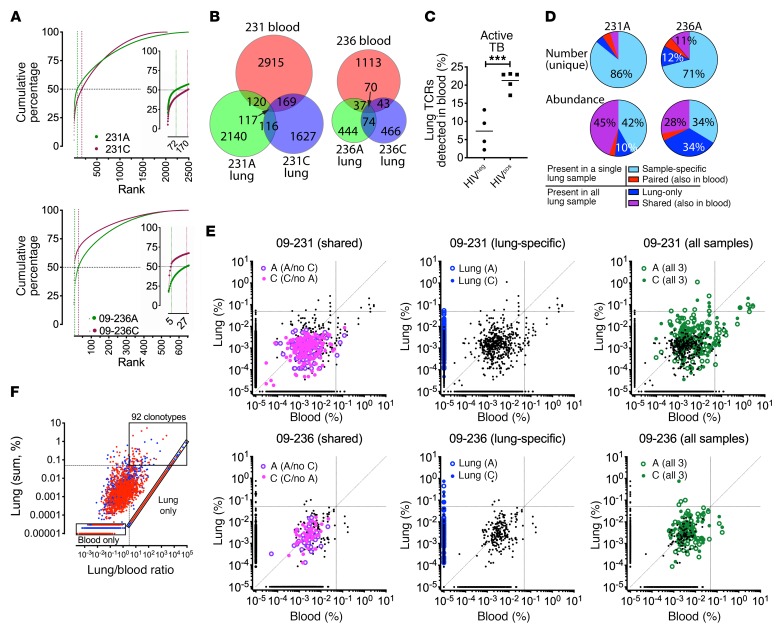
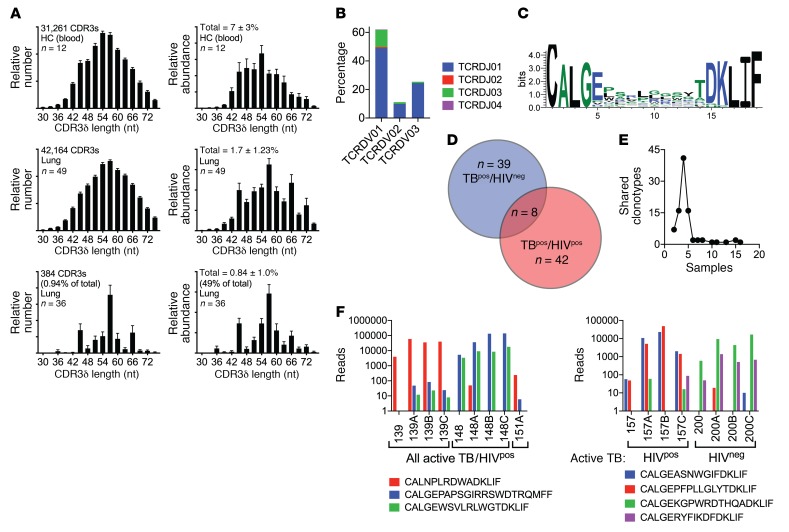
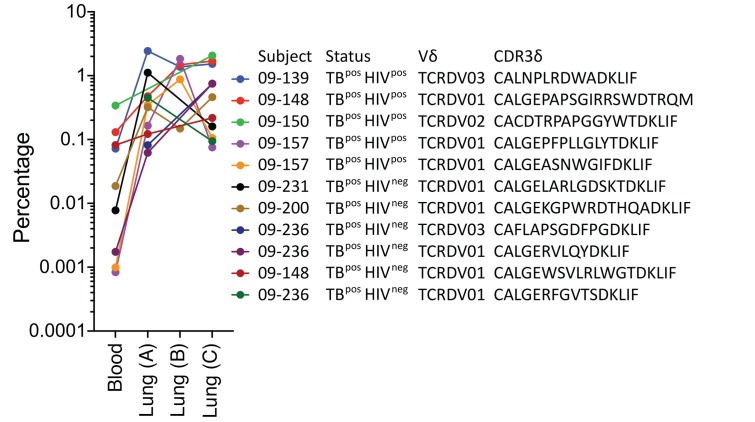
Unconventional T cells that recognize mycobacterial antigens are of great interest as potential vaccine targets against tuberculosis (TB). This includes donor-unrestricted T cells (DURTs), such as mucosa-associated invariant T cells (MAITs), CD1-restricted T cells, and γδ T cells. We exploited the distinctive nature of DURTs and γδ T cell receptors (TCRs) to investigate the involvement of these T cells during TB in the human lung by global TCR sequencing. Making use of surgical lung resections, we investigated the distribution, frequency, and characteristics of TCRs in lung tissue and matched blood from individuals infected with TB. Despite depletion of MAITs and certain CD1-restricted T cells from the blood, we found that the DURT repertoire was well preserved in the lungs, irrespective of disease status or HIV coinfection. The TCRδ repertoire, in contrast, was highly skewed in the lungs, where it was dominated by Vδ1 and distinguished by highly localized clonal expansions, consistent with the nonrecirculating lung-resident γδ T cell population. These data show that repertoire sequencing is a powerful tool for tracking T cell subsets during disease.

Keywords: Adaptive immunity; Immunology; Infectious disease; T-cell receptor; Tuberculosis.


Conflict of interest statement

Conflict of interest: The authors have declared that no conflict of interest exists.

Figures

Figure 1
Figure 1. TCR sequences from human TB granulomas.
(A) Representative immunohistology images of lung tissue from an HIVneg subject with active TB (original magnification, ×600) showing CD4+ve and CD8+ve T cells and CD68+ve macrophages. Samples from type A tissue, the most diseased area of the resected lung, had classic caseous granulomas with a distinct lymphocyte cuff and lymphocyte aggregates. Samples from types B and C, from less diseased tissue, show lymphocytic infiltrations and uninvolved alveoli. (B) Number of unique productive TCRα and TCRδ rearrangements obtained from deep-level (blood) or survey-level (lung) sequencing. Each point represents a unique subject. Color identifies the clinical status, grouped by tissue and lung lesion type (i.e., type A, B, or C). (C) Number of unique productive rearrangements obtained from blood or lung tissue from HIVneg versus seropositive subjects (HIVpos) with active or prior TB. (D) Clonality of the productive TCRα and TCRδ rearrangements (as in B). (E) Productive clonality calculated for TCRs identified in blood or lung from HIVneg versus HIVpos subjects with active or prior TB. (F) Effect of HIV status on TCR clonality during active TB. Error bars indicate the median. *P < 0.05, **P < 0.01, ***P < 0.001, and ****P < 0.0001, by Kruskal-Wallis 1-way ANOVA with Dunn’s multiple comparisons test (BF).
Figure 2
Figure 2. Next-generation sequencing summary for the human TCRA/D locus.
(A) Frequency of Vδ1, Vδ2, γδ T cells and MAITs as determined by TCR sequencing (y axis) or flow cytometry (x axis, fraction of CD3+ T cells) in blood from HCs. (B) Percentage of γδ T cells, MAITs, iNKTs, and GEMs in blood from HCs, HIVpos subjects, and HIVneg subjects with active TB. (C) Percentage of DURTs in blood from HCs (n = 12) and in blood (n = 11) or lung tissue (n = 17) from HIVpos subjects with active pulmonary TB. The TCRδ sequences encoded by the Vδ1, Vδ2, or Vδ3 or Vδ* (Vδ4+Vδ5+Vδ6+Vδ7+Vδ8) are identified by different shades of red. The non-DURTs are defined as “conventional.” (D) Percentage of Vδ1, Vδ2, or Vδ3, MAIT, iNKT, and GEM T cells in blood from HCs and blood and lung tissue from HIVneg subjects with active pulmonary TB. (E) Percentage of total GEM, MAITs, iNKT, and γδ T cells in lung lesion types A, B, and C. *P < 0.05, **P < 0.01, ***P < 0.001, and ****P < 0.0001, by Kruskal-Wallis 1-way ANOVA with Dunn’s multiple comparisons test (B) and 2-way ANOVA with Tukey’s multiple comparisons test (D and E).
Figure 3
Figure 3. CD1-restricted T cells in blood and lung during active TB.
(A) The frequency of iNKTs in blood (open circles) compared with lung (solid circles) among 5 clinical populations. (B) iNKT cell frequency in paired lung and blood samples, stratified by HIV status for subjects with active TB. Each line represents a single individual. (C) Using a consensus definition of GEM TCRα (Vα1-02, Jα9, CDR3α=CAV(R/L)xTGGFKTIF), GEMs were identified in lung tissue. The 6 most frequently detected clonotypes are shown, with their total relative abundance in the aggregated lung TCR data set. (D) Frequency of GEMs in blood (open circles) versus lung tissue (solid circles) among 5 clinical populations. (E) Clonotypes encoded by TRAV01-2 with the CDR3α CAV(R/L)xTGGFKTIF were identified in HCs (blood, top) and subjects in the lung cohort (blood, second graph; lung, third graph). Non–TRAV01-2 clonotypes encoding the CAV(R/L)xTGGFKTIF CDR3α were identified in lung (bottom graph). A frequency of 0.0000001 was assigned to clonotypes not detected. Dotted lines indicate a productive frequency of 0.05%. Colored violins indicate the most frequently detected lung clonotypes. Red lines indicate the median and blue lines the quartiles.
Figure 4
Figure 4. CD1-restricted T cells in blood and lung during active TB.
(A) TRAV diversity among TCRs from the lung cohort (blood, lung, sputum) with a consensus sequence of CAV(R/L)xTGGFKTIF. (B) TRAV diversity among TCRs from HC blood with a consensus sequence of CAV(R/L)xTGGFKTIF. (C) Relative abundance of CAV(R/L)xTGGFKTIF among TRAV01-2 and non–TRAV01-2 cell populations. Each circle represents a unique clonotype (solid circles represent the 6 most abundant clonotypes). (D) Frequency of GEM and GEM-like TCRs in lung tissue from 3 clinical populations. Some statistical comparisons have been omitted for clarity. ***P < 0.001 and ****P < 0.0001, by ordinary 2-way ANOVA with Tukey’s multiple comparisons test. Error bars indicate the median.
Figure 5
Figure 5. MAITs are expanded in the lungs of HIVpos subjects with a history of TB.
(A) Frequency of extended MAITs (MAITExt, Table 2) in blood (open circles) and lung (solid circles) among 5 clinical populations. (B) Frequency of MAITExt in paired lung and blood from subjects with active TB, stratified by HIV status. Each line represents a single individual. (C) MAITExt and MAIT-like clonotypes in HC blood (top graph) and in samples form the lung cohort (blood, middle graph; lung, bottom graph). For clonotypes not detected, a frequency of 0.0000001 was assigned. Dotted line indicates a productive frequency of 0.05%. MAITExt clonotypes are designated by violins in yellow. Red bars in indicate the median; blue bars indicate quartiles. (D) Frequency of total MAIT TCRs (MAITExt + MAIT-like) in blood (open circles) and lung (solid circles) among 5 clinical populations. *P < 0.05, by 2-way ANOVA with Sidak’s multiple comparisons test (A and D). Error bars indicate the median.
Figure 6
Figure 6. Distribution of unique TCRδ clonotypes.
(A) Frequency of γδ T cells (Table 2) in blood (open circles) and lung (solid circles) among 5 clinical populations. (B) Frequency of γδ T cells in paired lung and blood samples from subjects with active TB were stratified by HIV status. Each line represents a single individual. (C) Vδ1, Vδ2, Vδ3, or Vδ* (Vδ4+Vδ5+Vδ6+Vδ7+Vδ8) use for each lung (top graph) or blood (bottom graph) sample. The clinical status of each subject is shown. (D) Vδ1, Vδ2, or Vδ3 use by T cells from the blood of HCs versus blood or lung tissue of HIVneg subjects with active pulmonary TB. Some statistical comparisons have been omitted for clarity. (E) Pairing analysis of Vδ1, Vδ2, or Vδ3 with Jδ1, Jδ2, Jδ3, or Jδ4 in blood from HCs compared with blood and lung tissue from HIVneg subjects with active pulmonary TB. *P < 0.05, **P < 0.01, ***P < 0.001, and ****P < 0.0001, by 2-way ANOVA with Sidak’s (A) or Tukey’s (E) multiple comparisons test. Error bars indicate the median; data represent the mean ± SEM.
Figure 7
Figure 7. TCRδ clonotypes detected in TB lung granulomas.
(A) Cumulative frequency of lung TCRδ clonotypes from 2 representative HIVneg subjects with active TB (09-231 and 09-236). Vertical dotted lines indicate the number of clonotypes comprising 50% of the total lung TCRδs. (B) Overlap of TCRδ clonotypes detected in the blood and lung tissue of subjects 09-231 and 09-236. (C) Percentage of lung TCRδ clonotypes detected in the blood (i.e., common to blood and lung) for subjects with active TB. (D) Number of TCRδ clonotypes unique to lung samples from subjects 09-231A and 09-236A, shared with blood only, shared with other lung samples, or detected in all 3 samples (top pie charts). Relative abundance of the TCRδ clonotypes in these groups (bottom pie charts). (E) Groups of TCRδ clonotypes differed in their abundance. Lung frequency of each TCRδ clonotype versus its blood frequency. For clonotypes not detected, the frequency was assigned 0.00000011. All unique clonotypes are shown in black. Specific groups of clonotypes are shown in color as follows: paired (shared between 1 lung sample and blood; purple); lung-specific (blue); or shared (in all 3 samples; green). Open circles indicate the frequency in lung type A lesions; solid circles indicate the frequency in lung type B lesions. Horizontal and vertical lines equal 0.05%. Diagonal is the line of equivalency. (F) Identification of abundant and lung-enriched TCRδ clonotypes. For each of 32,000 unique clonotypes from 9 subjects, the sum of the frequencies in lung versus the lung/PBMC ratio for each clonotype was plotted. For clonotypes not detected, the frequency was assigned 0.00000011. Abundant and enriched clonotypes were defined as having a sum frequency of greater than 0.05% (horizontal dotted line) and a lung/PBMC ratio of greater than 3 (vertical dotted line). Blue represents HIVneg; red represents HIVpos. Bottom left and diagonal boxes indicate clonotypes detected only in blood or lung, and top right box indicates 92 abundant and enriched clonotypes. ***P < 0.001, by Student’s t test. Error bars indicate the median.
Figure 8
Figure 8. Enriched and abundant TCRδ clonotypes.
(A) Distribution of CDR3δ lengths based on the relative frequency (left) or abundance (right) of all unique clonotypes in blood (top row), lung (middle row), or 92 enriched and abundant clonotypes in the lung (bottom row). Data represent the mean ± SEM. (B) Pairing of Vδ1, Vδ2, or Vδ3 with Jδ1, Jδ2, Jδ3, or Jδ4 gene segments for 92 lung-enriched and abundant TCRδ clonotypes. (C) CDR3δ motif for TCRδ clonotypes with a CDR3δ length of 19 aa. (D) Distribution of the 92 TCRδ clonotypes between HIVneg or HIVpos subjects with active TB. The numbers indicate unique clonotypes. (E) Sharing of unique CDR3δ DNA rearrangements among the 88 blood and lung samples that encoded each unique clonotype. (F) Shared clonotypes between different subjects and their relative abundance. Data represent the mean ± SEM.
Figure 9
Figure 9. Enriched and abundant TCRδ clonotypes.
The 11 TCRδ clonotypes with the highest frequencies in the lungs of subjects with active TB. The frequency of each clonotype in the blood and lungs is shown, along with the subject number, status, Vδ gene, and CDR3δ aa sequence.

Comment in

References

    1. Global Tuberculosis Report 2017. World Health Organization. https://www.who.int/tb/publications/global_report/gtbr2017_main_text.pdf Accessed June 27, 2018.
    1. O’Garra A, Redford PS, McNab FW, Bloom CI, Wilkinson RJ, Berry MP. The immune response in tuberculosis. Annu Rev Immunol. 2013;31:475–527. doi: 10.1146/annurev-immunol-032712-095939. - DOI - PubMed
    1. Van Der Meeren O, et al. Phase 2b controlled trial of M72/AS01E vaccine to prevent tuberculosis. N Engl J Med. 2018;379(17):1621–1634. doi: 10.1056/NEJMoa1803484. - DOI - PMC - PubMed
    1. Schrager LK, Harris RC, Vekemans J. Research and development of new tuberculosis vaccines: a review. F1000Res. 2018;7:1732. - PMC - PubMed
    1. Van Rhijn I, Moody DB. Donor unrestricted T cells: a shared human T cell response. J Immunol. 2015;195(5):1927–1932. doi: 10.4049/jimmunol.1500943. - DOI - PMC - PubMed

Publication types

Substances