. 2019 Nov 21;19(23):5104.
doi: 10.3390/s19235104.

The Efficiency of Color Space Channels to Quantify Color and Color Intensity Change in Liquids, pH Strips, and Lateral Flow Assays with Smartphones

Affiliations

The Efficiency of Color Space Channels to Quantify Color and Color Intensity Change in Liquids, pH Strips, and Lateral Flow Assays with Smartphones

Joost Laurus Dinant Nelis et al. Sensors (Basel). .

Abstract

Bottom-up, end-user based feed, and food analysis through smartphone quantification of lateral flow assays (LFA) has the potential to cause a paradigm shift in testing capabilities. However, most developed devices do not test the presence of and implications of inter-phone variation. Much discussion remains regarding optimum color space for smartphone colorimetric analyses and, an in-depth comparison of color space performance is missing. Moreover, a light-shielding box is often used to avoid variations caused by background illumination while the use of such a bulky add-on may be avoidable through image background correction. Here, quantification performance of individual channels of RGB, HSV, and LAB color space and ΔRGB was determined for color and color intensity variation using pH strips, filter paper with dropped nanoparticles, and colored solutions. LAB and HSV color space channels never outperformed the best RGB channels in any test. Background correction avoided measurement variation if no direct sunlight was used and functioned more efficiently outside a light-shielding box (prediction errors < 5%/35% for color/color intensity change). The system was validated using various phones for quantification of major allergens (i.e., gluten in buffer, bovine milk in goat milk and goat cheese), and, pH in soil extracts with commercial pH strips and LFA. Inter-phone variation was significant for LFA quantification but low using pH strips (prediction errors < 10% for all six phones compared). Thus, assays based on color change hold the strongest promise for end-user adapted smartphone diagnostics.

Keywords: allergens; background correction; color space; food contaminant screening; image correction; lateral flow assay quantification; point of site analyses; smartphone colorimetrics.


Conflict of interest statement

The authors declare no conflict of interest. The funders had no role in the design of the study; in the collection, analyses, or interpretation of data; in the writing of the manuscript, or in the decision to publish the results.

Figures

Figure 1
Figure 1
Exemplary images taken with the Huawei of pH strips that were used to build calibration curves.
Figure 2
Figure 2
Exemplary images taken with the Huawei of the filter papers with nanomaterials on them at various concentrations. Top row are gold nanoparticles (GNP). Middle row are carbon black nanoparticles (CB). Bottom row are latex nanoparticles (LNP). Particle concentration of the solutions used is indicated in the left bottom corner of each image.
Figure 3
Figure 3
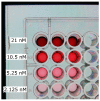
Image taken with the Xiaomi of colloid gold nanoparticles in a 96-well plate. Concentrations vary per row (as indicated). Each row (1–4) contains three replicas (H–F) used to construct the calibration curves. Backlight is provided using the white screen of the Huawei placed under the 96- well plate.
Figure 4
Figure 4
Left; an image of the Samsung taking an image of a LFA (the ZEU Proteon Gluten Express) under room-light conditions with the flashlight on at 5 cm distance. Right; an image of the light-shielding box used. The dimensions of the box are 11 × 11 × 5 cm to maintain the standard 5 cm as a distance for the photo capturing. The box had a hole in the center precisely for the camera and flash. The phone displayed on the box is the Huawei.
Figure 5
Figure 5
A set of LFAs used to build a calibration curve for gluten quantification with various smartphones. The concentrations of gluten used are indicated.
Figure 6
Figure 6
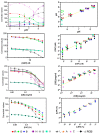
The left column shows calibration curves (with an R2 > 0.8) obtained from background corrected channel values from the RGB, HSV, and LAB (Called LAC to avoid confusion of the B channels of RGB and LAB) color spaces for various pH values, GNP, CB, and LNP concentrations. The right column shows scatter plots of predictions obtained with those calibration curves. The yellow line represents a perfect correlation (slope = 1). Color and symbol codes are indicated.
Figure 7
Figure 7
Mean average percentile errors (MAEs) for pH (a), (LNP) (b), (GNP) (c), and (CB) (d) predictions using an iPhone (dark green), Huawei (dark red), or Tablet (blue). Significant post-hoc Sidak multi comparisons of two-way ANOVAs are indicated. Stars indicate p-values with p-value correction for multiplicity. ** = p < 0.01, *** = p < 0.001, **** = p < 0.0001.
Figure 8
Figure 8
Left, MAEs for pH predictions (n = 15), right, MAEs for [GNP] predictions (n = 18), at various illumination conditions for R, G, B, ΔRGB, V, and L channels without use of a box and in a box at room illumination conditions. Images under dark (black balls) background were taken in a dark room; room background (red balls) in a windowless laboratory illuminated with a tube light bulb; indirect sunlight (green balls) in a windowsill at a cloudy day; direct sunlight (dark yellow balls) in a windowsill in full sunlight.
Figure 9
Figure 9
(a) Linear regression functions for oxidation of tetramethylbenzidine (TMB) with horseradish peroxidase (HRP) in ELISA wells for the smartphone analyses using various channels and a benchtop ELISA plate spectrometer. (b) Linear regression functions for colloid GNP at various concentrations in ELISA wells for the smartphone analyses using various channels and a benchtop ELISA plate spectrometer. Color codes and channels used are indicated. (c,d) normalized four-parameter dose-response curve fits for HRP oxidation of TMB (a) and colloid GNP (b) in ELISA wells. Green and blue circles stand for G and B channels, grey diamonds ΔRGB, magenta triangles absorption values measured by a spectrometer. (c,d inset) MAEs calculated from the predictions shown in (a,b). Stars indicate p-values from post-hoc analyses with p-value correction for multiplicity. * = p < 0.05, ** = p < 0.01.
Figure 10
Figure 10
(a) G (green balls), B (blue balls), L (black triangles), and V (turquoise squares) channel values were fitted to a calibration curve for LFA quantification of cow milk spiked into pure goat milk. ΔRGB values (grey diamonds) did not allow to fit to a curve. (b) B channel values fitted to a calibration curve and, (inset), linear regression on predictions for cow milk in goat milk at three concentrations (n = 6).
Figure 11
Figure 11
Predictions of cow milk (x-axis) in goat milk using L, G, and B channels. Each replica (n = 2) is indicated. Dashed line represents a curve at 45 degrees.
Figure 12
Figure 12
(a) B channel values fitted to four calibration curves for LFA quantification of gluten spiked into buffer with four phones (models indicated). (b) Calibration curves for LFA quantification using the smartscope and corrected G values. (c) Calibration curves for pH in buffered soil extract using corrected ΔRGB values. (d) R channel values fitted to calibration curves for pH estimation of buffered soil extracts with six phones (models indicated). Inset, the results of post-hoc analyses on the MAEs for pH predictions (n = 15) using the phone’s specific calibration curve or a mixed curve of all phone models except the one used for prediction. Stars indicate p-values with p-value correction for multiplicity. *** = p < 0.001. All calibration curves were made using a four-parameter dose-response function.

Similar articles

Cited by

References

    1. Malik A.K., Blasco C., Picó Y. Liquid chromatography-mass spectrometry in food safety. J. Chromatogr. A. 2010;1217:4018–4040. doi: 10.1016/j.chroma.2010.03.015. - DOI - PubMed
    1. Matumba L., Van Poucke C., Njumbe Ediage E., De Saeger S. Keeping mycotoxins away from the food: Does the existence of regulations have any impact in Africa? Crit. Rev. Food Sci. Nutr. 2017;57:1584–1592. doi: 10.1080/10408398.2014.993021. - DOI - PubMed
    1. The Rapid Alert System for Food and Feed (2017 Annual Report) [(accessed on 20 November 2019)]; Available online: https://ec.europa.eu/food/sites/food/files/safety/docs/rasff_annual_repo....
    1. Sivadasan S., Efstathiou J., Calinescu A., Huatuco L.H. Advances on measuring the operational complexity of supplier-customer systems. Eur. J. Oper. Res. 2006;171:208–226. doi: 10.1016/j.ejor.2004.08.032. - DOI
    1. Knowles T., Moody R., McEachern M. European food scares and their impact on EU food policy. Br. Food J. 2007;109:43–67. doi: 10.1108/00070700710718507. - DOI

LinkOut - more resources