. 2019 Nov 21;8(12):1484.
doi: 10.3390/cells8121484.

RITA Is Expressed in Trophoblastic Cells and Is Involved in Differentiation Processes of the Placenta

Affiliations

RITA Is Expressed in Trophoblastic Cells and Is Involved in Differentiation Processes of the Placenta

Julia Maria Wildner et al. Cells. .

Abstract

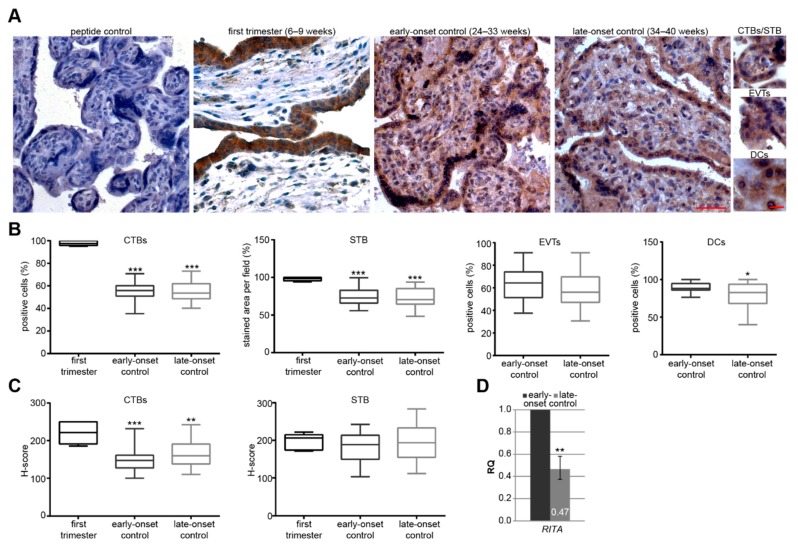
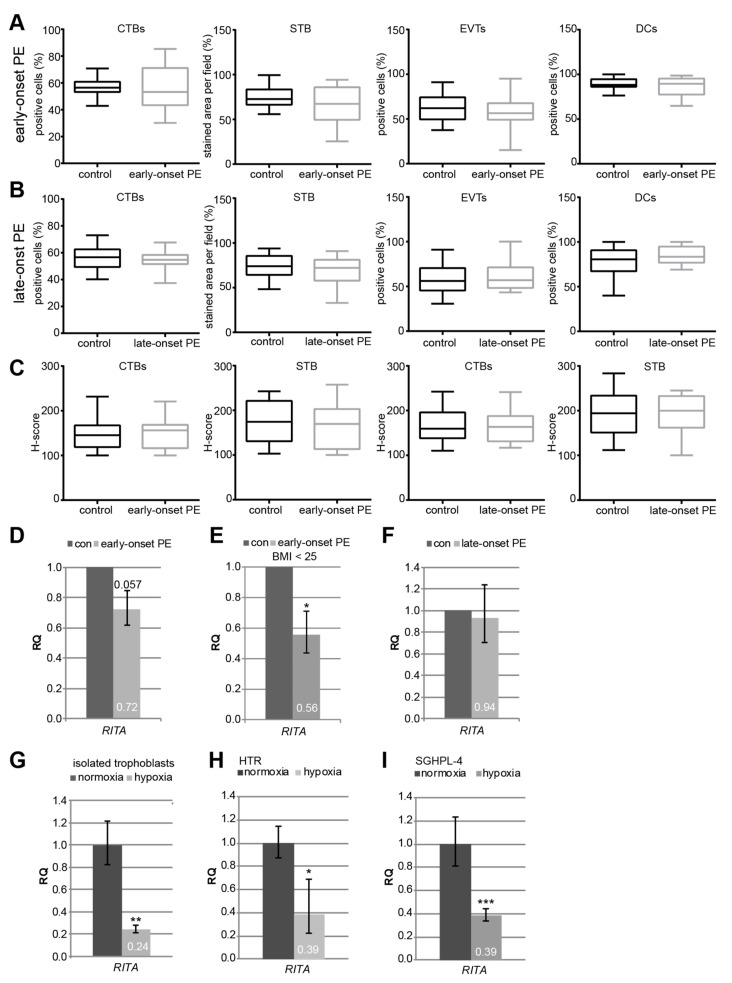
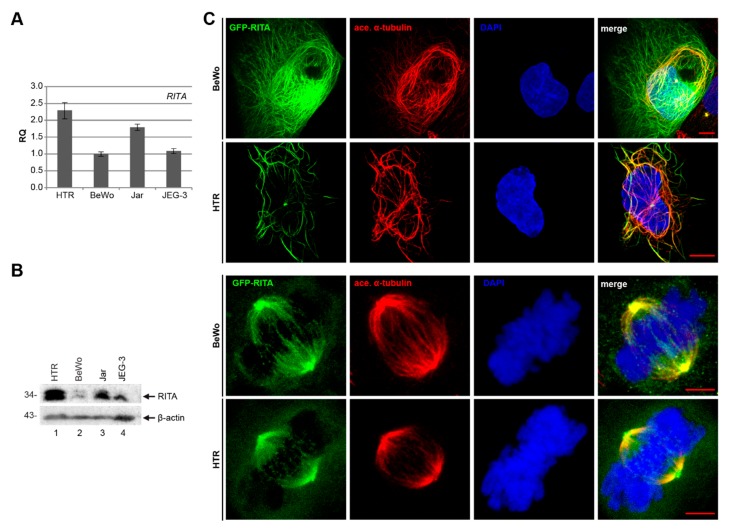
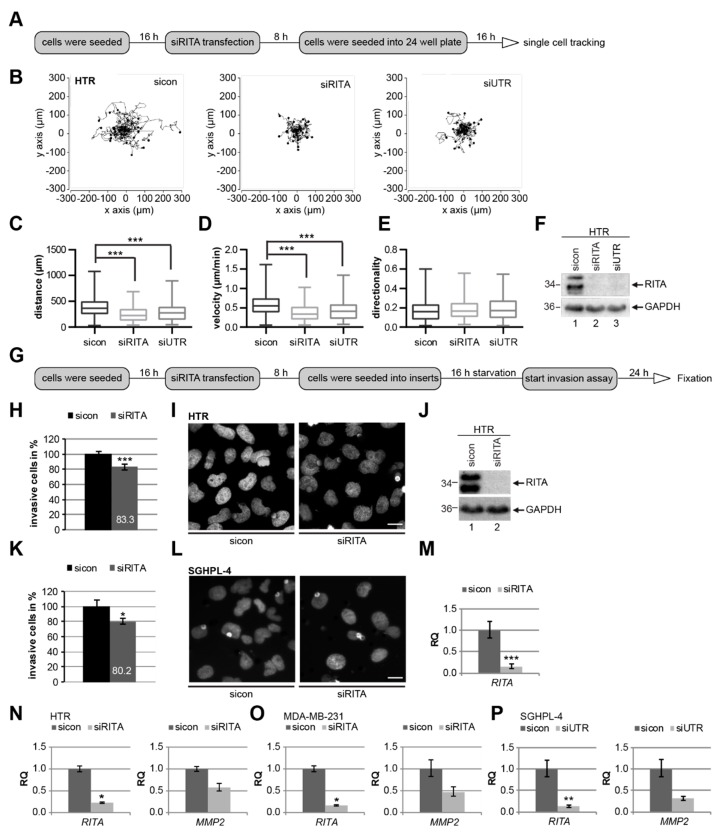
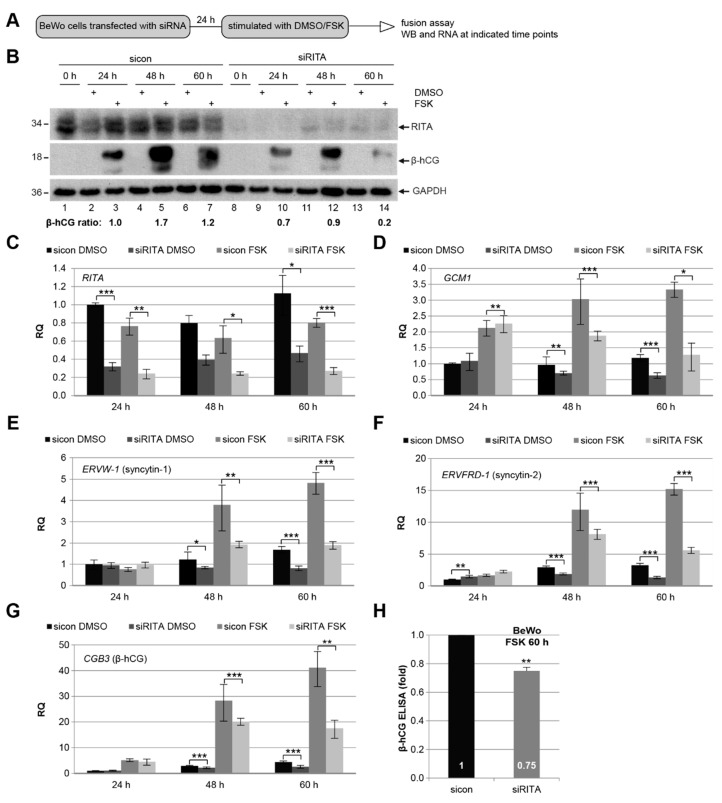
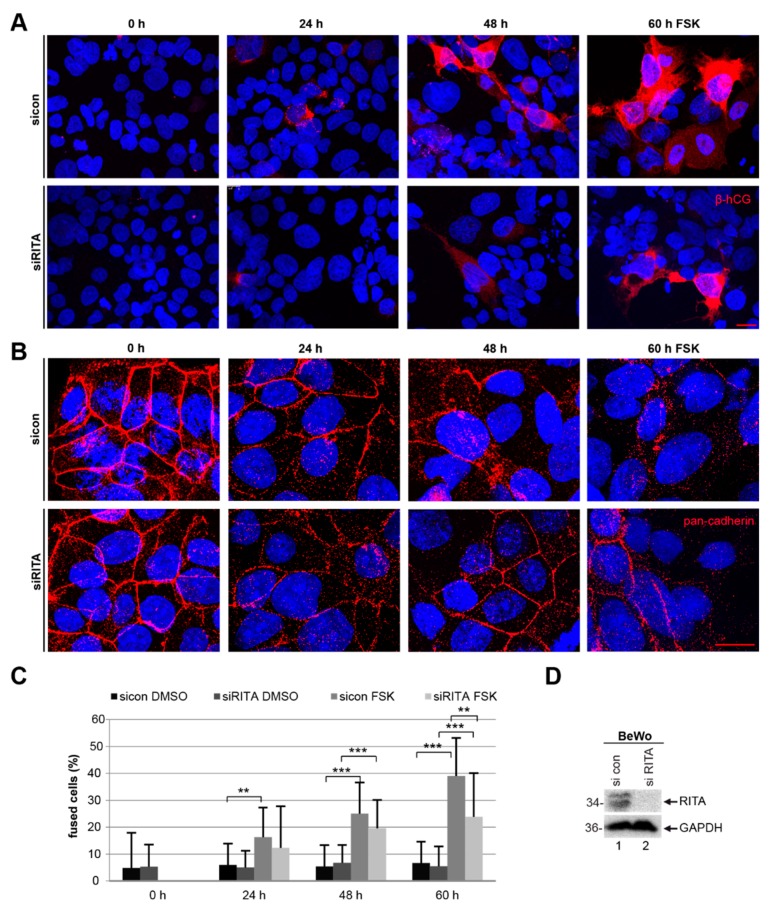
Preeclampsia (PE) remains a leading cause of maternal and perinatal mortality and morbidity worldwide. Its pathogenesis has not been fully elucidated and no causal therapy is currently available. It is of clinical relevance to decipher novel molecular biomarkers. RITA (RBP-J (recombination signal binding protein J)-interacting and tubulin-associated protein) has been identified as a negative modulator of the Notch pathway and as a microtubule-associated protein important for cell migration and invasion. In the present work, we have systematically studied RITA's expression in primary placental tissues from patients with early- and late-onset PE as well as in various trophoblastic cell lines. RITA is expressed in primary placental tissues throughout gestation, especially in proliferative villous cytotrophoblasts, in the terminally differentiated syncytiotrophoblast, and in migrating extravillous trophoblasts. RITA's messenger RNA (mRNA) level is decreased in primary tissue samples from early-onset PE patients. The deficiency of RITA impairs the motility and invasion capacity of trophoblastic cell lines, and compromises the fusion ability of trophoblast-derived choriocarcinoma cells. These data suggest that RITA may play important roles in the development of the placenta and possibly in the pathogenesis of PE.

Keywords: RITA; fusion; invasion; motility; preeclampsia; trophoblasts.


Conflict of interest statement

The authors declare no conflict of interest. The funders had no role in the study design; in collection, analyses, or interpretation of data; in manuscript writing, or in the decision to publish the results.

Figures

Figure 1
Figure 1
RBP-J (recombination signal binding protein J)-interacting and tubulin-associated protein (RITA) is expressed in trophoblastic cells of placental tissue and its gene expression decreases at late stages of gestation. (A) Paraffin-embedded tissue sections were immunohistochemically stained with a specific RITA antibody (brown) and counterstained with hematoxylin (blue). RITA antibody neutralized with its corresponding peptide (peptide control) was used as negative control. Scale of images: 50 µm, scale of small images: 20 µm. CTBs, cytotrophoblasts; STB, syncytiotrophoblast; EVTs, extravillous trophoblasts; DCs, decidual cells. (B) Quantification of RITA positive cells in first trimester placental sections (6–9 weeks, n = 6), early-onset control (24–33 weeks; n = 20), and late-onset control samples (34–40 weeks; n = 21). The results are presented as box and whisker plots with minimum and maximum variations. Student’s t-test, * p < 0.05, ** p < 0.01, *** p < 0.001. (C) Semi-quantitative analysis of the RITA staining using the H-score method. The results are presented as box and whisker plots with minimum and maximum variations. Student’s t-test referring to first trimester samples, ** p < 0.01, *** p < 0.001. (D) The relative amount of the gene RITA was analyzed from placental tissues from late-onset (n = 17, 34–40 weeks) compared to early-onset controls (n = 13, 26–33 weeks). The results are presented as relative quantification (RQ) with minimum and maximum range and statistically compared between both groups. Student’s t-test, ** p < 0.01. The mean value of the expression levels of succinate dehydrogenase complex, subunit A (SDHA), TATA box-binding protein (TBP), and tyrosine 3-monooxygenase/tryptophan 5-monooxygenase activation protein, zeta polypeptide (YWHAZ) was used as endogenous control. Clinical information is listed in Table 1.
Figure 2
Figure 2
RITA’s gene expression is decreased in early-onset preeclampsia (PE) samples, in isolated primary trophoblasts and first trimester-derived cell lines under hypoxic conditions. (AB) Immunohistochemical staining of RITA in placental sections was analyzed. Comparison of RITA-positive cells between early-onset PE (25–33 weeks, n = 15) and matched controls (24–33 weeks, n = 16) (A), and between late-onset PE (34–40 weeks, n = 14) and matched controls (34–40 weeks, n = 19) (B). The results are presented as box and whisker plots with minimum and maximum variations. (C) Quantification of RITA in CTBs and STB using the H-score method. The results are presented as box and whisker plots with minimum and maximum variations. Clinical information is listed in Table 1. (DI) Gene analysis. (D) The relative amount of the gene RITA was determined in early-onset PE (25–33 weeks, n = 14) compared to matched control samples (26–33 weeks, n = 13). Student’s t-test, p = 0.057. (E) The relative amount of RITA is significantly reduced in placentas derived from patients with a body mass index (BMI) below 25 (n = 8) relative to controls (n = 6). Student’s t-test, * p < 0.05. (F) The relative amount of placental RITA in late-onset PE (34–40 weeks, n = 15) compared to the matched controls (34–40 weeks, n = 18). The results are presented as relative quantification (RQ) with minimum and maximum range and statistically analyzed between both groups. Clinical information is listed in Table 1. The mean value of the expression levels of three housekeeping genes succinate dehydrogenase complex, subunit A (SDHA), tyrosine 3-monooxygenase/tryptophan 5-monooxygenase activation protein, zeta polypeptide (YWHAZ), and TATA box-binding protein (TBP) was used as endogenous controls. (G) Isolated primary cytotrophoblasts were grown under normoxia (21.4% O2) and hypoxia (1% O2) for 48 h prior to RNA extraction. The gene level of RITA was evaluated (n = 2, each in duplicates). Glyceraldehyde-3-phosphate dehydrogenase (GAPDH) served as housekeeping gene control. Student’s t-test, ** p < 0.01. (HI) Gene analysis of RITA depending on the O2 level (normoxia, 21.4% O2 versus hypoxia, 1% O2). HTR (H) and SGHPL-4 (I) cells were harvested after 48 h. The gene level of RITA was measured (n = 4, each in triplicates). GAPDH was used as housekeeping gene control. Student’s t-test, * p < 0.05, *** p < 0.001.
Figure 3
Figure 3
Expression and localization of RITA in various trophoblastic cell lines. (A) The relative amount of the gene RITA in diverse trophoblastic cell lines. The results are presented as relative quantification (RQ) with minimum and maximum range, by setting the RITA value of BeWo cells as 1. (B) Western blot analysis with cellular extracts from HTR, BeWo, Jar, and JEG-3 using an antibody against RITA. β-actin served as loading control. (C) HTR and BeWo cells were transfected with GFP-RITA and stained for the microtubule marker acetylated α-tubulin and DNA (4’,6-diamidino-2-phenylindole-dihydrochloride (DAPI)). Representatives of the subcellular localization of RITA are shown. First and second row scale: 10 µm, third and fourth row scale: 5 µm.
Figure 4
Figure 4
RITA is required for cell motility and invasion of trophoblastic cells. (A) Working schedule for time-lapse microscopy. HTR cells were treated with control small interfering RNA (siRNA) (sicon), siRNA against the coding region of RITA (siRITA), or its untranslated region (siUTR) for time-lapse microscopy to analyze their random motility. (B) Representative trajectories of individual cells (n = 30) are shown. (CE) Results of the accumulated distance (C), velocity (D), and directionality (E) are presented as box and whisker plots with minimum and maximum variations. Mann–Whitney U test, *** p < 0.001. (F) Control Western blot analysis was performed. GAPDH was used as loading control. (G) Working schedule for invasion assay. After seeding siRNA-treated cells (sicon or siRITA) into transwell systems, they were starved for 16 h. Then they were released into fresh medium for 24 h and fixated. (H) Invasion assay of HTR cells. The total number of invaded sicon cells was assigned as 100%. The results from three individual experiments are presented as mean ± standard error of the mean (SEM). Student’s t-test, *** p < 0.001. (I) Representative images of invaded HTR cells are shown. Scale: 20 μm. (J) Control Western blot analysis was performed. GAPDH served as loading control. (K) Invasion assay of SGHPL-4 cells. The total number of invaded sicon cells was assigned as 100%. The results from four independent experiments are presented as mean ± SEM. Student’s t-test, * p < 0.05. (L) Representative images of invaded SGHPL-4 cells are shown. Scale: 20 μm. (M) Gene analysis served as transfection efficiency control. GAPDH was used as housekeeping gene control. The gene expression of RITA is presented as relative quantification (RQ) with minimum and maximum range. Student’s t-test, *** p < 0.001. (N) Gene analysis of HTR cells treated with sicon or siRITA. Gene expression of RITA or matrix metalloproteinase 2 (MMP2) in HTR cells is presented as relative quantification (RQ) with minimum and maximum range. Student’s t-test, * p < 0.05. (O) Gene expression of RITA or MMP2 in MDA-MB-231 cells is presented as relative quantification (RQ) with minimum and maximum range. Student’s t-test, * p < 0.05. (P) Gene analysis of SGHPL-4 cells treated with sicon or siUTR. Gene expression of RITA or MMP2 is presented as relative quantification (RQ) with minimum and maximum range. Student’s t-test, ** p < 0.01.
Figure 5
Figure 5
Depletion of RITA leads to a reduction of fusion related genes in BeWo cells. (A) Working schedule for fusion assay. BeWo cells were transfected with control siRNA (sicon) or siRNA targeting RITA (siRITA) and then stimulated with forskolin (FSK) to induce cell fusion or vehicle control dimethyl sulfoxide (DMSO) up to 60 h. (B) Western blot analysis of treated cells with antibodies against RITA and chorionic gonadotropin subunit beta 3 (β-hCG). GAPDH was used as loading control. The ratios of β-hCG/GAPDH are shown. (CG) Gene analysis. The mRNA levels of RITA (C) and fusion-related glial cells missing transcription factor 1 (GCM1) (D), syncytin-1 (ERVW-1) (E), syncytin-2 (ERVFRD-1) (F) and β-hCG (CBG3) (G) are shown. The results are presented as relative quantification (RQ) with minimum and maximum range. Student’s t-test, * p < 0.05, ** p < 0.01, *** p < 0.001. (H) Level of secreted β-hCG. The supernatants of BeWo cells treated with FSK for 60 h were collected for the measurement of secreted β-hCG. The data from three independent experiments are presented as mean ± SEM. Student’s t-test, ** p < 0.01.
Figure 6
Figure 6
Suppression of RITA impairs the fusion rate of BeWo cells. BeWo cells were treated with control siRNA (sicon) or siRNA targeting RITA (siRITA) for 24 h and additionally with forskolin (FSK) or DMSO for indicated time periods. (A) Treated BeWo cells were fixated and stained for the fusion marker β-hCG (red) and DNA (DAPI, blue). Examples are shown. Scale: 25 µm. (B) The treated BeWo cells were stained for pan-cadherin (red) and DNA (DAPI, blue). Representative images are shown. Scale: 25 µm. (C) For microscopic evaluation and quantification of fused cells, the pan-cadherin (red) and DNA (DAPI, blue) staining were used. The results are displayed in percentages at indicated time periods. The results are shown as mean ± standard deviation (SD). Student’s t-test, ** p < 0.01, *** p < 0.001. (D) Western blot analysis using antibodies against RITA and GAPDH. GAPDH served as loading control.

References

    1. Roberts J.M., Hubel C.A. The two stage model of preeclampsia: Variations on the theme. Placenta. 2009;30(Suppl. A):S32–S37. doi: 10.1016/j.placenta.2008.11.009. - DOI - PMC - PubMed
    1. Steegers E.A., von Dadelszen P., Duvekot J.J., Pijnenborg R. Pre-eclampsia. Lancet. 2010;376:631–644. doi: 10.1016/S0140-6736(10)60279-6. - DOI - PubMed
    1. Sanchez-Aranguren L.C., Prada C.E., Riano-Medina C.E., Lopez M. Endothelial dysfunction and preeclampsia: Role of oxidative stress. Front. Physiol. 2014;5:372. doi: 10.3389/fphys.2014.00372. - DOI - PMC - PubMed
    1. Myatt L., Roberts J.M. Preeclampsia: Syndrome or Disease? Curr. Hypertens. Rep. 2015;17:83. doi: 10.1007/s11906-015-0595-4. - DOI - PubMed
    1. Robillard P.Y., Dekker G., Chaouat G., Scioscia M., Iacobelli S., Hulsey T.C. Historical evolution of ideas on eclampsia/preeclampsia: A proposed optimistic view of preeclampsia. J. Reprod. Immunol. 2017;123:72–77. doi: 10.1016/j.jri.2017.09.006. - DOI - PMC - PubMed

Publication types

MeSH terms

Substances

LinkOut - more resources