

Determinants of linear growth faltering among children with moderate-to-severe diarrhea in the Global Enteric Multicenter Study
- PMID: 31767012
- PMCID: PMC6878715
- DOI: 10.1186/s12916-019-1441-3
Determinants of linear growth faltering among children with moderate-to-severe diarrhea in the Global Enteric Multicenter Study
Abstract
Background: Moderate-to-severe diarrhea (MSD) in the first 2 years of life can impair linear growth. We sought to determine risk factors for linear growth faltering and to build a clinical prediction tool to identify children most likely to experience growth faltering following an episode of MSD.
Methods: Using data from the Global Enteric Multicenter Study of children 0-23 months old presenting with MSD in Africa and Asia, we performed log-binomial regression to determine clinical and sociodemographic factors associated with severe linear growth faltering (loss of ≥ 0.5 length-for-age z-score [LAZ]). Linear regression was used to estimate associations with ΔLAZ. A clinical prediction tool was developed using backward elimination of potential variables, and Akaike Information Criterion to select the best fit model.
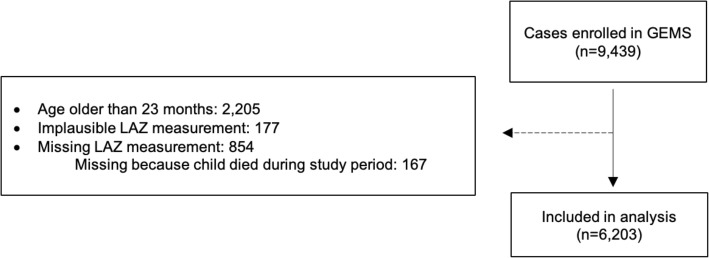
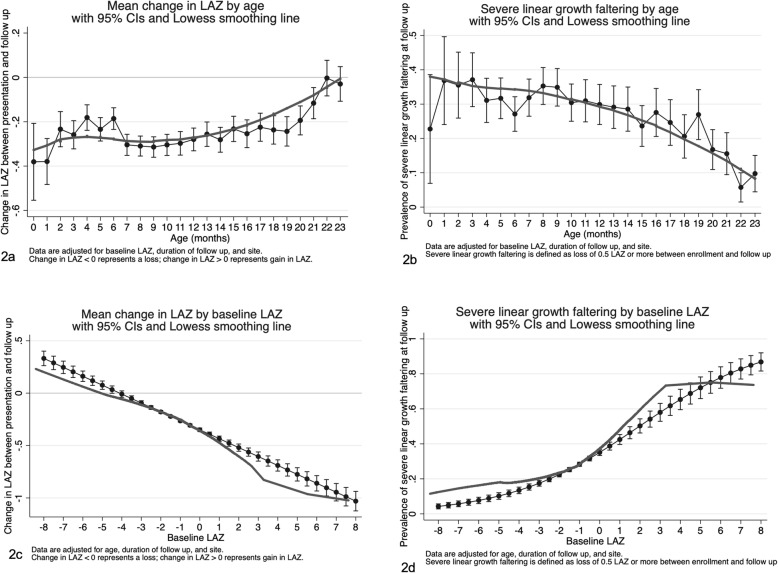
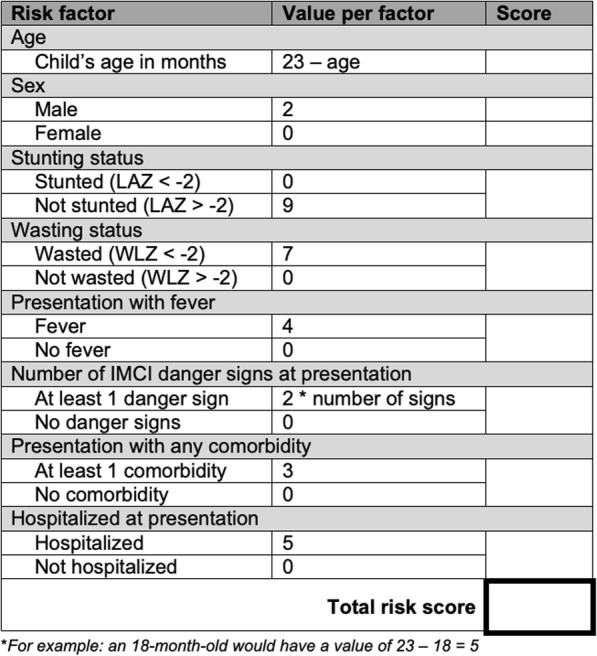
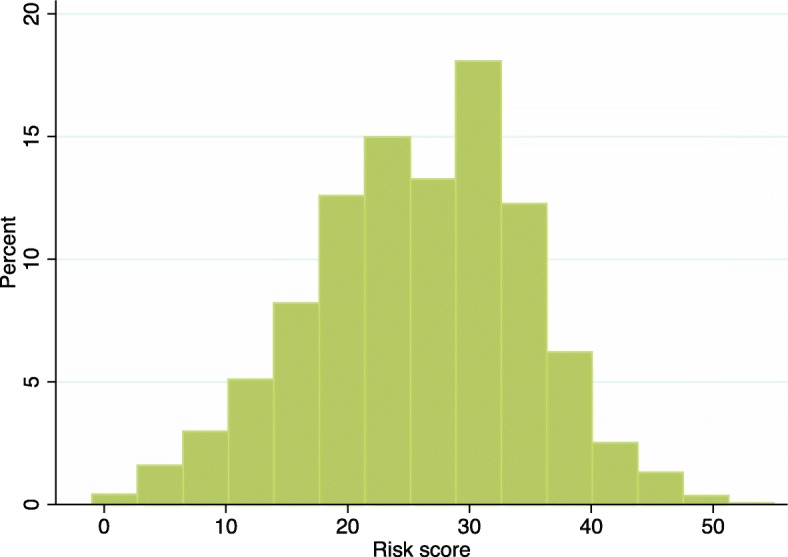
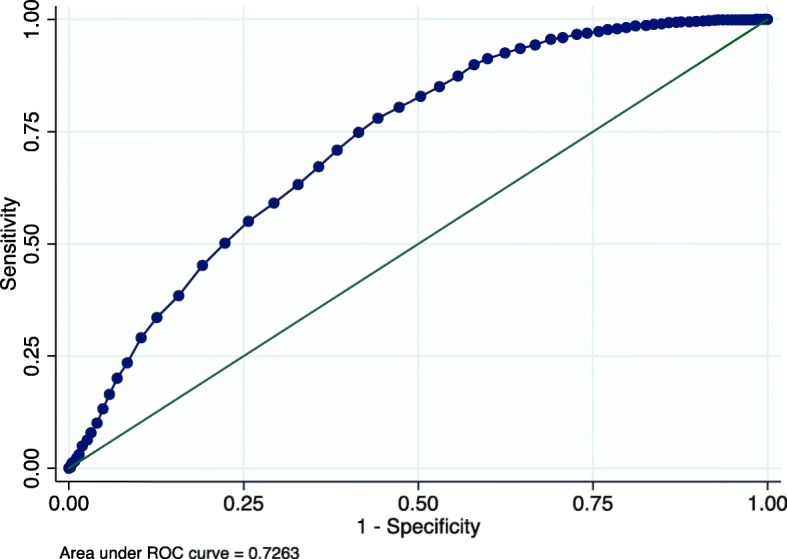
Results: Of the 5902 included children, mean age was 10 months and 43.2% were female. Over the 50-90-day follow-up period, 24.2% of children had severe linear growth faltering and the mean ΔLAZ over follow-up was - 0.17 (standard deviation [SD] 0.54). After adjustment for age, baseline LAZ, and site, several factors were associated with decline in LAZ: young age, acute malnutrition, hospitalization at presentation, non-dysenteric diarrhea, unimproved sanitation, lower wealth, fever, co-morbidity, or an IMCI danger sign. Compared to children 12-23 months old, those 0-6 months were more likely to experience severe linear growth faltering (adjusted prevalence ratio [aPR] 1.97 [95% CI 1.70, 2.28]), as were children 6-12 months of age (aPR 1.72 [95% CI 1.51, 1.95]). A prediction model that included age, wasting, stunting, presentation with fever, and presentation with an IMCI danger sign had an area under the ROC (AUC) of 0.67 (95% CI 0.64, 0.69). Risk scores ranged from 0 to 37, and a cut-off of 21 maximized sensitivity (60.7%) and specificity (63.5%).
Conclusion: Younger age, acute malnutrition, MSD severity, and sociodemographic factors were associated with short-term linear growth deterioration following MSD. Data routinely obtained at MSD may be useful to predict children at risk for growth deterioration who would benefit from interventions.
Keywords: Clinical prediction; Diarrhea sequelae; Diarrheal diseases; Growth retardation; Malnutrition; Nutritional deterioration; Stunting.
Conflict of interest statement
The authors declare that they have no competing interests.
Figures

References
-
- UNICEF/WHO/World Bank. Levels and trends in child malnutrition. In: Joint child malnutrition estimates, UNICEF/WHO/World Bank Group. 2017.
-
- WHO. WHO child growth standards: methods and development. Washington: World Health Organization Department of Nutrition for Health and Development; 2008. 10.4067/S0370-41062009000400012.
Publication types
MeSH terms
Grants and funding
LinkOut - more resources
Full Text Sources
Medical
Miscellaneous
