. 2019 Nov 26:8:e48646.
doi: 10.7554/eLife.48646.

Design of biochemical pattern forming systems from minimal motifs

Affiliations

Design of biochemical pattern forming systems from minimal motifs

Philipp Glock et al. Elife. .

Abstract

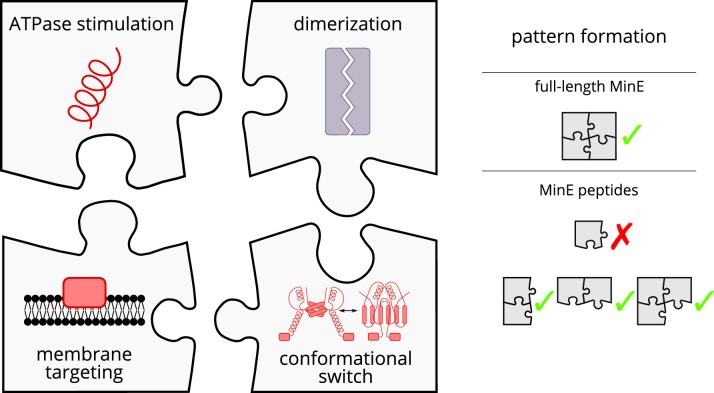
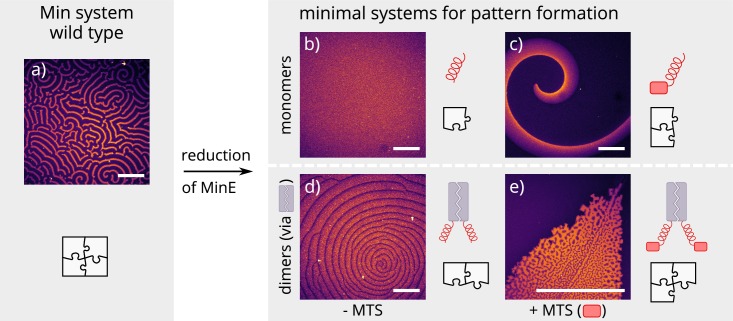
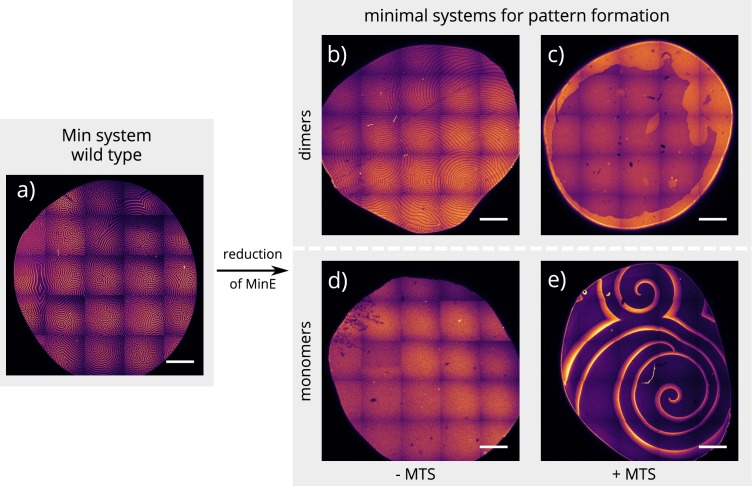
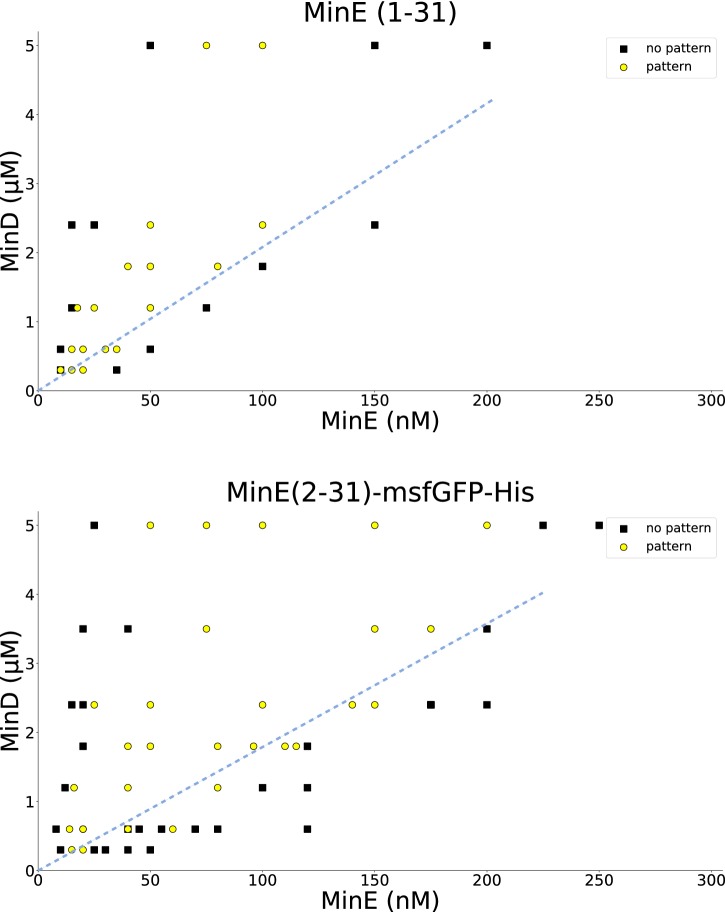
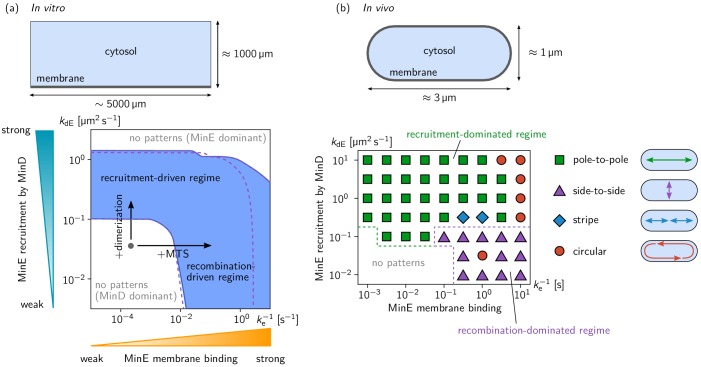
Although molecular self-organization and pattern formation are key features of life, only very few pattern-forming biochemical systems have been identified that can be reconstituted and studied in vitro under defined conditions. A systematic understanding of the underlying mechanisms is often hampered by multiple interactions, conformational flexibility and other complex features of the pattern forming proteins. Because of its compositional simplicity of only two proteins and a membrane, the MinDE system from Escherichia coli has in the past years been invaluable for deciphering the mechanisms of spatiotemporal self-organization in cells. Here, we explored the potential of reducing the complexity of this system even further, by identifying key functional motifs in the effector MinE that could be used to design pattern formation from scratch. In a combined approach of experiment and quantitative modeling, we show that starting from a minimal MinE-MinD interaction motif, pattern formation can be obtained by adding either dimerization or membrane-binding motifs. Moreover, we show that the pathways underlying pattern formation are recruitment-driven cytosolic cycling of MinE and recombination of membrane-bound MinE, and that these differ in their in vivo phenomenology.

Keywords: E. coli; in vitro reconstitution; min system; pattern formation; physics of living systems; reaction-diffusion; self-organization.


Conflict of interest statement

PG, FB, JH, EF, PS No competing interests declared

Figures

Figure 1.
Figure 1.. Schematic of the modular approach we took to engineering MinE in the in vitro Min system.
While MinE has the core function to stimulate MinD’s ATPase, three additional properties help MinE to facilitate the emergence of spatiotemporal patterns. We show that two of these properties, dimerization and membrane targeting, can be modularly added to a minimal MinE peptide to facilitate pattern formation.
Figure 2.
Figure 2.. Patterns formed by the wild-type Min system and our minimal biochemical interaction networks.
(a) MinD and MinE self-organize to form evenly spaced travelling waves when reconstituted on flat lipid bilayers. (b) The minimal MinE peptide capable of ATPase stimulation is MinE(13-31); it does not facilitate pattern formation. (c) The fragments MinE(1-31) and MinE(2-31)-sfGFP contain the membrane-targeting sequence (MTS) in addition to the ATPase stimulation domain. Substituting MinE with these constructs leads to pattern formation; see Figure 2—video 1–3. (d) Fusing the ATPase stimulation domain MinE(13-31) with dimerization domains (we tested Fos, Jun, or GCN-4) facilitates pattern formation in the absence of the MTS. (e) Combining membrane targeting and dimerization in a single construct produces quasi-stationary patterns. (Concentrations and proteins used: (a) 1 μM MinD, 6 μM MinE-His; (b) 1.2 μM MinD, 50 nM MinE(13-31); (c) 1.2 μM MinD, 50 nM MinE(1-31); scalebars = 300 μM; (d) 1 μM MinD, 100 nM MinE(13-31)-Fos; (e) 1.2 μM MinD, 100 nM MinE(1-31)-GCN4. In all assays, MinD is 70 % doped with 30 % Alexa647-KCK-MinD).
Figure 2—figure supplement 1.
Figure 2—figure supplement 1.. Global view of pattern formation by minimal systems.
Overview images of the same experiment chambers as in Figure 2. (Concentrations and proteins used same as in main figure; scalebars = 1000 μm).
Figure 2—figure supplement 2.
Figure 2—figure supplement 2.. Titration results for MinE(1-31) and MinE(2-31)-sfGFP.
MinD and the peptide MinE(1-31) or MinE(2-31)-sfGFP, respectively, were titrated to find the range in which patterns are formed. All experiments were done on SLBs consisting of DOPC:DOPG (2:1). Similar titrations for full-length MinE can be found in Glock et al. (2018a). Wild-type MinE generally forms patterns with MinD in a much larger range, going beyond 10 μM. Dashed blue lines were added by hand and highlight that there is a critical MinE-to-MinD concentration-ratio above which no patterns occur, in qualitative agreement with the theoretical results shown in Figure 3—figure supplement 2. A quantitative fit of the model to the threshold ratio of approximately 1/20 is shown in Figure 3—figure supplement 3.
Figure 3.
Figure 3.. Pattern forming capability of the extended Min model in vitro and in vivo.
(a) In vitro geometry and two-parameter phase diagram obtained by linear stability analysis, showing the pattern formation capabilities of the MinDE-system in dependence of MinE membrane-binding strength (ke-1) and MinE-recruitment rate kdE. The regime of spontaneous pattern formation (lateral instability) is indicated in blue. The gray circle represents minimal MinE(13-31) construct, which does not facilitate self-organized pattern formation. The experimental domain additions are accounted for by respective changes of the kinetic rates, as indicated by the arrows. (Parameters: see Materials and methods; blue region: regime of pattern formation for zero MinE attachment, kE=0; purple dashed lines: boundary of the pattern-formation regime for non-zero MinE attachment rate, kE = 5 μm s–1). (b) Two-parameter phase diagram obtained by numerical simulations in in vivo geometry. We find regimes of different oscillation pattern types: pole-to-pole oscillations (green squares); side-to-side oscillations (purple triangles); stripe oscillations (blue diamonds); and circular waves (red circles). Figure 3—videos 1–5 show examples each of these pattern types.
Figure 3—figure supplement 1.
Figure 3—figure supplement 1.. Network cartoon of the MinE ‘skeleton’ model extended by MinE membrane binding.
Figure 3—figure supplement 2.
Figure 3—figure supplement 2.. Phase diagrams in the parameter plane of total concentrations (nE, nD).
Phase diagrams in the parameter plane of total concentrations nE, nD at four points in the (ke-1,kdE) parameter plane. Note that in the three cases where a linearly unstable regime exists, there is critical ratio nD/nE above which there is instability. The red dot marks the concentrations (nE,nD)=(120,1200) µm s2 used in Figure 3a. (In all four cases, the MinE attachment rate was set to kE = 5 µm s1).
Figure 3—figure supplement 3.
Figure 3—figure supplement 3.. Phase diagrams showing how the range of MinE concentrations where the system is laterally unstable, depends on the MinE detachment rate and the MinE recruitment rate.
Phase diagrams showing how the range of MinE concentrations where the system is laterally unstable, depends on (a) the MinE detachment rate ke (at kdE=0) and (b) the MinE recruitment rate kdE (at ke-1=0, i.e. me=0). The MinD concentration is set to nD = 1000 µm–2. The inset in (a) shows the (nE,nD) phase diagram at kdE=0,ke=0.2s1, as an example for a parameter set that reproduces the experimentally found phase diagram for the MinE(1-31) mutant (cf. Figure 2—figure supplement 2). (The MinE attachment rate was set to kE = 5 µm s1.).
Figure 3—figure supplement 4.
Figure 3—figure supplement 4.. Linear stability analysis in the ellipse geometry.
Regions in the phase diagram are colored according to which eigenmode (green for pole-to-pole, purple for side-to-side mode) becomes unstable first for increasing cell size. Above the dashed purple line, the side-to-side mode grows faster at grown cell size (L = 4 µm). Typical relationships between cell size L and growth rate σ of the pole-to-pole mode (green line) and side-to-side mode (purple line) are shown for each parameter region. Comparison to the phase diagram from numerical simulations (Figure 3b) shows that the mode becoming unstable first, not the fastest growing mode at full cell size, predicts the axis selected by the fully developed pattern. .
Author response image 1.

Similar articles

Cited by

References

    1. Caspi Y, Dekker C. Mapping out min protein patterns in fully confined fluidic chambers. eLife. 2016;5:e19271. doi: 10.7554/eLife.19271. - DOI - PMC - PubMed
    1. Denk J, Kretschmer S, Halatek J, Hartl C, Schwille P, Frey E. MinE conformational switching confers robustness on self-organized min protein patterns. PNAS. 2018;115:4553–4558. doi: 10.1073/pnas.1719801115. - DOI - PMC - PubMed
    1. Downing BP, Rutenberg AD, Touhami A, Jericho M. Subcellular min oscillations as a single-cell reporter of the action of polycations, protamine, and gentamicin on Escherichia coli. PLOS ONE. 2009;4:e7285. doi: 10.1371/journal.pone.0007285. - DOI - PMC - PubMed
    1. Ernst O, Zor T. Linearization of the bradford protein assay. Journal of Visualized Experiments. 2010;38:e1918. doi: 10.3791/1918. - DOI - PMC - PubMed
    1. Gessele R, Halatek J, Frey E. PAR protein activation-deactivation cycles stabilize long-axis polarization in c. elegans. bioRxiv. 2018 doi: 10.1101/451880. - DOI

Publication types