

Phylodynamic analysis of HIV-1 subtypes B, C and CRF 02_AG in Senegal
- PMID: 31767497
- PMCID: PMC10066795
- DOI: 10.1016/j.epidem.2019.100376
Phylodynamic analysis of HIV-1 subtypes B, C and CRF 02_AG in Senegal
Abstract
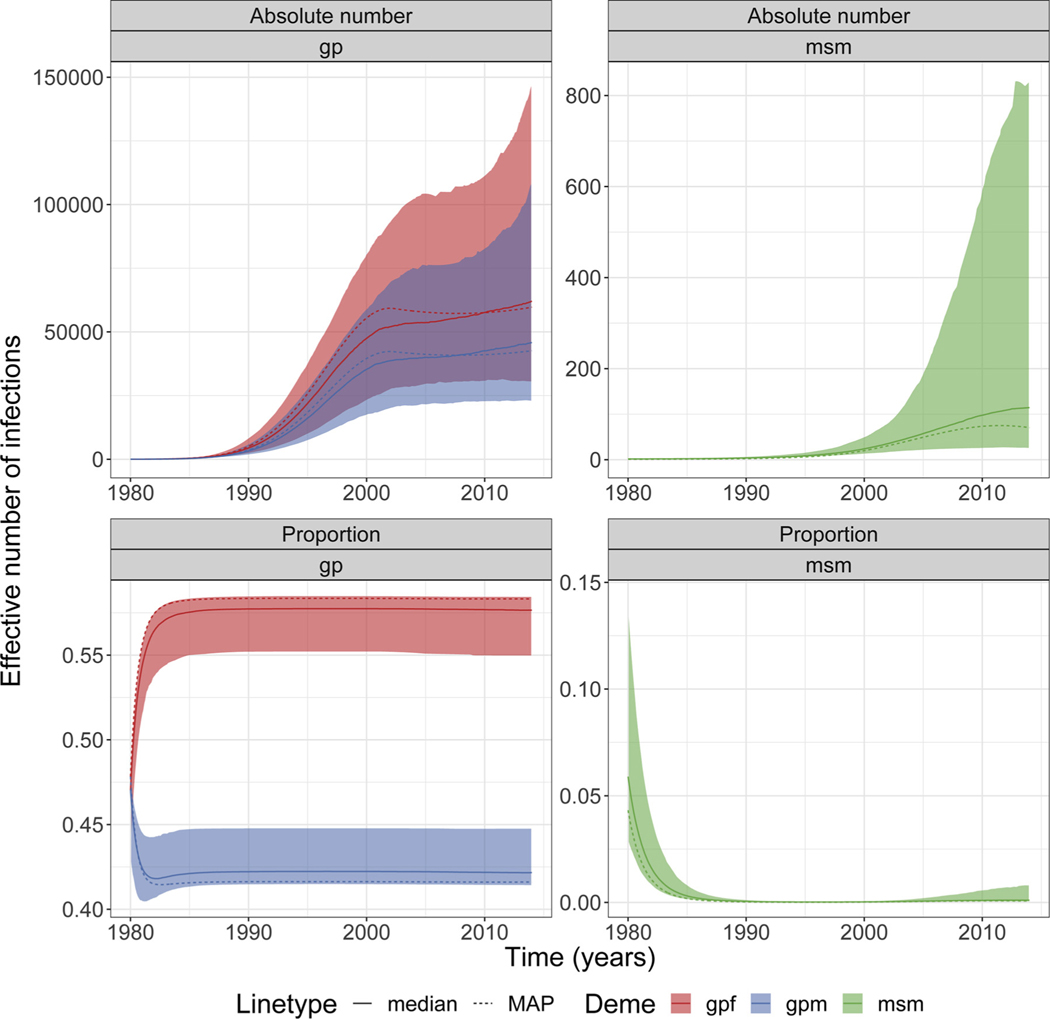
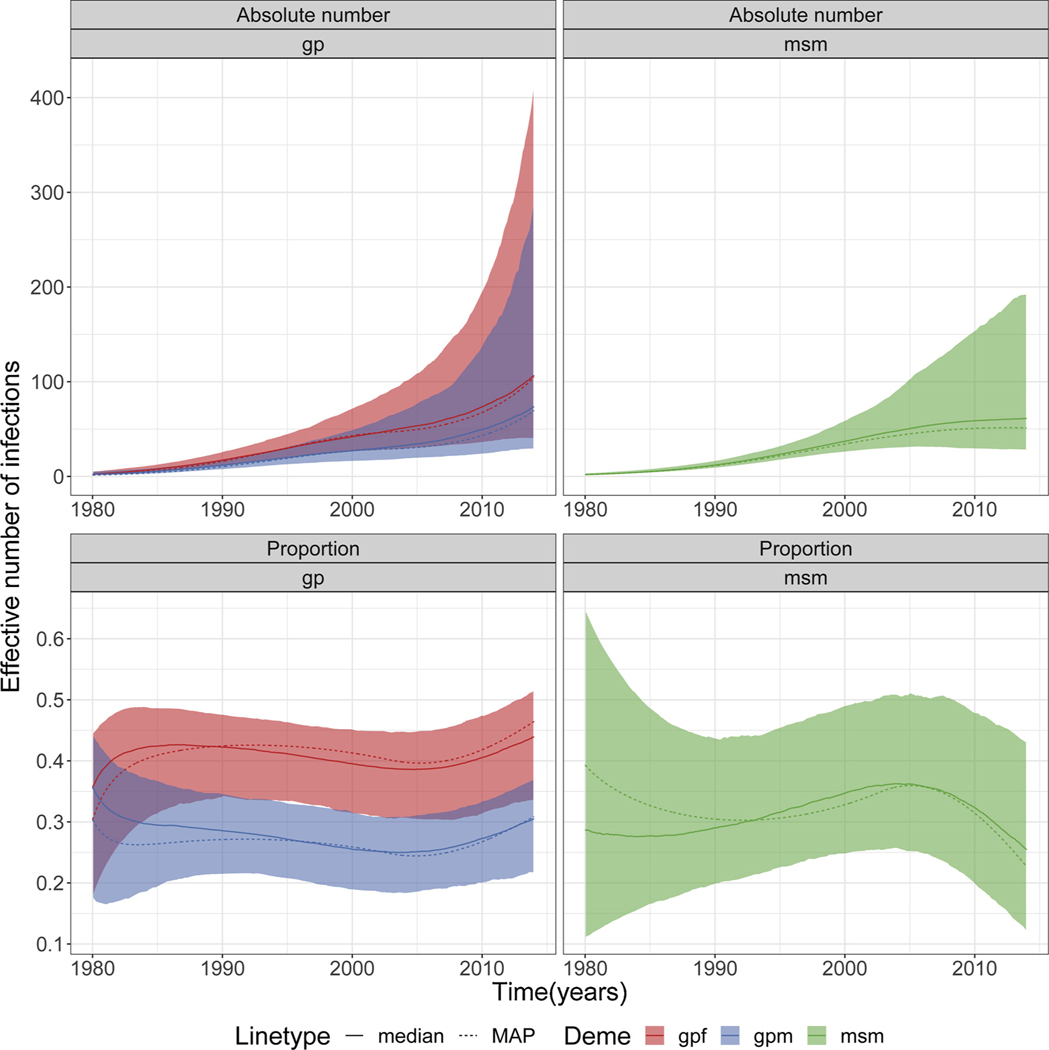
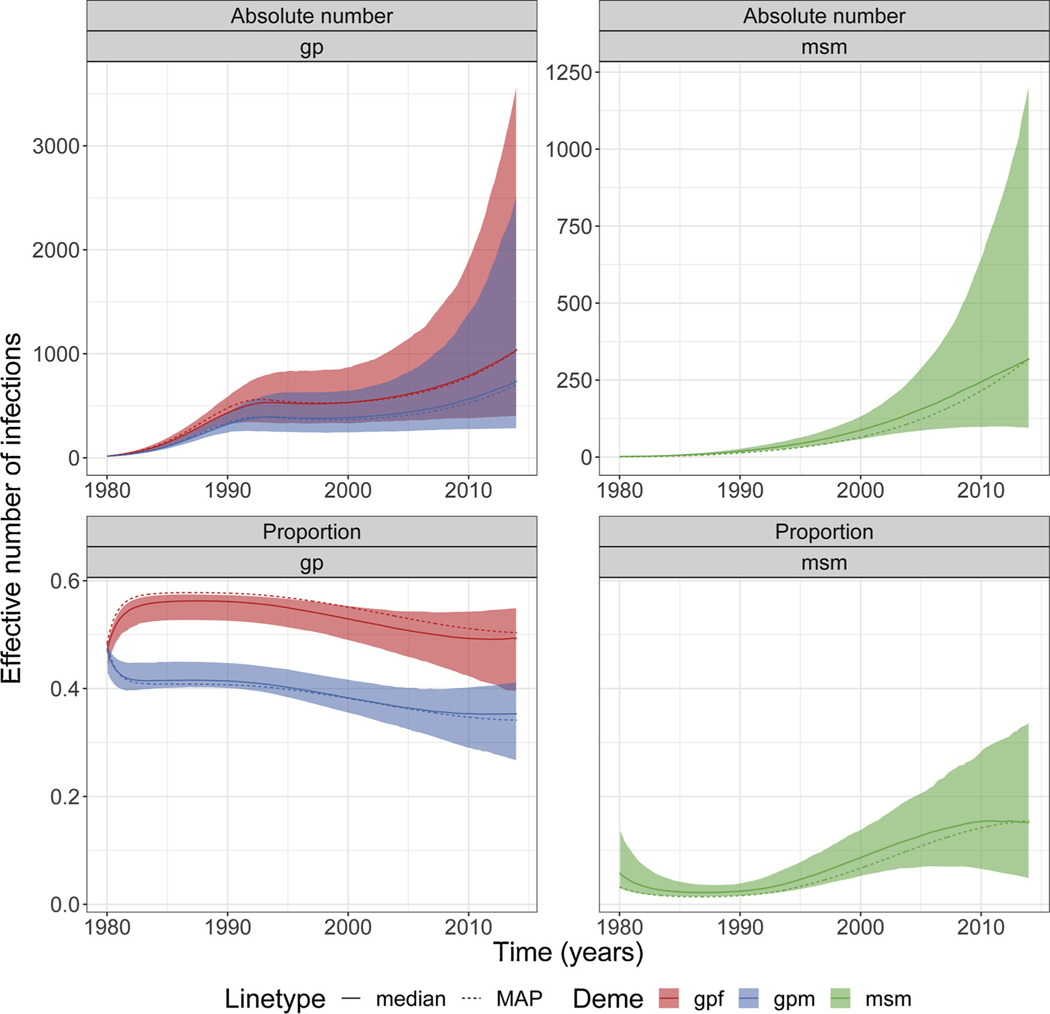
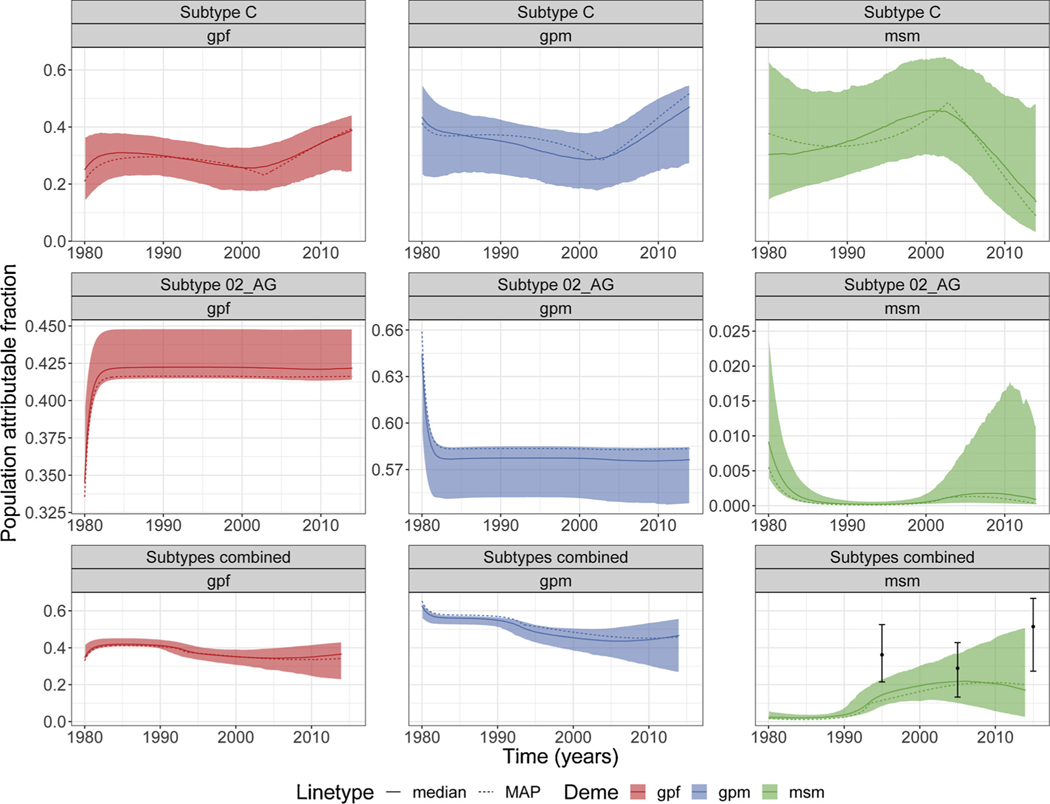
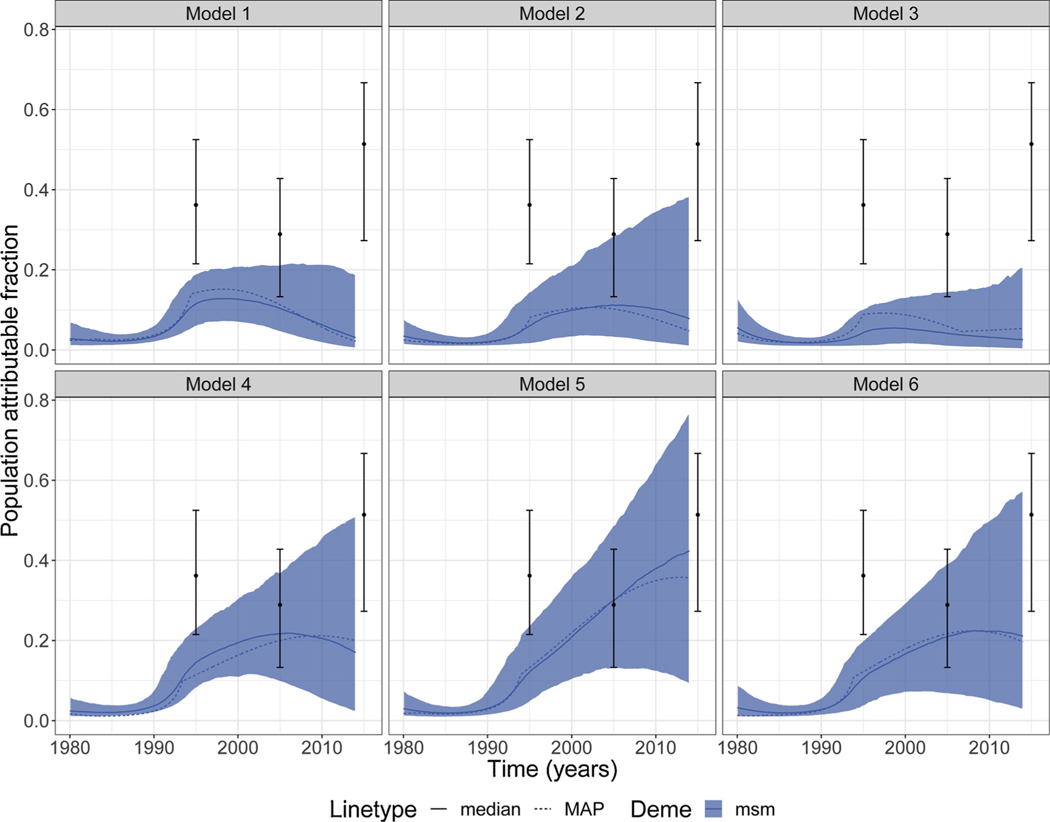
Surveillance of HIV epidemics in key populations and in developing countries is often challenging due to sparse, incomplete, or low-quality data. Analysis of HIV sequence data can provide an alternative source of information about epidemic history, population structure, and transmission patterns. To understand HIV-1 dynamics and transmission patterns in Senegal, we carried out model-based phylodynamic analyses using the structured-coalescent approach using HIV-1 sequence data from three different subgroups: reproductive aged males and females from the adult Senegalese population and men who have sex with other men (MSM). We fitted these phylodynamic analyses to time-scaled phylogenetic trees individually for subtypes C and CRF 02_AG, and for the combined data for subtypes B, C and CRF 02_AG. In general, the combined analysis showed a decreasing proportion of effective number of infections among all reproductive aged adults relative to MSM. However, we observed a nearly time-invariant distribution for subtype CRF 02_AG and an increasing trend for subtype C on the proportion of effective number of infections. The population attributable fraction also differed between analyses: subtype CRF 02_AG showed little contribution from MSM, while for subtype C and combined analyses this contribution was much higher. Despite observed differences, results suggested that the combination of high assortativity among MSM and the unmet HIV prevention and treatment needs represent a significant component of the HIV epidemic in Senegal.
Keywords: Coalescent; HIV; Key populations; Phylodynamics.
Copyright © 2019 The Authors. Published by Elsevier B.V. All rights reserved.
Conflict of interest statement
Conflict of interest
The authors do not have any conflicts of interest.
Figures
References
-
- Altschul SF, Gish W, Miller W, Myers EW, Lipman DJ, 1990. Basic local alignment search tool. J. Mol. Biol 215 (3), 403–410. - PubMed
-
- Anderson RM, May RM, 1991. Infectious Diseases of Humans: Dynamics and Control. Oxford Science Publications Oxford University Press, Oxford.
-
- Diop-Ndiaye H, Toure-Kane C, Leye N, Ngom-Gueye NF, Montavon C, Peeters M, Mboup S, 2010. Antiretroviral drug resistance mutations in antiretroviral-naive patients from Senegal. AIDS Res. Hum. Retrovir 26 (10), 1133–1138. - PubMed
Publication types
MeSH terms
Grants and funding
LinkOut - more resources
Full Text Sources
Medical
