Comment
. 2020 Mar 15;80(6):1258-1267.
doi: 10.1158/0008-5472.CAN-19-0638. Epub 2019 Nov 25.

Localized Metabolomic Gradients in Patient-Derived Xenograft Models of Glioblastoma

Affiliations
Comment

Localized Metabolomic Gradients in Patient-Derived Xenograft Models of Glioblastoma

Elizabeth C Randall et al. Cancer Res. .

Abstract

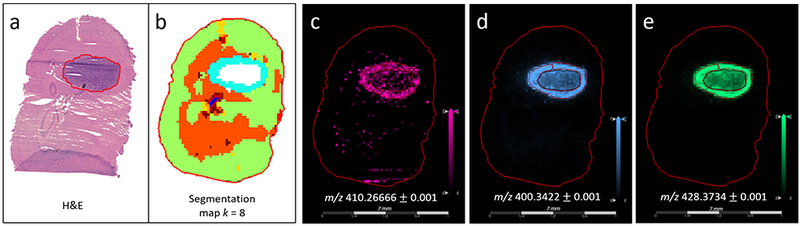
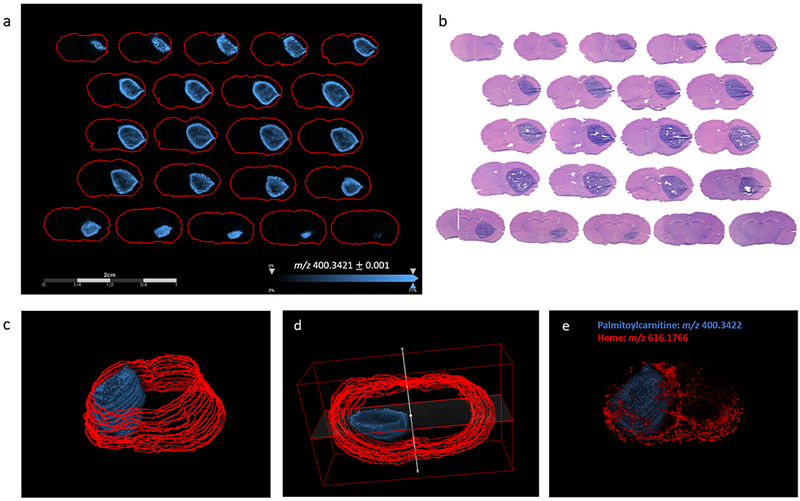
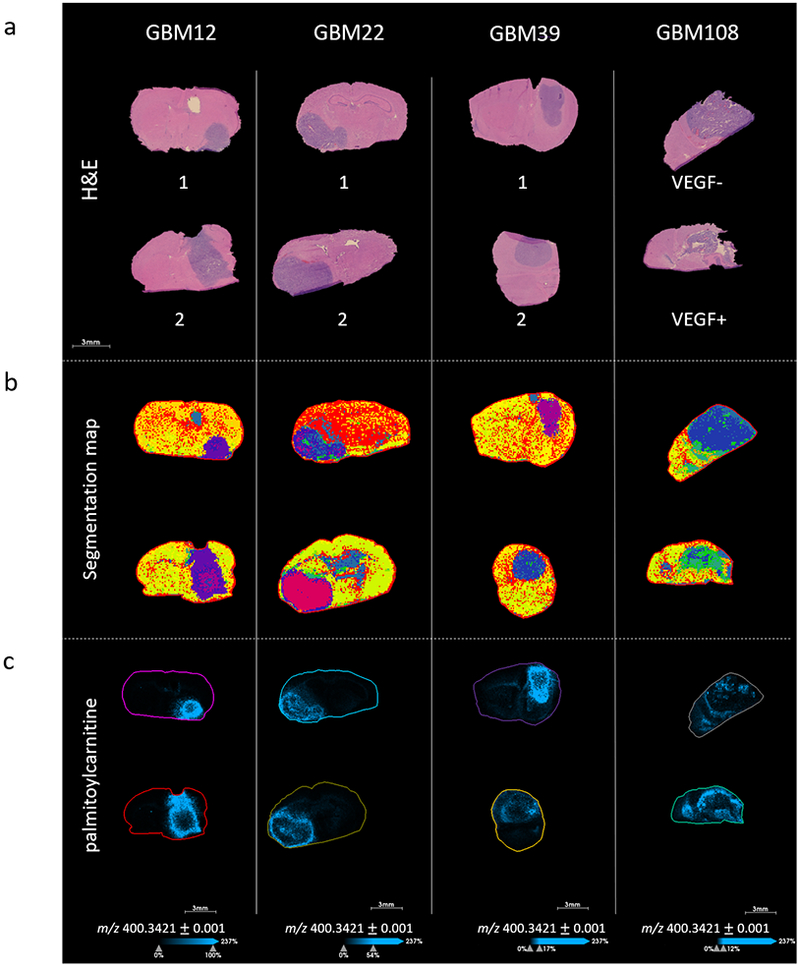
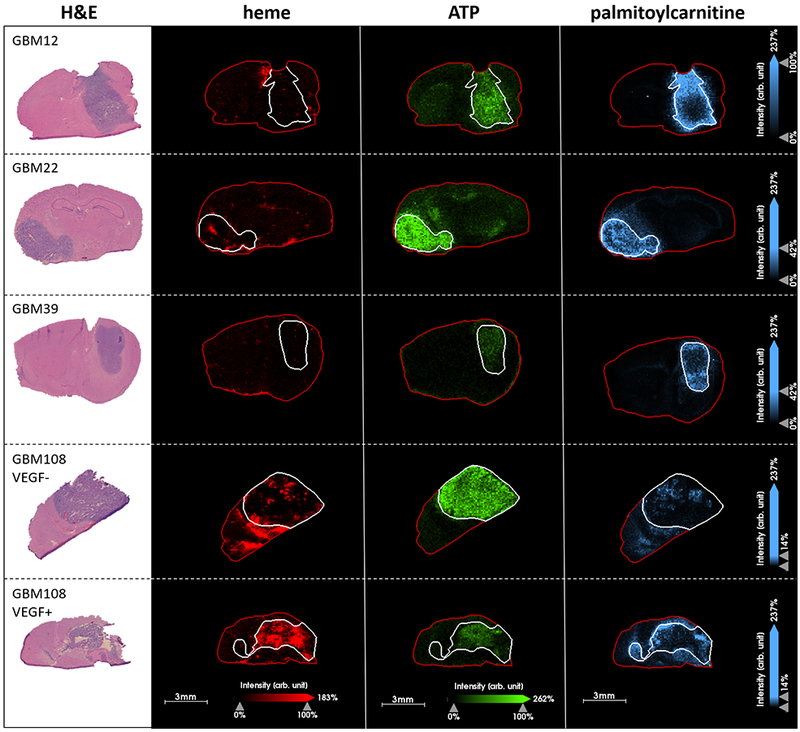
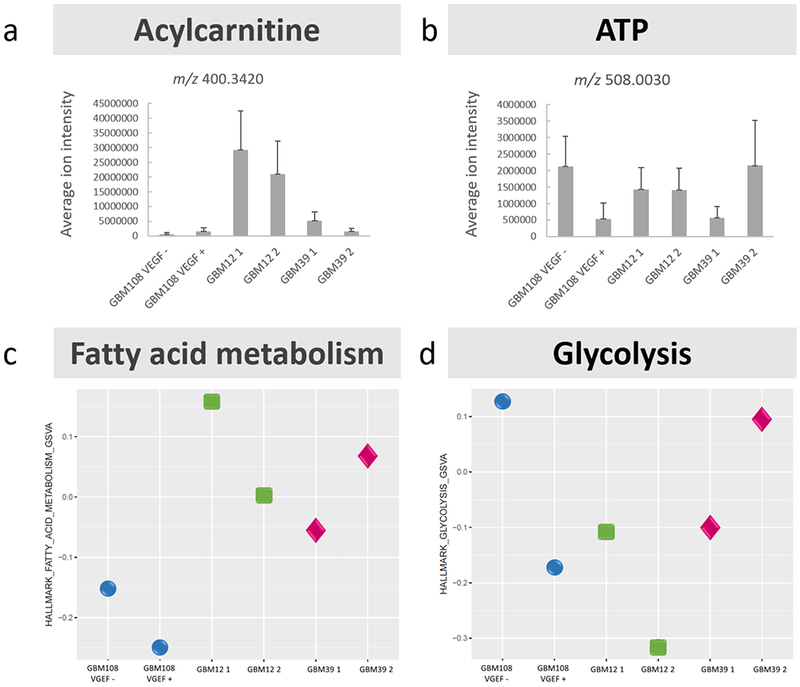
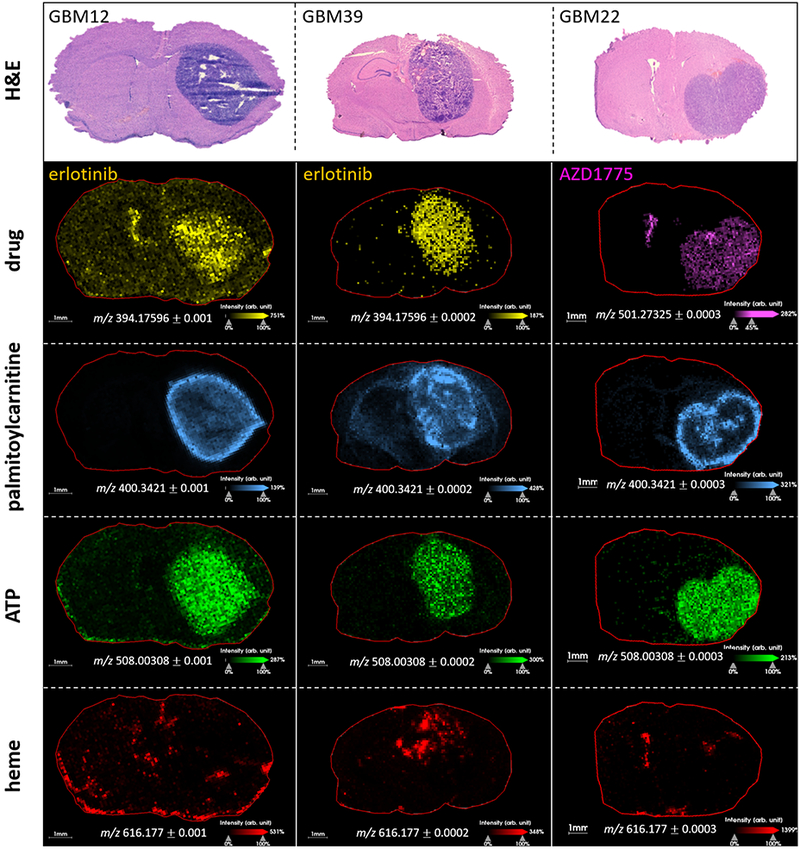
Glioblastoma (GBM) is increasingly recognized as a disease involving dysfunctional cellular metabolism. GBMs are known to be complex heterogeneous systems containing multiple distinct cell populations and are supported by an aberrant network of blood vessels. A better understanding of GBM metabolism, its variation with respect to the tumor microenvironment, and resulting regional changes in chemical composition is required. This may shed light on the observed heterogeneous drug distribution, which cannot be fully described by limited or uneven disruption of the blood-brain barrier. In this work, we used mass spectrometry imaging (MSI) to map metabolites and lipids in patient-derived xenograft models of GBM. A data analysis workflow revealed that distinctive spectral signatures were detected from different regions of the intracranial tumor model. A series of long-chain acylcarnitines were identified and detected with increased intensity at the tumor edge. A 3D MSI dataset demonstrated that these molecules were observed throughout the entire tumor/normal interface and were not confined to a single plane. mRNA sequencing demonstrated that hallmark genes related to fatty acid metabolism were highly expressed in samples with higher acylcarnitine content. These data suggest that cells in the core and the edge of the tumor undergo different fatty acid metabolism, resulting in different chemical environments within the tumor. This may influence drug distribution through changes in tissue drug affinity or transport and constitute an important consideration for therapeutic strategies in the treatment of GBM. SIGNIFICANCE: GBM tumors exhibit a metabolic gradient that should be taken into consideration when designing therapeutic strategies for treatment.See related commentary by Tan and Weljie, p. 1231.


Conflict of interest statement

Conflict of Interest: N.Y.R.A. is a scientific advisor to BayesianDx and inviCRO.

Figures

Fig. 1
Fig. 1
MALDI MSI analysis of intracranial GBM12 PDX model: a) H&E stained serial tissue section demonstrating highly cellular tumor region, b) segmentation map of MALDI MSI data produced via bisecting k-means clustering (k = 8), whereby different clusters are labelled with different colors, and two separate clusters are indicated within the tumor region indicating spectral differences between these regions, c-e) MALDI MSI ion images of three different long chain acylcarnitines: c) myristoylcarnitine: m/z 410.2666, detected as [M+K]+ , d) palmitoylcarnitine: m/z 400.3422, detected as [M+H]+ , and e) stearoylcarnitine: m/z 428.3734, detected as [M+H]+ .
Fig. 2
Fig. 2
3D MALDI MSI of intracranial GBM12 PDX model, a) MALDI MSI ion images of m/z 400.3421 corresponding to palmitoylcarnitine in sequential coronal tissue sections taken in increments of 160 μm in the z-dimension throughout the tumor-containing portion of the mouse brain, b) serial tissue sections to those used for MALDI MSI stained with H&E, indicating the highly cellular tumor region, (c & d) 3D reconstructions of images shown in panel (a), shown from different elevations, and e) overlaid with ions of heme (m/z 616.1766) demonstrating the distribution of palmitoylcarnitine relative to the vasculature. NB red lines in panel c and d indicate the outer boundary of tissue sections, whereas in panel e red represents heme signature.
Fig. 3
Fig. 3
MALDI MSI of GBM12, GBM22, GBM39 and GBM108 intracranial PDX models, a) H&E stained serial sections, b) segmentation map of MALDI MSI data, produced via bisecting k-means clustering (k = 8), c) MALDI MSI ion images of palmitoylcarnitine (m/z 400.3420) in the four GBM PDX models (n=2) showing the relative distribution of long chain acylcarnitines.
Fig. 4
Fig. 4
MALDI MSI of GBM12, GBM22, GBM39 and GBM108 intracranial PDX models with H&E stained serial sections, comparison of distribution of heme (m/z 616.1766, shown in red) indicating the localization of the vasculature, ATP (m/z 508.0030, shown in green) and palmitoylcarnitine (m/z 400.3420, shown in blue).
Figure 5.
Figure 5.
Comparison of MALDI FT-ICR MSI and transcriptomics data; a-b) Graphs depicting average (mean) ion intensity of m/z 400.3420 and 508.0030 respectively, over the tumor region in each patient-derived xenograft model of glioblastoma, detected by MALDI FT-ICR MSI, error bars represent 1 standard deviation of the mean, c) GSVA plot of HALLMARK genes for fatty acid metabolism in the same set of GBM PDX models, d) GSVA plot of HALLMARK genes for glycolysis. In general, models associated with high levels of acylcarnitine by MALDI MSI have higher expression of hallmark genes for fatty acid metabolism (GBM12) and models/samples with higher levels of ATP measured by MALDI MSI have higher expression of hallmark genes for glycolysis (GBM108 VEGF - and GBM39 2).
Fig. 6
Fig. 6
Distribution of drugs (erlotinib: m/z 394.1770 and AZD1775: m/z 501.2733) relative to palmitoylcarnitine (m/z 400.3421), ATP (m/z 508.0031), heme (m/z 616.1766) and H&E images of serial sections. Higher intensity of both drugs was detected in the tumor regions of all PDX models. In GBM12, lower erlotinib intensity is detected at the tumor edge, correlating with regions of high acylcarnitine content. A similar inverse relationship between palmitoylcarnitine and erlotinib was observed in GBM39. AZD1775 was detected relatively homogeneously throughout the tumor, including at the tumor edge, where acylcarnitine intensity was high. ATP was detected with increased intensity in tumor regions of all PDX models, and with an inverse distribution to palmitoylcarnitine.

Comment in

Comment on

References

    1. Lin H, et al. (2017) Fatty acid oxidation is required for the respiration and proliferation of malignant glioma cells. Neuro Oncol 19(1):43–54. - PMC - PubMed
    1. van Tellingen O, et al. (2015) Overcoming the blood–brain tumor barrier for effective glioblastoma treatment. Drug Resist Updat 19:1–12. - PubMed
    1. Wang N, Jain RK, Batchelor TT (2017) New Directions in Anti-Angiogenic Therapy for Glioblastoma. Neurotherapeutics:1–12. - PMC - PubMed
    1. Anjum K, et al. (2017) Current status and future therapeutic perspectives of glioblastoma multiforme (GBM) therapy: A review. Biomed Pharmacother 92:681–689. - PubMed
    1. Randall EC, et al. (2018) Integrated mapping of pharmacokinetics and pharmacodynamics in a patient-derived xenograft model of glioblastoma. Nat Commun 9(1):4904. - PMC - PubMed

Publication types