. 2019 Dec 10;116(50):25343-25354.
doi: 10.1073/pnas.1911694116. Epub 2019 Nov 25.

HISTONE DEACETYLASE 9 stimulates auxin-dependent thermomorphogenesis in Arabidopsis thaliana by mediating H2A.Z depletion

Affiliations

HISTONE DEACETYLASE 9 stimulates auxin-dependent thermomorphogenesis in Arabidopsis thaliana by mediating H2A.Z depletion

Lennard C van der Woude et al. Proc Natl Acad Sci U S A. .

Abstract

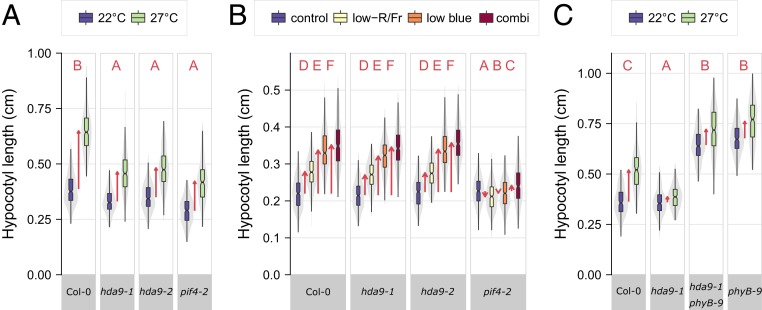
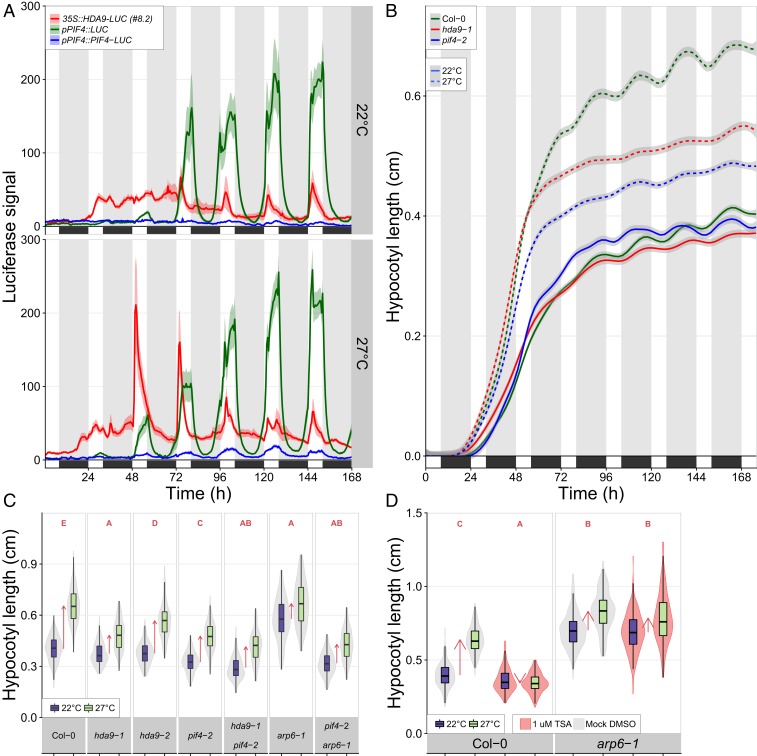
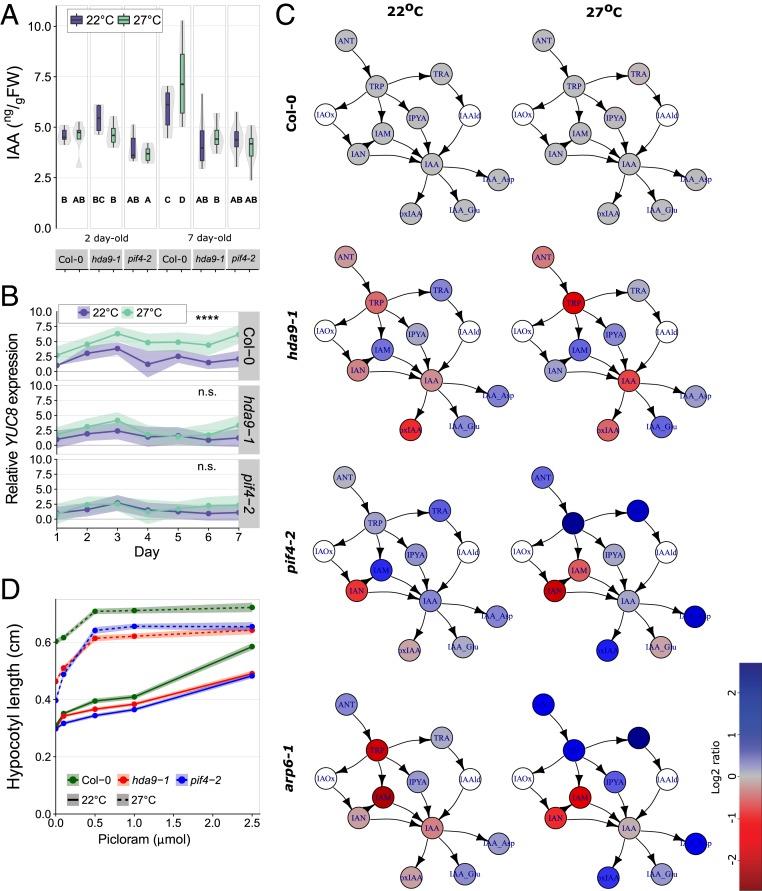
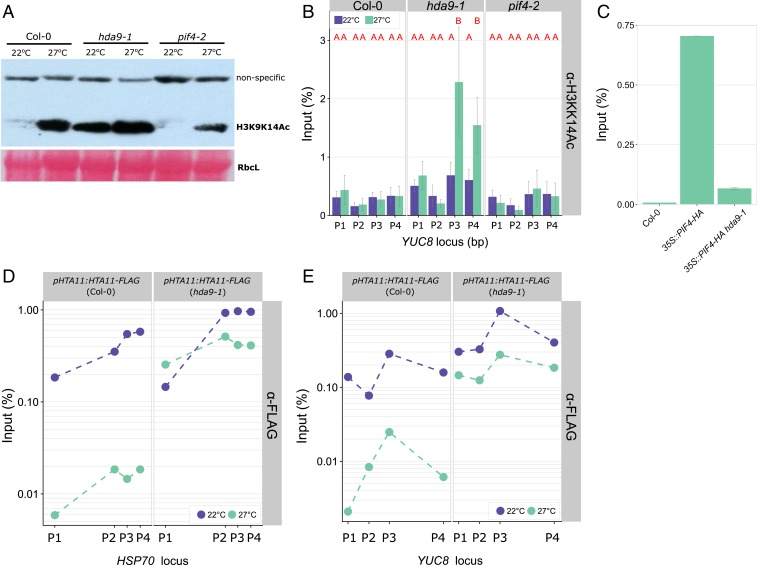
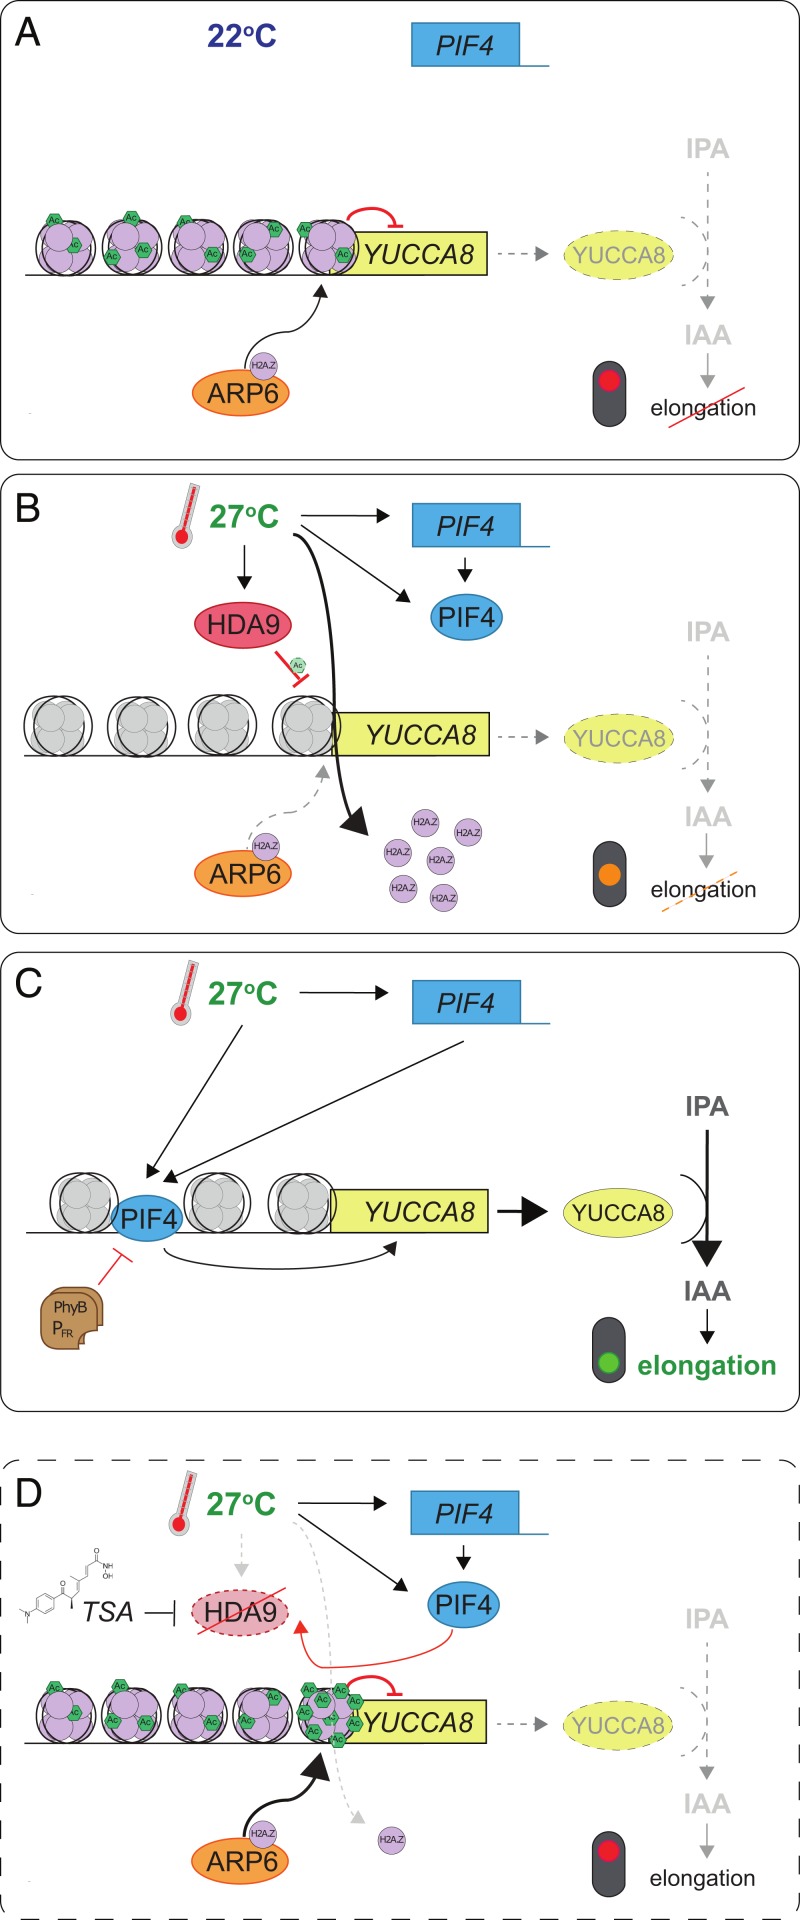
Many plant species respond to unfavorable high ambient temperatures by adjusting their vegetative body plan to facilitate cooling. This process is known as thermomorphogenesis and is induced by the phytohormone auxin. Here, we demonstrate that the chromatin-modifying enzyme HISTONE DEACETYLASE 9 (HDA9) mediates thermomorphogenesis but does not interfere with hypocotyl elongation during shade avoidance. HDA9 is stabilized in response to high temperature and mediates histone deacetylation at the YUCCA8 locus, a rate-limiting enzyme in auxin biosynthesis, at warm temperatures. We show that HDA9 permits net eviction of the H2A.Z histone variant from nucleosomes associated with YUCCA8, allowing binding and transcriptional activation by PHYTOCHROME INTERACTING FACTOR 4, followed by auxin accumulation and thermomorphogenesis.

Keywords: Arabidopsis; H2A.Z; HDA9; shade avoidance; thermomorphogenesis.


Conflict of interest statement

The authors declare no competing interest.

Figures

Fig. 1.
Fig. 1.
Mutations in HDA9 impair thermomorphogenesis independent of light-quality signaling and phyB. (AC) Hypocotyl lengths of 8-d-old seedlings at (A and C) 22 °C or 27 °C and (B) different light-quality conditions and their combination. Boxes indicate boundaries of second and third quartiles of data distributions. Black bars indicate median and whiskers Q1 and Q4 values within 1.5 times the interquartile range. Violin plots designate phenotype distributions. Red arrows designate mean hypocotyl elongation responses. Red letters indicate statistical differences between hypocotyl responses (changes) in all panels (P < 0.05; 2-sided t test) (Dataset S1), with different letters indicating significantly different groups. (AC) n = 208 to 295, 247 to 323, 131 to 236 seedlings per genotype and treatment, divided over 7, 12, 7, biological replicates, respectively.
Fig. 2.
Fig. 2.
HDA9, PIF4, and ARP6/H2A.Z present a thermosignaling module. (A) Dynamics of HDA9 and PIF4 protein and PIF4 transcript levels. n = 6 to 19 per genotype. See SI Appendix, Fig. S3 for details. (B) Progression of hypocotyl elongation. n = 110 to 212 seedlings per genotype, per treatment, divided over 32 replicates. Statistics (Tukey HSD per time point, genotype, and treatment) are presented in SI Appendix, Fig. S4A and Dataset S1. (A and B) Colored areas behind lines represent SEM. Black boxes and gray-shaded bands/white bands indicate darkness/daytime. (C and D) Hypocotyl lengths of 8-d-old seedlings in D, the presence of TSA and mock. (C) n = 157 to 324 and (D) n = 157 to 324 seedlings per genotype and treatment, divided over 7 (C) and 9 (D) replicates. Boxes indicate boundaries of second and third quartiles of data distributions. Black bars indicate median and whiskers Q1 and Q4 values within 1.5 times the interquartile range. Violin plots designate phenotype distributions. Red arrows indicate the mean hypocotyl response. Red letters in C and D indicate statistical differences between hypocotyl responses (changes) (P < 0.01; 2-sided t test), with different letters indicating significantly different groups.
Fig. 3.
Fig. 3.
HDA9 is required for YUCCA8-dependent auxin biosynthesis. (A) IAA levels. Boxes indicate boundaries of second and third quartiles of data distributions. Black bars indicate median and whiskers Q1 and Q4 values within 1.5 times the interquartile range. Violin plots designate phenotype distributions. Bold letters indicate statistical differences between IAA levels over all samples (P < 0.05; Tukey HSD), n = 4 to 10 replicas per genotype per treatment per time point, each of 100 mg (FW) seedlings. (B) Relative YUCCA8 expression, 3 to 4 replicas per genotype, per treatment, per timepoint, each of >25 seedlings. Asterisks indicate significant difference on the range of time points between 22 °C and 27 °C (****P < 0.001, n.s. indicates nonsignificant; 2-sided t test). For statistical comparisons of individual time points, see Dataset S1. (C) Auxin metabolite levels, normalized to Col-0 wild-type. White symbols indicate not detectable. See SI Appendix, Fig. S8 for details and abbreviations of metabolites. n = 4 replicates per genotype and treatment, each of 10 mg (FW) of 2-d-old seedlings. (D) Hypocotyl lengths of 8-d-old seedlings in the presence of different concentrations Picloram, n = 104 to 132 seedlings per genotype per treatment divided over 4 replicates. See Dataset S1 for comparative statistics. (B and D) Colored areas behind the lines represent SEM.
Fig. 4.
Fig. 4.
HDA9 permits H2A.Z eviction. (A) Western blot analysis of H3K9K14ac levels of 2-d-old seedlings at 22 °C or 27 °C (50-mg pooled seedlings per genotype and treatment). Ponceau staining of RIBULOSE BIPHOSPHATE CARBOXYLASE LARGE CHAIN (RbcL) is shown as loading control. (BE) ChIP-qPCR analysis of (B) H3K9K14Ac levels, (C) PIF4 binding to the G-Box motif and (D and E) H2A.Z (HTA11) enrichment at (B, C, and E) YUCCA8 and (D) HSP70 loci, in 2-d-old seedlings of indicated genotypes. Tested chromatin regions are (B and E) P1 (−1,374 bp), P2 (−657 bp), P3 (4 bp) and P4 (1,813 bp) and (D) P1 (−359 bp), P2 (4 bp), P3 (80 bp), and P4 (159 bp) relative to the transcriptional start site and are from refs. and . (B) n = 4 and (E) n = 2, independent replicates of pooled seedlings (SI Appendix, Fig. S9B), error bars represent SEM. (B) Red letters indicate statistical differences on input fraction per tested position (P < 0.05; Tukey HSD).
Fig. 5.
Fig. 5.
Schematic model of proposed HDA9-mediated thermomorphogenesis regulation in 2 d-old seedlings. (A) At control temperatures, PIF4 expression (blue box) is limited and nucleosomes associated with YUCCA8 (yellow box) contain high levels of H2A.Z (purple circles), deposited by ARP6 (orange ellipse). Therefore, auxin (IAA) levels are low and elongation growth is repressed (dashed lines; red traffic light). (B) When temperatures rise, HDA9 protein (red ellipse) levels are high during day time, resulting in maintenance of a low acetylation level at high temperature, comparable to control temperature levels at the YUCCA8 locus. This facilitates the warm-temperature–induced eviction of H2A.Z from nucleosomes (gray nucleosomes) over ARP6-mediated deposition, providing a net permissive chromatin environment (orange traffic light). At the same time, PIF4 levels rise independently of HDA9 and (C) subsequently bind the G-Box motif in the YUCCA8 promoter. This triggers YUC8 accumulation, followed by turnover of IPyA to IAA, which induces elongation growth (green traffic light). Thermosensing by photo-activated Phytochrome B (PhyB-PFR; brown rectangles) inhibits PIF4 activity by a parallel mechanism. (D) When HDA9 is inactivated by mutation or TSA application, YUCCA8 is hyperacetylated at warm temperatures. This shifts the balance from net H2A.Z eviction to net deposition. As a result, PIF4 cannot efficiently bind the YUCCA8 promoter and IAA accumulation is prohibited, resulting in attenuation of thermomorphogenesis, despite a permissive warm-temperature environment. Possible secondary effects of HDA9 on other regulators of YUC8 expression (e.g., transcriptional regulation of repressors) or HDA9-mediated deacetylation of nonhistone proteins are not illustrated in this model.

References

    1. Challinor A. J., et al. , A meta-analysis of crop yield under climate change and adaptation. Nat. Clim. Chang. 4, 287–291 (2014).
    1. Zhao C., et al. , Temperature increase reduces global yields of major crops in four independent estimates. Proc. Natl. Acad. Sci. U.S.A. 114, 9326–9331 (2017). - PMC - PubMed
    1. Crawford A. J., McLachlan D. H., Hetherington A. M., Franklin K. A., High temperature exposure increases plant cooling capacity. Curr. Biol. 22, R396–R397 (2012). - PubMed
    1. Quint M., et al. , Molecular and genetic control of plant thermomorphogenesis. Nat. Plants 2, 15190 (2016). - PubMed
    1. Casal J. J., Balasubramanian S., Thermomorphogenesis. Annu. Rev. Plant Biol. 70, 321–346 (2019). - PubMed

Publication types

MeSH terms

LinkOut - more resources