. 2019 Dec 10;116(50):25236-25242.
doi: 10.1073/pnas.1914056116. Epub 2019 Nov 25.

High-throughput assessment of hemoglobin polymer in single red blood cells from sickle cell patients under controlled oxygen tension

Affiliations

High-throughput assessment of hemoglobin polymer in single red blood cells from sickle cell patients under controlled oxygen tension

Giuseppe Di Caprio et al. Proc Natl Acad Sci U S A. .

Abstract

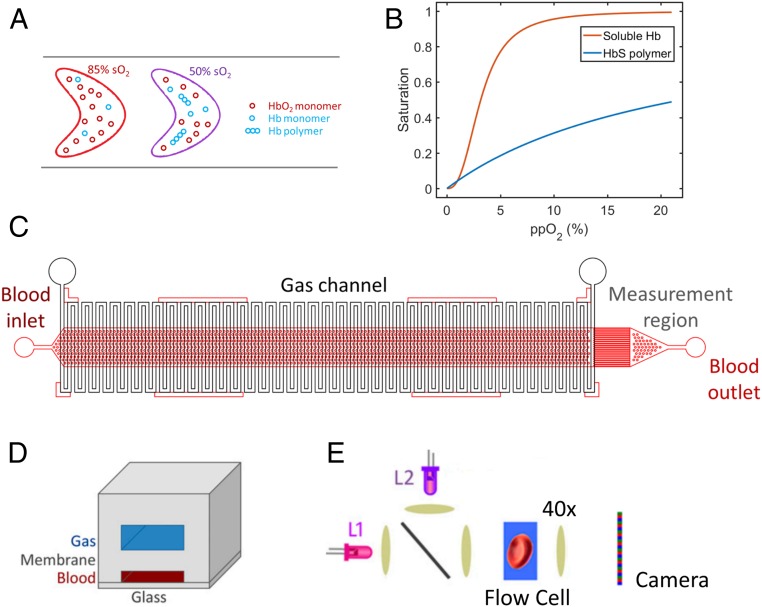
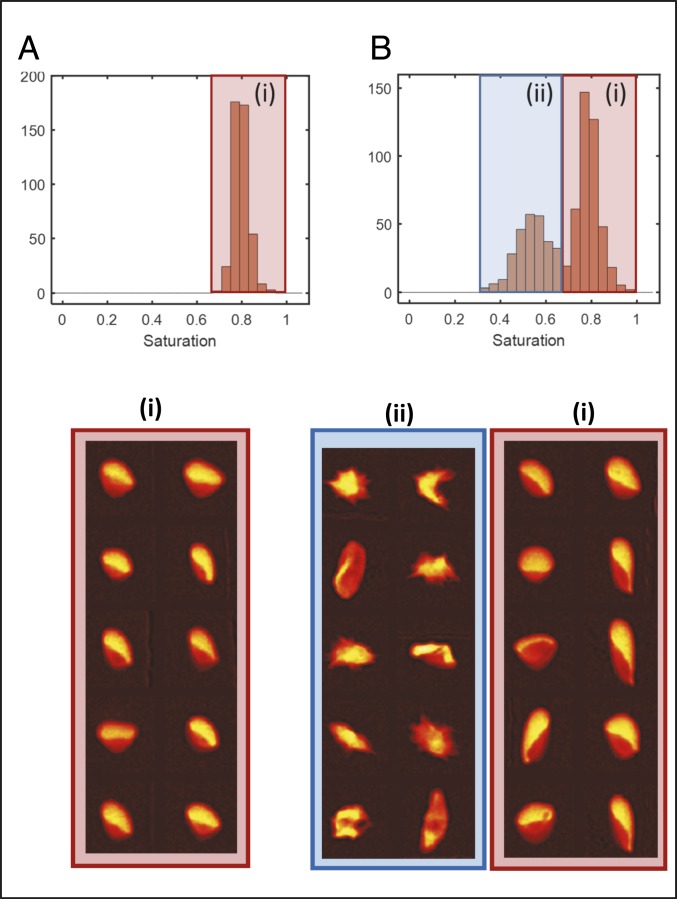
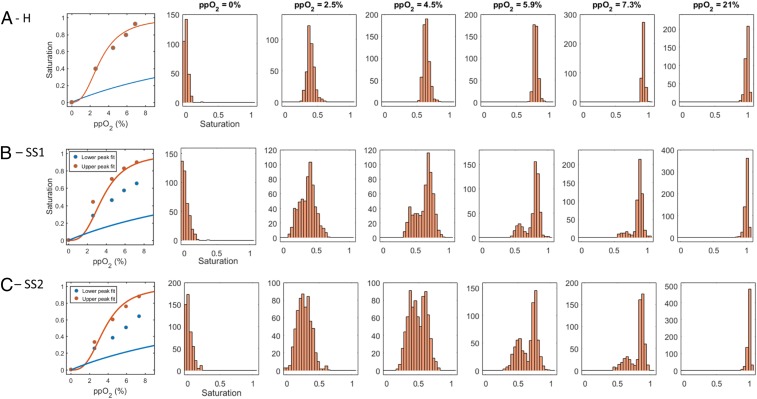
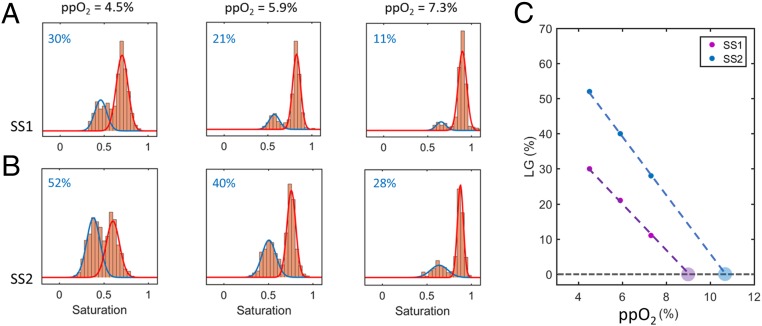
Sickle cell disease (SCD) is caused by a variant hemoglobin molecule that polymerizes inside red blood cells (RBCs) in reduced oxygen tension. Treatment development has been slow for this typically severe disease, but there is current optimism for curative gene transfer strategies to induce expression of fetal hemoglobin or other nonsickling hemoglobin isoforms. All SCD morbidity and mortality arise directly or indirectly from polymer formation in individual RBCs. Identifying patients at highest risk of complications and treatment candidates with the greatest curative potential therefore requires determining the amount of polymer in individual RBCs under controlled oxygen. Here, we report a semiquantitative measurement of hemoglobin polymer in single RBCs as a function of oxygen. The method takes advantage of the reduced oxygen affinity of hemoglobin polymer to infer polymer content for thousands of RBCs from their overall oxygen saturation. The method enables approaches for SCD treatment development and precision medicine.

Keywords: diagnostics; erythrocytes; hemoglobin polymerization; oxygen affinity; sickle cell disease.


Conflict of interest statement

The authors declare no competing interest.

Figures

Fig. 1.
Fig. 1.
Inferring single-RBC hemoglobin (Hb) polymer content from measurements of single-RBC hemoglobin-oxygen saturation. (A) The method is based on the principle that RBCs with less Hb polymer will have a higher fraction of their Hb saturated with oxygen than RBCs with more Hb polymer at a given oxygen tension. The cell on the left has less polymer, and 85% of its Hb is oxygen-saturated, while the cell on the right has more Hb polymer, and only 50% of its Hb is oxygen-saturated. B shows the hemoglobin-oxygen dissociation curves for soluble Hb (red), which demonstrates cooperativity, and polymerized Hb which is not cooperative (blue). The normal range of p50, the oxygen tension at which 50% of the Hb is oxygen-saturated, for soluble hemoglobin is ∼3.1 to 3.7%, in contrast to Hb polymer which has p50 of ∼22%. (C) The microfluidic device schematic shows the gas channel deoxygenation region (vertical white serpentine channels) and the blood channels (red horizontal channels) where cytometric measurements are performed at the rightmost end. D shows the cross-section of the device’s 3 layers, and E shows the optical measurement setup: 2 LEDs (λL1 = 410 nm and λL2 = 430 nm) are combined using a nonpolarizing beam splitter. The light transmitted by the cells flowing in the microfluidic channel is then projected onto a color camera by a microscope objective. See ref. for more details of the optical method.
Fig. 2.
Fig. 2.
Single-RBC oxygen saturation distributions reflect Hb polymer content. (A) A normal HbA blood sample at 5.9% oxygen contains RBCs with a unimodal saturation distribution clustered around ∼80% saturation, and fraction i below shows that all representative RBCs have normal morphology. In contrast, the RBCs in a blood sample in B from a patient with SCD have a bimodal saturation distribution at 5.9% oxygen tension, with a lower saturation peak around ∼50% saturation and a higher saturation peak around ∼80%. Representative RBCs from the lower saturation peak (ii) have a distorted and sickled morphology consistent with the presence of significant Hb polymer in all RBCs, while representative RBCs from the higher saturation peak (i) have mostly normal morphology.
Fig. 3.
Fig. 3.
Single-RBC saturation distributions reveal large differences in RBC subpopulations despite modest differences in mean saturations. A shows mean single-RBC hemoglobin saturation as a function of oxygen (dots in Left) and single-RBC saturation histograms for a healthy HbA sample (H) at 6 different oxygen tensions. B shows the same plots for a sickle cell sample (SS1) with 74% HbS, 21% HbF, and 5% HbA2. The mean saturations as function of oxygen tension are only modestly shifted downward relative to the dots in A, Left for sample H. The shapes of the histograms in B are markedly different from those in A at the intermediate oxygen tensions, with 2 modes instead of 1. The dots in Left show means of the upper and lower peaks of the saturation distributions at each measured oxygen tension. The saturations in the upper peaks are generally consistent with those in sample H, while the saturations in the lower peak are intermediate between those of sample H and what is expected for pure hemoglobin polymer as shown by the blue curve in the leftmost panel. (See Fig. 4 for more detail on fits used to define upper and lower peaks.) C shows results for another sickle cell sample (SS2) with 82% HbS, 14% HbF, and 4% HbA2. The dots in the leftmost panel show means of the upper and lower peaks of the saturation distributions at each measured oxygen tension as in B. At intermediate oxygen tensions (4.5, 5.9, and 7.3%) both SCD samples show a bimodal oxygen saturation distribution as described above and in Fig. 2, but the relative sizes of the 2 populations vary with oxygen tension and vary between patients. The curves in Left in each row also show the typical hemoglobin-oxygen dissociation curve for monomeric (red) and polymeric (blue) Hb.
Fig. 4.
Fig. 4.
Mixed Gaussian fits of single-RBC oxygen saturation distributions enable estimation of the size of the lower-saturation peaks and extrapolation to a patient-specific threshold oxygen tension below which polymerization may begin. A and B show the saturation distributions of both SCD samples at 3 intermediate oxygen tensions. The distributions have a bimodal shape and are shown along with the results of a mixed Gaussian fit. Each plot also shows (in blue) the fitted proportion of RBCs that falls in the lower saturation peak. C shows the percentage of cells in the lower Gaussian (LG) peak as a function of oxygen tension for both samples. The larger filled circles represent the x-intercept of a linear fit through the data of each sample.
Fig. 5.
Fig. 5.
Measuring RBC saturation distribution heterogeneity by comparing quintiles. (A) The difference between the 80th and 20th percentiles (“Quintile metric”) of the single-RBC saturation distributions (Fig. 3) is plotted for each of the 3 samples as a function of oxygen tension. The SCD samples have maximal values much higher than the healthy control sample. B shows the morphology of RBCs taken at random from the second and fourth quintiles at 5.9% oxygen. In the second quintile, a majority of the RBCs from SS1 have a morphology consistent with the presence of polymer, and several have normal-appearing morphology. For SS2, an even larger fraction of RBCs in the second quintile seem to have a morphology consistent with the presence of polymer. In the fourth quintile, the vast majority of RBCs have normal-appearing morphology for both SS1 and SS2.

References

    1. Serjeant G. R., Higgs D. R., Hambleton I. R., Elderly survivors with homozygous sickle cell disease. N. Engl. J. Med. 356, 642–643 (2007). - PubMed
    1. Kalpatthi R., Novelli E. M., Measuring success: Utility of biomarkers in sickle cell disease clinical trials and care. Hematology Am Soc Hematol Educ Program 2018, 482–492 (2018). - PMC - PubMed
    1. Steinberg M. H., Chui D. H. K., Dover G. J., Sebastiani P., Alsultan A., Fetal hemoglobin in sickle cell anemia: A glass half full? Blood 123, 481–485 (2014). - PubMed
    1. Charache S., et al. ; Investigators of the Multicenter Study of Hydroxyurea in Sickle Cell Anemia , Effect of hydroxyurea on the frequency of painful crises in sickle cell anemia. N. Engl. J. Med. 332, 1317–1322 (1995). - PubMed
    1. Platt O. S., et al. , Pain in sickle cell disease. Rates and risk factors. N. Engl. J. Med. 325, 11–16 (1991). - PubMed

Publication types