. 2019 Dec 10;116(50):25057-25067.
doi: 10.1073/pnas.1912503116. Epub 2019 Nov 25.

A structural basis for antibody-mediated neutralization of Nipah virus reveals a site of vulnerability at the fusion glycoprotein apex

Affiliations

A structural basis for antibody-mediated neutralization of Nipah virus reveals a site of vulnerability at the fusion glycoprotein apex

Victoria A Avanzato et al. Proc Natl Acad Sci U S A. .

Abstract

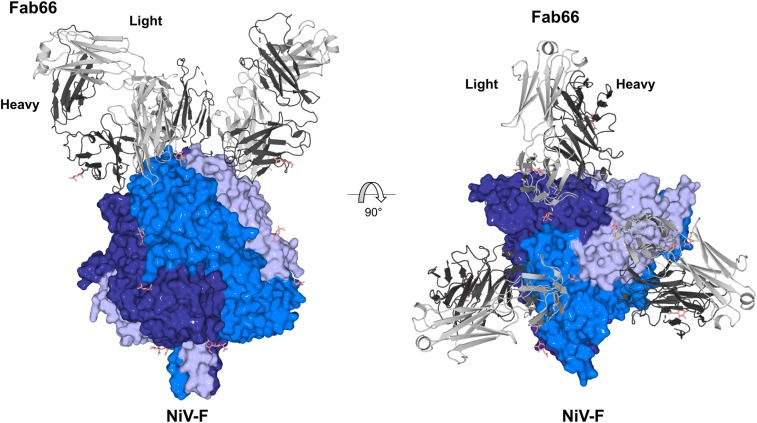
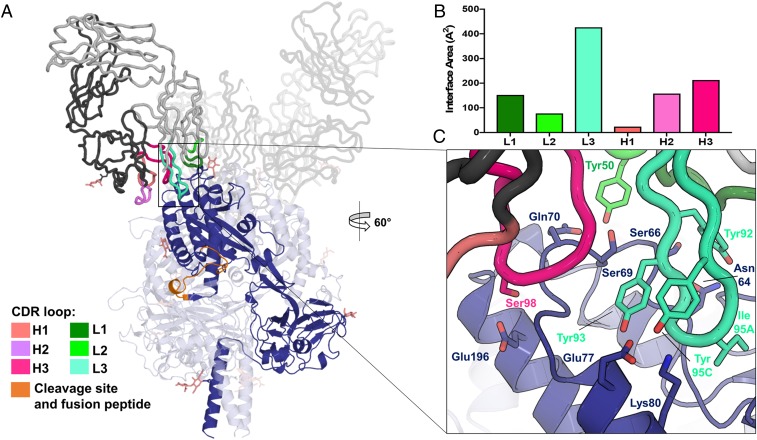
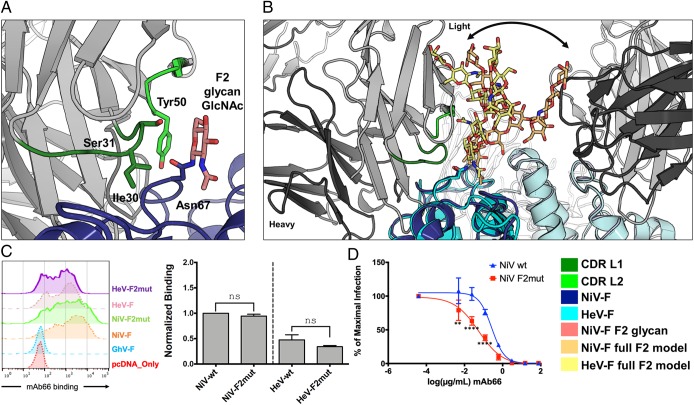
Nipah virus (NiV) is a highly pathogenic paramyxovirus that causes frequent outbreaks of severe neurologic and respiratory disease in humans with high case fatality rates. The 2 glycoproteins displayed on the surface of the virus, NiV-G and NiV-F, mediate host-cell attachment and membrane fusion, respectively, and are targets of the host antibody response. Here, we provide a molecular basis for neutralization of NiV through antibody-mediated targeting of NiV-F. Structural characterization of a neutralizing antibody (nAb) in complex with trimeric prefusion NiV-F reveals an epitope at the membrane-distal domain III (DIII) of the molecule, a region that undergoes substantial refolding during host-cell entry. The epitope of this monoclonal antibody (mAb66) is primarily protein-specific and we observe that glycosylation at the periphery of the interface likely does not inhibit mAb66 binding to NiV-F. Further characterization reveals that a Hendra virus-F-specific nAb (mAb36) and many antibodies in an antihenipavirus-F polyclonal antibody mixture (pAb835) also target this region of the molecule. Integrated with previously reported paramyxovirus F-nAb structures, these data support a model whereby the membrane-distal region of the F protein is targeted by the antibody-mediated immune response across henipaviruses. Notably, our domain-specific sequence analysis reveals no evidence of selective pressure at this region of the molecule, suggestive that functional constraints prevent immune-driven sequence variation. Combined, our data reveal the membrane-distal region of NiV-F as a site of vulnerability on the NiV surface.

Keywords: antibody response; glycoprotein; henipavirus; structure; viral fusion.


Conflict of interest statement

The authors declare no competing interest.

Figures

Fig. 1.
Fig. 1.
Crystal structure of the NiV-F−Fab66 complex. Side and top views show Fab66 bound to an epitope near the apex of the prefusion, uncleaved NiV-F trimer. Each Fab66 molecule binds to a single F protomer in the trimer. The NiV-F trimer is shown as surface with each protomer in the trimer colored a different shade of blue. Fab66 is shown as cartoon and the light and heavy chains are shown in light and dark gray, respectively. N-linked glycans are depicted as sticks and colored salmon.
Fig. 2.
Fig. 2.
The NiV-F−Fab66 interaction is dominated by CDR L3. (A) A single NiV-F protomer and Fab66 are highlighted for clarity, where the F protomer is shown as a dark blue cartoon, Fab66 is shown as a gray cartoon tube, and the CDR loops are colored in shades of pink (heavy) and green (light), as indicated in the figure legend. The residues comprising the cleavage site and fusion peptide are shown in orange (V105−I122). N-linked glycans are depicted as sticks and colored salmon. (B) Contributions of each Fab66 CDR loop to the proteinaceous interface, calculated by the PDBePISA server (48), measured as interface area in Angstroms squared. (C) A close-up view of the interface between Fab66 and NiV-F. Side chains participating in intermolecular hydrogen bonds, as identified by the PDBePISA server (48), are shown as sticks. Residue Ile95A on CDR L3, the most buried residue in the complex, is also shown. CDR loop H2, though participating in important contacts, is not shown here and a detailed view on the interface can be found in SI Appendix, Fig. S7B.
Fig. 3.
Fig. 3.
Glycosylation at the F2 N-glycan site on NiV-F. (A) The CDR L1 and L2 loops of Fab66 contact the GlcNAc residue of the F2 glycan site (Asn67) on NiV-F. Fab66 is shown as a cartoon tube (gray) and NiV-F is rendered as a cartoon (blue). CDR L1 and L2 are colored green, with the side chains of residues interacting with the GlcNAc (Ile30 and Ser31 of CDR L1 and Tyr50 of CDR L2) shown as sticks [calculated by PISA server (48)]. The corresponding Asn67 residue side chain is also shown as sticks and colored blue. (B) Modeling of a full-length complex N-linked glycan onto the F2 glycan site shows minimal steric hindrance to mAb66 binding. The structure of HeV-F [PDB ID code 5EJB (46), cyan] was aligned to NiV-F (dark blue). The full-length complex glycan chain from the structure PDB ID code 4BYH (80) was modeled onto the F2 glycan site on both NiV-F and HeV-F by aligning the first GlcNAc residues to the conformation observed in the crystal structures. The full-length glycan modeled onto NiV-F is shown as light orange sticks and the full-length glycan modeled onto HeV-F is shown as yellow sticks. The different conformations observed reflect the intrinsic flexibility expected of glycans (represented by the black arrow) and show that certain glycan conformations at F2 may only subtly interfere with mAb66 recognition. (C) Representative FACS histogram plots showing binding of mAb66 to WT NiV-F, NiV-F2mut, and their HeV-F counterparts expressed on transiently transfected 293T cells (Left). Binding data are presented as a bar graph (Right) of the mean ± SE for 3 independent replicates. Binding was first normalized to the binding of 2 anti-HNV polyclonal sera (pAb2489 and pAb2490), which were prescreened for equivalent cross reactivity to NiV-F and HeV-F as well as to all of the mutants examined in this study (Materials and Methods and SI Appendix, Fig. S10). These binding values were then renormalized to WT NiV-F binding set to 1 (normalized binding, y axis). Statistical significance was determined by an ordinary 1-way ANOVA with Sidak’s correction for multiple comparisons (n.s., not significant, or P > 0.05). (D) mAb66 neutralization of NiV-F/G pseudotyped [VSV-ΔGRLuc] particle (NiVpp) infection on permissive U-87 MG glioblastoma cells. NiVpp bearing WT NiV-G and the indicated homologous WT or mutant NiV-F (SI Appendix, Fig. S11) were used to infect U87 cells in the presence of serial 5-fold dilution of mAb66 as described in Materials and Methods. Infections were performed using optimized virus inputs that will give reporter gene (Renilla luciferase, RLuc) outputs (relative light units) within the dynamic response range of the assay for all mutants tested (SI Appendix, Fig. S12). Data were analyzed using nonlinear regression, fitted using a variable slope model, and presented as a 4-parameter dose–response curve (GraphPad PRISM). The lowest value on the x axis (mAb), “media only,” is artificially set to constrain the level of maximum infection (y axis) in the absence of any mAb. Data points are mean ± SE for each neutralization curve performed in biological triplicates; each replicate comprising of technical duplicates. Statistical significance for the neutralization assay was tested with 2-way ANOVA with Dunnett’s correction for multiple comparison (**P < 0.01; ****P < 0.0001).
Fig. 4.
Fig. 4.
Differences between NiV-F and HeV-F at the Fab66 footprint. (A) Surface view of the NiV-F is shown in white, with 1 protomer shaded in light blue for clarity. (Upper Left) The residues in the binding interface are colored according to the Fab66 chain involved in the contact, with residues contacted by the light chain shown as green, heavy-chain contacts shown as pink, and residues contacted by both chains shown in gray. (Lower) A sequence alignment between NiV-F (Malaysia, AAV80428.1) and HeV-F (AEB21197.1), was generated by Multalin (81) and plotted by ESPript (82). Residues involved in the Fab66 interface are noted with colored boxes below the alignment. Residues that differ between NiV-F and HeV-F are outlined by a red box. (Upper Right) The entire binding footprint of Fab66 is shown as blue. The residues that differ between NiV-F and HeV-F within the epitope, Gln70 and Ser74, are shown in red and labeled. (B) To model Fab66 binding at residues 70 and 74 on NiV-F (Upper) and HeV-F (Lower), the HeV-F structure [PDB ID code 5EJB (46), cyan cartoon] was aligned to NiV-F (dark blue cartoon). (Upper Left) Representation of Gln70 on NiV-F (dark blue), which forms hydrogen bond contacts with Tyr50 (CDR L2, light green) and Ser98 (CDR H3, hot pink). (Upper Right) Representation of Ser74 on NiV-F (dark blue), which forms hydrogen bond contacts with residues Thr52A and Asn53 (CDR H2, pink) of Fab66. (Lower Right) The threonine at position 74 in HeV-F (cyan) does not show obvious clashes with CDR H2 of Fab66. (Lower Left) The lysine substitution in HeV at position 70 shows the lysine side chain as modeled in the crystal structure [PDB ID code 5EJB (46), cyan], as well as 2 rotamers (light cyan) that clash with residues Ser96 and Trp100B in CDR H3 (hot pink) of Fab66. (C) Representative FACS histogram plots showing binding of mAb66 to WT NiV-F, HeV-F and the indicated reciprocal double mutant (70+74mut), as described in the text (Left). Normalized mAb66 binding were analyzed and presented as bar graphs (Right). The experiment was performed and analyzed as in Fig. 3C (**P < 0.01; ****P < 0.0001). (D) mAb66 neutralization curves of NiVpp and HeVpp infection on permissive U87 glioblastoma cells were generated as detailed in Fig. 3D, with the exception of the different HNV-F mutants used here. Each neutralization curve was performed in biological triplicates comprising of technical duplicates per biological replicate. Data was analyzed as in Fig. 3D (*P < 0.05; ****P < 0.0001).
Fig. 5.
Fig. 5.
A model for immune accessible areas on NiV-F. (A) Schematic of the NiV surface, where NiV-F (blue) and NiV-G (green) associate and densely populate the viral envelope. Fabs (gray) are shown contacting potential immune accessible, membrane distal regions of NiV-F. (B) Diagram showing the functional domains of the NiV-F protein and the assignment of groups for the dN/dS analysis. Groups were assigned based on functional domain and distance from the viral membrane. Group 1: DIII; group 2: DI, DII, and the HRB linker; group 3: HRB; and group 4: TM domain. (C) Comparison of the ω estimates (y axis) across the complete fusion protein (termed “C”) of 3 paramyxoviruses (NiV-F, MeV-F, and PIV5-F), and across different functional groups of the NiV-F (G1 to G4, as defined in B). No evidence for positive diversifying selection was detected for any region of the different paramyxoviral F proteins analyzed, as all mean estimates fall below the threshold of ω > 1 (represented by the dotted line at 100). The red lines represent the median values, the ends of each box represent the 75% confidence intervals, and the whiskers represent the 95% CIs. The outliers are values that lie beyond the 95% CIs and are represented by circles (see SI Appendix, Table S3).
Fig. 6.
Fig. 6.
Anti-F specific monoclonal and polyclonal antibodies are sensitive to mutations at the apex of NiV-F and HeV-F. (A and C) Representative FACS histogram plots showing binding of mAb36 or pAb835 to WT NiV-F, HeV-F, the cognate HNV-F2 mutants (NiV-F2mut, HeV-F2mut), or the reciprocal double mutants (NiV-70+74mut, HeV-70+74mut) as described in the text (Left). Normalized binding analyzed and presented as a bar graph as described for Fig. 3C (Right, mean ± SE, n = 3). Binding values were normalized to HeV-F for mAb36 and to NiV-F for pAb835. (B and D) Neutralization curves of NiVpp (Left) and HeVpp (Right) infection using WT, F2mut, and the cognate 70+74mut, were generated and analyzed as described in Fig. 3D. Each curve was performed in biological triplicates comprised of technical duplicates per biological replicate. Data points shown are mean ± SE. Statistical significance was determined as described in in Fig. 3D legend (*P ≤ 0.05, **P ≤ 0.01, ***P ≤ 0.001; ****P ≤ 0.0001). See SI Appendix, Table S1 for documentation of anti-F and anti-G specific polyclonal antibody specificities. As a control, neutralizations were performed with an anti-G specific polyclonal and revealed no differences in neutralization of the WT and mutant F constructs (SI Appendix, Fig. S9).

References

    1. Eaton B. T., Broder C. C., Middleton D., Wang L. F., Hendra and Nipah viruses: Different and dangerous. Nat. Rev. Microbiol. 4, 23–35 (2006). - PMC - PubMed
    1. Murray K., et al. , A morbillivirus that caused fatal disease in horses and humans. Science 268, 94–97 (1995). - PubMed
    1. Field H. E., Hendra virus ecology and transmission. Curr. Opin. Virol. 16, 120–125 (2016). - PubMed
    1. Paton N. I., et al. , Outbreak of Nipah-virus infection among abattoir workers in Singapore. Lancet 354, 1253–1256 (1999). - PubMed
    1. Chua K. B., et al. , Nipah virus: A recently emergent deadly paramyxovirus. Science 288, 1432–1435 (2000). - PubMed

Publication types

Associated data

LinkOut - more resources