. 2019 Dec 17;116(51):25734-25744.
doi: 10.1073/pnas.1913072116. Epub 2019 Nov 25.

The impact of rising CO2 and acclimation on the response of US forests to global warming

Affiliations

The impact of rising CO2 and acclimation on the response of US forests to global warming

John S Sperry et al. Proc Natl Acad Sci U S A. .

Abstract

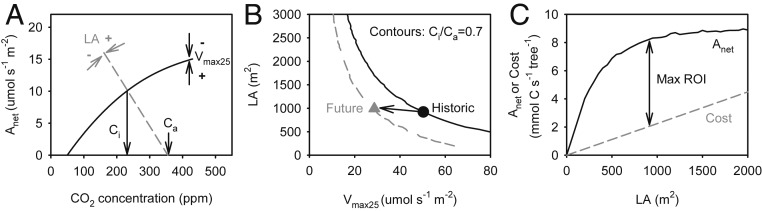
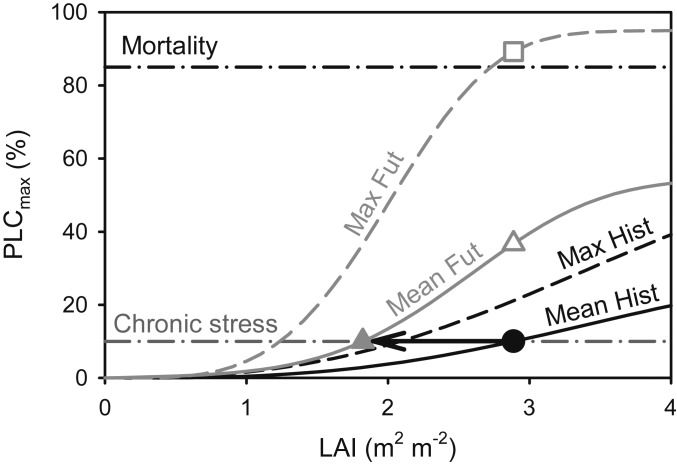
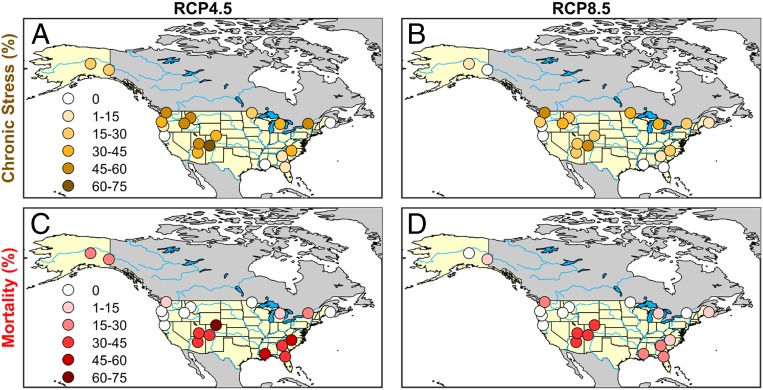
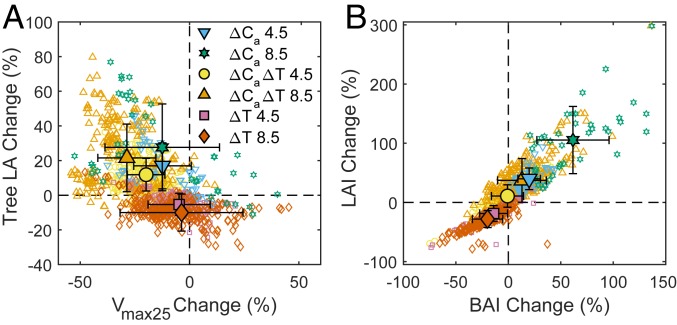
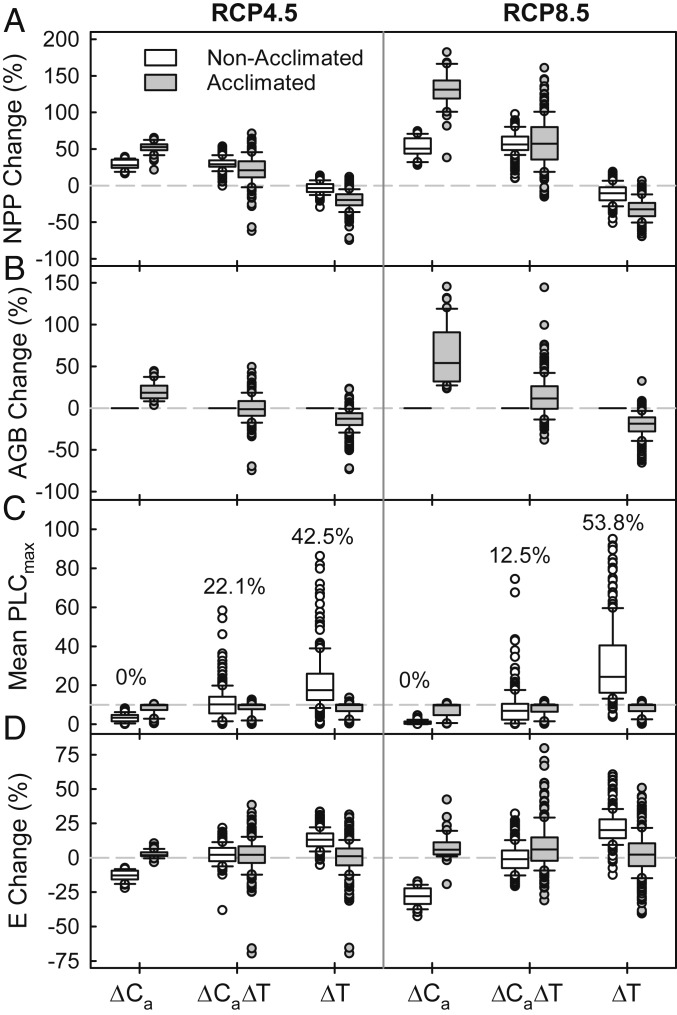
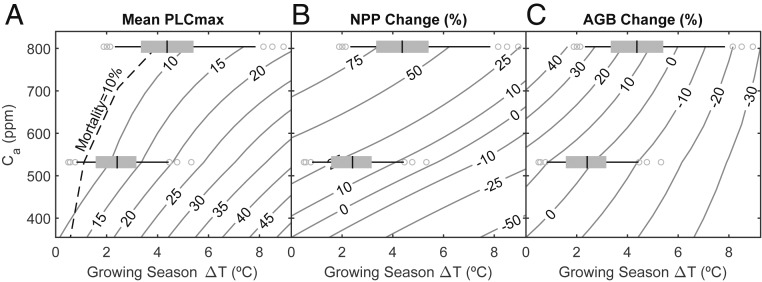
The response of forests to climate change depends in part on whether the photosynthetic benefit from increased atmospheric CO2 (∆Ca = future minus historic CO2) compensates for increased physiological stresses from higher temperature (∆T). We predicted the outcome of these competing responses by using optimization theory and a mechanistic model of tree water transport and photosynthesis. We simulated current and future productivity, stress, and mortality in mature monospecific stands with soil, species, and climate sampled from 20 continental US locations. We modeled stands with and without acclimation to ∆Ca and ∆T, where acclimated forests adjusted leaf area, photosynthetic capacity, and stand density to maximize productivity while avoiding stress. Without acclimation, the ∆Ca-driven boost in net primary productivity (NPP) was compromised by ∆T-driven stress and mortality associated with vascular failure. With acclimation, the ∆Ca-driven boost in NPP and stand biomass (C storage) was accentuated for cooler futures but negated for warmer futures by a ∆T-driven reduction in NPP and biomass. Thus, hotter futures reduced forest biomass through either mortality or acclimation. Forest outcomes depended on whether projected climatic ∆Ca/∆T ratios were above or below physiological thresholds that neutralized the negative impacts of warming. Critically, if forests do not acclimate, the ∆Ca/∆T must be above ca 89 ppm⋅°C-1 to avoid chronic stress, a threshold met by 55% of climate projections. If forests do acclimate, the ∆Ca/∆T must rise above ca 67 ppm⋅°C-1 for NPP and biomass to increase, a lower threshold met by 71% of projections.

Keywords: acclimation; climate change; drought; forest resilience; vegetation modeling.


Conflict of interest statement

The authors declare no competing interest.

Figures

Fig. 1.
Fig. 1.
Basis for modeling tree-level acclimation of LA and photosynthetic capacity (maximum carboxylation capacity, Vmax25, coupled to electron transport capacity, Jmax25). (A) Trees acclimate LA and Vmax25 to achieve a homeostatic ratio between leaf internal (Ci) and atmospheric (Ca) CO2 concentrations (Ci/Ca = 0.7) under favorable site “reference” conditions. The Ci is determined by the balance between Vmax25 (Vmax25 arrows) and the stomatal conductance to CO2 (absolute value of slope of dashed gray line). Stomatal conductance depends on LA through its effect on the tree hydraulic conductance per LA (LA arrows). (B) For each set of environmental reference conditions there are infinite combinations of LA and Vmax25 that satisfy Ci/Ca = 0.7 (solid black contour for historic conditions and gray dashed contour for future conditions), but only one LA–Vmax25 combination is optimal (historic, black circle; future, gray triangle). (C) The optimal LA–Vmax25 maximizes the ROI (Max ROI arrow), calculated as the difference between the net whole canopy assimilation (solid Anet curve) and leaf construction cost amortized over the GS (gray cost line).
Fig. 2.
Fig. 2.
Stand-level acclimation to ecohydrologic equilibrium. At equilibrium for historic conditions, the LA index (LAI) is maximized without exceeding a chronic stress threshold, defined by an average maximum percentage loss in tree hydraulic conductance over multiple GSs of variable historic weather (mean PLCmax = 10 in this study, dashed-dotted chronic stress line). The equilibrium LAI is at the intersection between the stress threshold and the “Mean Hist” PLCmax curve (solid black circle). Equilibrium LAI also cannot allow the PLCmax in any given (dry) year (“Max Hist” dashed curve) to exceed a mortality threshold (black dashed-dot mortality line, here set to PLCmax = 85; ref. 36). If the historic LAI is too high for future conditions, it will induce chronic stress (open gray triangle on “Mean Fut” curve) and possibly trigger mortality (open gray square on “Max Fut” curve). Acclimation in this case requires a reduction in LAI (black arrow) to eliminate stress (solid gray triangle). Alternatively, if the historic LAI was too low for the future, it was increased until reaching the chronic stress or mortality thresholds.
Fig. 3.
Fig. 3.
Stand responses to the increase in GS temperature (∆T) at 2 elevated atmospheric CO2 concentrations, RCP4.5 (∆Ca = 177 ppm, Left) and RCP8.5 (∆Ca = 449 ppm, Right). Nonacclimated stands are in gray and acclimated stands are in black. Symbols indicate regions: Mountain West, +; Pacific Northwest, □; Southeast, ×; Boreal, ○. Regressions (solid lines) were highly significant (n = 240, P < 0.001; 95% confidence intervals, dashed lines). (A) The percentage change (all percentages relative to historic) in mean annual NPP. (B) Percentage change in AGB. (C) Percentage change in mean annual stand transpiration (E). (D) Mean maximum percentage loss in soil-to-canopy tree conductance at the end of the GS (mean PLCmax). Dashed-dotted horizontal line is the 10% chronic stress threshold (Fig. 2). Red symbols are simulations in which maximum PLCmax exceeded the mortality threshold (PLCmax = 85; Fig. 2) in at least one year, with the percentage of total simulations (n = 240 per RCP CO2 concentration) indicated. Acclimated stands by definition did not exceed either threshold.
Fig. 4.
Fig. 4.
Regional distribution of chronic hydraulic stress and mortality for nonacclimated stands. Chronic hydraulic stress (orange-toned circles) indicated as the percentage of simulations per site (n = 12, 6 climate models and 2 species per location) exceeding the chronic stress threshold in average percentage loss of hydraulic conductance (Fig. 2, mean PLCmax = 10) over a 30-y period. Mortality (red-toned circles) is indicated as percent of simulations per site exceeding the hydraulic mortality threshold in any year (Fig. 2, max PLCmax > 85). Darker symbols represent higher levels of stress as labeled. (A) Chronic stress for RCP4.5 CO2 concentration. (B) Chronic stress for RCP8.5. (C) Mortality for RCP4.5. (D) Mortality for RCP8.5.
Fig. 5.
Fig. 5.
Acclimation at the tree and stand scale to 6 future scenarios of elevated atmospheric CO2 (∆Ca) and warming of the GS (∆T). Scenarios by color: ∆Ca 4.5, historic climate with RCP4.5 atmospheric CO2 concentration (blue downward triangle, n = 40); ∆Ca 8.5, historic climate with RCP8.5 Ca (green star, n = 40); ∆Ca∆T 4.5, future RCP4.5 weather and Ca (yellow circle, n = 240); ∆Ca∆T 8.5, future RCP8.5 weather and Ca (orange upward triangle, n = 240); ∆T 4.5, future RCP4.5 weather and historic Ca (pink square, n = 240); ∆T 8.5, future RCP8.5 weather and historic Ca (vermillion diamond, n = 240). Open symbols are individual simulations, and solid symbols are simulation means (SD bars). (A) Tree-level acclimation by percentage change (all percentages relative to historic) in maximum carboxylation rate (Vmax25, coupled to electron transport capacity, Jmax25) and percentage change in tree LA. (B) Stand-level adjustment by percentage change in stand basal area (BAI) and percentage change in LA index (LAI) as required to satisfy ecohydrologic equilibrium.
Fig. 6.
Fig. 6.
Response of stands to 6 future scenarios of elevated atmospheric CO2 (∆Ca) and warming of the GS (∆T). (Left) RCP4.5 ∆Ca. (Right) RCP8.5. The ∆Ca treatment (bottom axis) is future CO2 enrichment with historic weather (n = 40 simulations); ∆Ca∆T is the future CO2 and weather (n = 240); ∆T is future weather with historic CO2 concentration (n = 240). Box and whisker plots characterize the distribution of individual simulations within each scenario (boxes = 25th to 75th percentile with median line; whiskers = 10th and 90th percentiles; symbols = remainder). Nonacclimated stands are open boxes, acclimated stands are gray. (A) Percentage change in NPP (all percentages relative to historic). (B) Percentage change in AGB. (C) Mean GS percent loss in tree hydraulic conductance (Mean PLCmax). Percentages above the open nonacclimated simulations are the percent of simulations that reached the mortality threshold (Fig. 2, PLCmax ≥ 85) at least once in the 30-y simulation period. (D) Percentage change in stand transpiration (E).
Fig. 7.
Fig. 7.
Competing effects of atmospheric CO2 enrichment (Ca) and warming of the GS (∆T). Contour lines for each response variable were obtained from linear regressions with ∆T (based on historic, RCP4.5, and RCP8.5 weather) at each of 3 Ca (historic, RCP4.5, and RCP8.5; n = 520 per Ca). Superimposed are ∆T distributions for an RCP4.5 future (lower box and whisker, n = 240) and an RCP8.5 future (upper box and whisker, n = 240; boxes = 25th to 75th percentile with median line; whiskers = 10th and 90th percentiles; symbols = remainder). (A) Stress in nonacclimated stands indicated by contours of mean PLCmax (gray) and the 10% mortality contour (dashed black; 10% of simulations reaching PLCmax ≥ 85). (B) NPP in acclimated stands indicated by contours of percentage change (all percentages relative to historic) of acclimated stands. (C) AGB in acclimated stands indicated by contours of percentage change.

References

    1. IPCC , Global warming of 1.5 °C: An IPCC special report on the impacts of global warming of 1.5°C above pre-industrial levels and related global greenhouse gas emission pathways, in the context of strengthening the global response to the threat of climate change, sustainable development, and efforts to eradicate poverty, Masson-Delmotte V., et al., Eds. (Intergovernmental Panel on Climate Change, Geneva, Switzerland, 2018).
    1. Dusenge M. E., Duarte A. G., Way D. A., Plant carbon metabolism and climate change: Elevated CO2 and temperature impacts on photosynthesis, photorespiration and respiration. New Phytol. 221, 32–49 (2019). - PubMed
    1. Ainsworth E. A., Long S. P., What have we learned from 15 years of free-air CO2 enrichment (FACE)? A meta-analytic review of the responses of photosynthesis, canopy properties and plant production to rising CO2. New Phytol. 165, 351–371 (2005). - PubMed
    1. Norby R. J., Zak D. R., Ecological lessons from free-air CO2 enrichment (FACE) experiments. Annu. Rev. Ecol. Evol. Syst. 42, 181–203 (2011).
    1. Keenan T. F., et al. , Recent pause in the growth rate of atmospheric CO2 due to enhanced terrestrial carbon uptake. Nat. Commun. 7, 13428 (2016). - PMC - PubMed

Publication types