. 2019 Nov 25;9(1):17451.
doi: 10.1038/s41598-019-53826-7.

Kisspeptin-Activated Autophagy Independently Suppresses Non-Glucose-Stimulated Insulin Secretion from Pancreatic β-Cells

Affiliations

Kisspeptin-Activated Autophagy Independently Suppresses Non-Glucose-Stimulated Insulin Secretion from Pancreatic β-Cells

Chien Huang et al. Sci Rep. .

Abstract

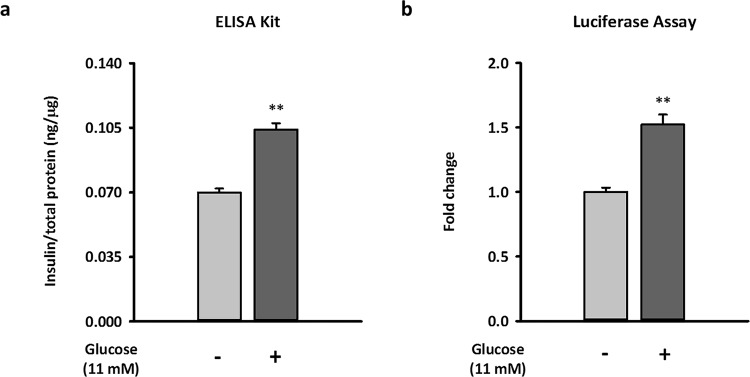
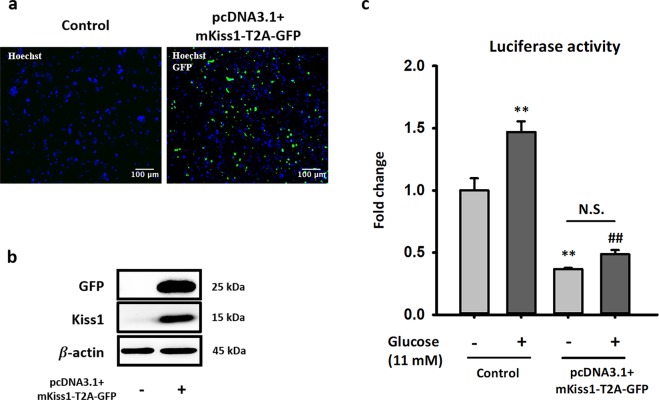
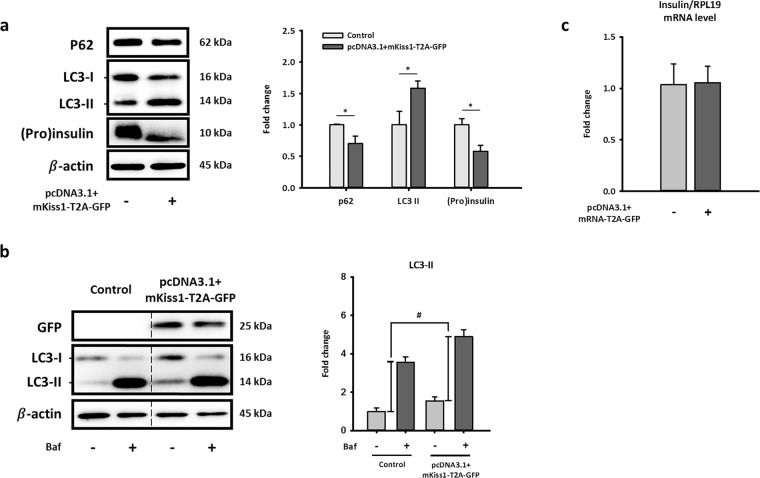
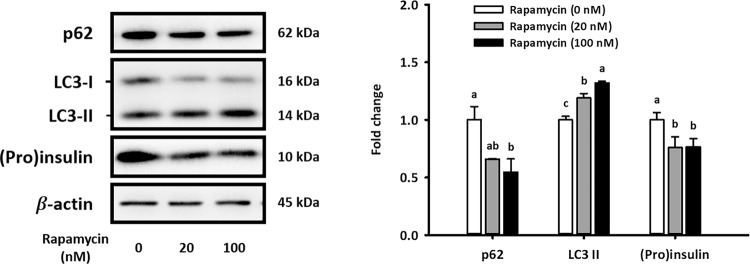
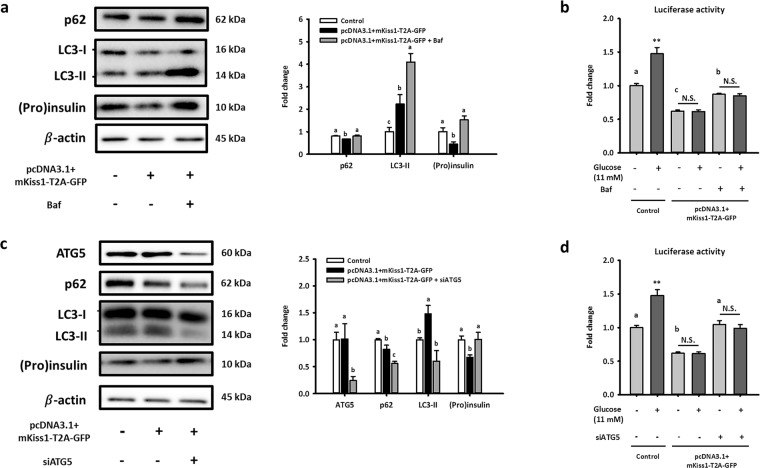
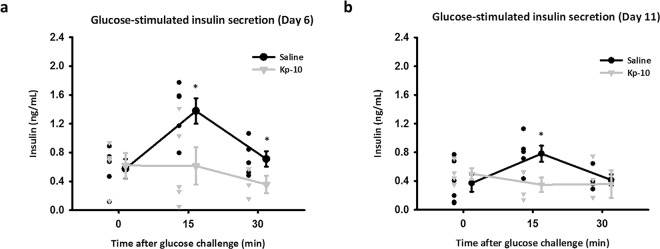
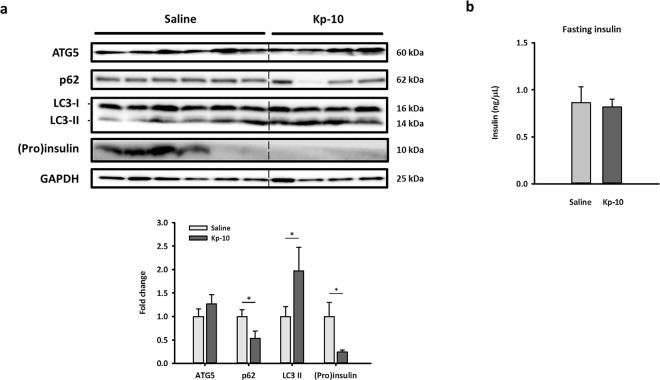
Previous studies have demonstrated the important role of kisspeptin in impaired glucose-stimulated insulin secretion (GSIS). In addition, it was reported that the activation of autophagy in pancreatic β-cells decreases insulin secretion by selectively degrading insulin granules. However, it is currently unknown whether kisspeptin suppresses GSIS in β-cells by activating autophagy. To investigate the involvement of autophagy in kisspeptin-regulated insulin secretion, we overexpressed Kiss1 in NIT-1 cells to mimic the long-term exposure of pancreatic β-cells to kisspeptin during type 2 diabetes (T2D). Interestingly, our data showed that although kisspeptin potently decreases the intracellular proinsulin and insulin ((pro)insulin) content and insulin secretion of NIT-1 cells, autophagy inhibition using bafilomycin A1 and Atg5 siRNAs only rescues basal insulin secretion, not kisspeptin-impaired GSIS. We also generated a novel in vivo model to investigate the long-term exposure of kisspeptin by osmotic pump. The in vivo data demonstrated that kisspeptin lowers GSIS and (pro)insulin levels and also activated pancreatic autophagy in mice. Collectively, our data demonstrated that kisspeptin suppresses both GSIS and non-glucose-stimulated insulin secretion of pancreatic β-cells, but only non-glucose-stimulated insulin secretion depends on activated autophagic degradation of (pro)insulin. Our study provides novel insights for the development of impaired insulin secretion during T2D progression.


Conflict of interest statement

The authors declare no competing interests.

Figures

Figure 1
Figure 1
Establishment of the glucose-stimulated insulin secretion model in NIT-1 cells by measuring luminescent activity of luciferase. Equivalent secretion of insulin and luciferase from NIT-1 cells by transfecting pLX304-Proinsulin-NanoLuc were measured. The secretion of insulin (a) and luciferase activity (b) from the same conditioned media of NIT-1 cells with or without glucose challenge are shown. Both the relative insulin concentration and relative luciferase activity were normalized by total protein in cell lysates. Data represent the means ± standard errors of the mean (n = 3). *Compared with 0 mM glucose treatment; **p < 0.01.
Figure 2
Figure 2
Long-term exposure of kisspeptin inhibits insulin secretion in NIT-1 cells. (a) NIT-1 cells were transfected with or without pcDNA3.1 + mKiss1-T2A-GFP plasmid, then fixed and stained with Hoechst 33342. Nucleus and GFP signal are shown in blue and green, respectively. The overlay of signals was processed by ImageJ. (b) Representative blots of GFP and mouse kisspeptin from transfected NIT-1 cells are shown. (c) Insulin secretion ability of control and transfected NIT-1 cells were determined by the amount of secreted luciferase under basal and glucose-stimulated condition. The relative luciferase activity was normalized by total protein in cell lysates. Data represent the means ± standard errors of the mean (n = 3). *Compared with the basal level in the control group; **p < 0.01; #Compared with glucose-induced level in the control group; ##p < 0.01. The full-length blots are presented in Supplementary Fig. S1.
Figure 3
Figure 3
Long-term exposure of kisspeptin decreases (pro)insulin protein level and activates autophagy in NIT-1 cells. Representative blots (a) and mRNA levels of insulin (c) in NIT-1 cells after transfecting pcDNA3.1 + mKiss1-T2A-GFP for 72 h. Quantifications of blots and mRNA normalized by β-actin or RPL19 are shown as the means ± standard errors of the mean (n = 3). (b) Representative blots of autophagy flux marker in cultured NIT-1 cells after overexpressing Kiss1 with/without treating with bafilomycin A1 (20 nM, 3 h). Quantifications of LC3-II normalized by β-actin are shown as the means ± standard errors of the mean (n = 3), which represents autophagy flux. *Compared with level of the control; *p < 0.05; #Compared with autophagy flux of the control; #p < 0.05. The full-length blots are presented in Supplementary Fig. S2.
Figure 4
Figure 4
Rapamycin-induced autophagy decreases protein levels of (pro)insulin in NIT-1 cells. Representative blots of autophagy markers and (pro)insulin in cultured NIT-1 after treating with 0 (DMSO), 20, or 100 mM rapamycin for 6 h are shown. Quantifications normalized by β-actin are shown as the means ± standard errors of the mean (n = 3). Different letters represent significant difference determined by one-way ANOVA with post-hoc tests. The full-length blots are presented in Supplementary Fig. S3.
Figure 5
Figure 5
Effects caused by long-term exposure of kisspeptin are partially reversed by inhibition of autophagy in NIT-1 cells. Representative blots of Kiss1-overexpressing NIT-1 cells with/without treating bafilomycin A1 (5 nM) for 6 h (a) and with/without co-transfecting siATG5 for 48 h (c) are shown. Quantifications normalized by β-actin are shown as the means ± standard errors of the mean (SEM) (n = 3). (b,d) Relative activities of luciferase were normalized by total protein in cell lysates and represent as the means ± standard errors of the mean (n = 3). Different letters represented significant difference determined by one-way ANOVA with post-hoc tests. *Compared with the basal level in the control group; **p < 0.01. The full-length blots are presented in Supplementary Fig. S4.
Figure 6
Figure 6
GSIS is inhibited by continuous Kp-10 injection in mice. After implanted osmotic pumps for 6 days (a) and 11 days (b), serum insulin levels in mice at 0, 15 and 30 min after oral glucose gavage are shown as scatter plots. The circle plots represent the saline group; the triangle plots represent the Kp-10 group (n >__ 3). *Compared with levels of the saline group at indicated time points; *p < 0.05.
Figure 7
Figure 7
Continuous Kp-10 injection activates pancreatic autophagy and decreases (pro)insulin expression in mice. After implanted osmotic pump for 14 days, blood and pancreas samples were collected under a fasting state. Representative blots of autophagy markers and (pro)insulin in pancreas are shown. Quantifications normalized by GAPDH are shown as the means ± standard errors of the mean (n >__ 4). *Compared with levels of the Saline group; *p < 0.05. The full-length blots are presented in Supplementary Fig. S5.

References

    1. Economic costs of diabetes in the U.S. in 2012. Diabetes Care36, 1033–1046, 10.2337/dc12-2625 (2013). - PMC - PubMed
    1. Rizza RA. Pathogenesis of fasting and postprandial hyperglycemia in type 2 diabetes: implications for therapy. Diabetes. 2010;59:2697–2707. doi: 10.2337/db10-1032. - DOI - PMC - PubMed
    1. Samuel VT, Shulman GI. Mechanisms for Insulin Resistance: Common Threads and Missing Links. Cell. 2012;148:852–871. doi: 10.1016/j.cell.2012.02.017. - DOI - PMC - PubMed
    1. Nathan DM, et al. Impaired fasting glucose and impaired glucose tolerance. Implications for care. 2007;30:753–759. doi: 10.2337/dc07-9920. - DOI - PubMed
    1. Hu KL, Zhao H, Chang HM, Yu Y, Qiao J. Kisspeptin/Kisspeptin receptor system in the ovary. Front Endocrinol. 2017;8:365. doi: 10.3389/fendo.2017.00365. - DOI - PMC - PubMed

Publication types