

Spatio-temporal analysis of association between incidence of malaria and environmental predictors of malaria transmission in Nigeria
- PMID: 31767899
- PMCID: PMC6877532
- DOI: 10.1038/s41598-019-53814-x
Spatio-temporal analysis of association between incidence of malaria and environmental predictors of malaria transmission in Nigeria
Abstract
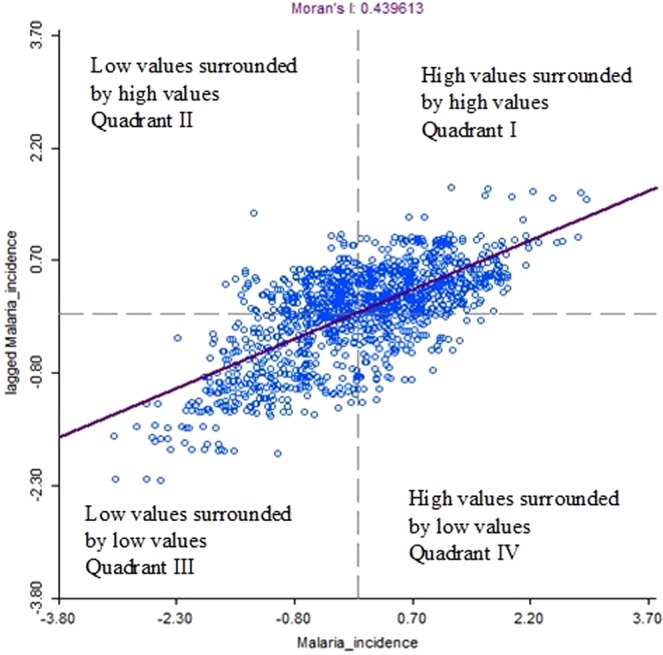
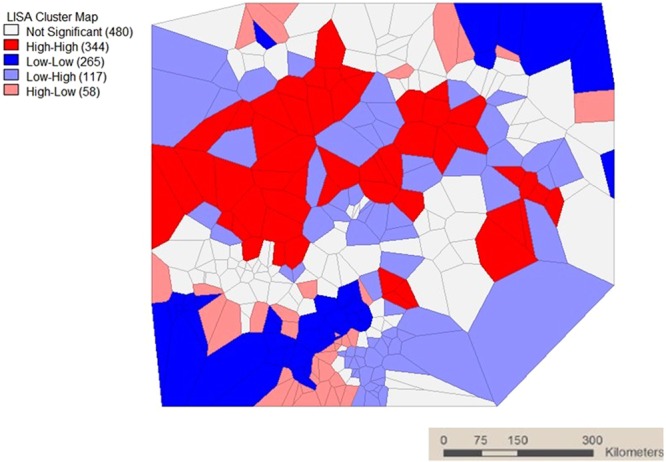
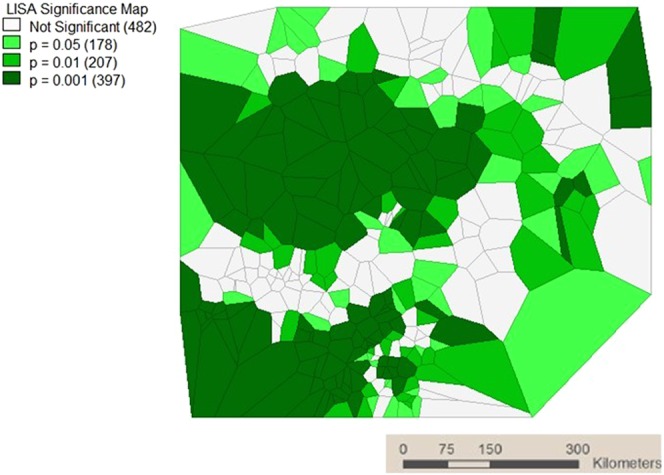
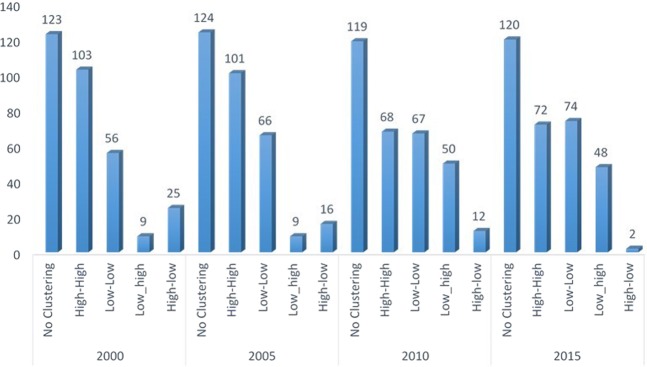
Malaria still poses a significant threat in Nigeria despite the various efforts to abate its transmission. Certain environmental factors have been implicated to increase the risk of malaria in Nigeria and other affected countries. The study aimed to evaluate the spatial and temporal association between the incidence of malaria and some environmental risk factors in Nigeria. The study used malaria incidence and environmental risk factors data emanating from 2015 Nigeria Malaria Indicator Survey accessed from the Demographic and Health Survey database. A total of 333 and 326 clusters throughout the country were used for malaria incidence study and environmental variables respectively. The spatial autocorrelation of malaria incidence and hotspot analysis was determined by the Moran's diagram and local Moran's I index, respectively. The relationships between the malaria incidence and the ecological predictors of transmission were analysed in all the six geopolitical zones of Nigeria from 2000-2015 using ordinary least square (OLS), spatial lag model (SLM), and spatial error model (SEM). Annual rainfall, precipitation and proximity to water showed significant positive relationship with the incidence rate of malaria in the OLS model (P < 0.01), whereas aridity was negatively related to malaria incidence (P < 0.001) in the same model. The rate of incidence of malaria increased significantly with increase in temperature, aridity, rainfall and proximity to water in the SEM whereas only temperature and proximity to water have significant positive effect on malaria incidence in the SLM. The modelling of the ecological predictors of malaria transmission and spatial maps provided in this study could aid in developing framework to mitigate malaria and identify its hotspots for urgent intervention in the endemic regions.
Conflict of interest statement
The authors declare no competing interests.
Figures
References
-
- World Health Organisation. World Malaria Report (2015).
-
- World Health Organisation. World Health Organisation Fact Sheets, https://www.who.int/news-room/fact-sheets/detail/malaria (2019)
-
- World Health Organisation. World Malaria Report 2018. Geneva: World Health Organization (2018).
MeSH terms
LinkOut - more resources
Full Text Sources
Medical
