. 2020 Jan;12(1):26-35.
doi: 10.1038/s41557-019-0369-8. Epub 2019 Nov 25.

Designer DNA architecture offers precise and multivalent spatial pattern-recognition for viral sensing and inhibition

Affiliations

Designer DNA architecture offers precise and multivalent spatial pattern-recognition for viral sensing and inhibition

Paul S Kwon et al. Nat Chem. 2020 Jan.

Abstract

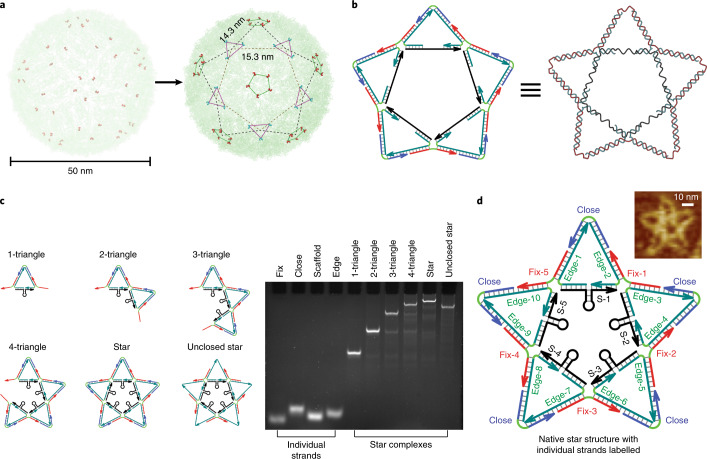
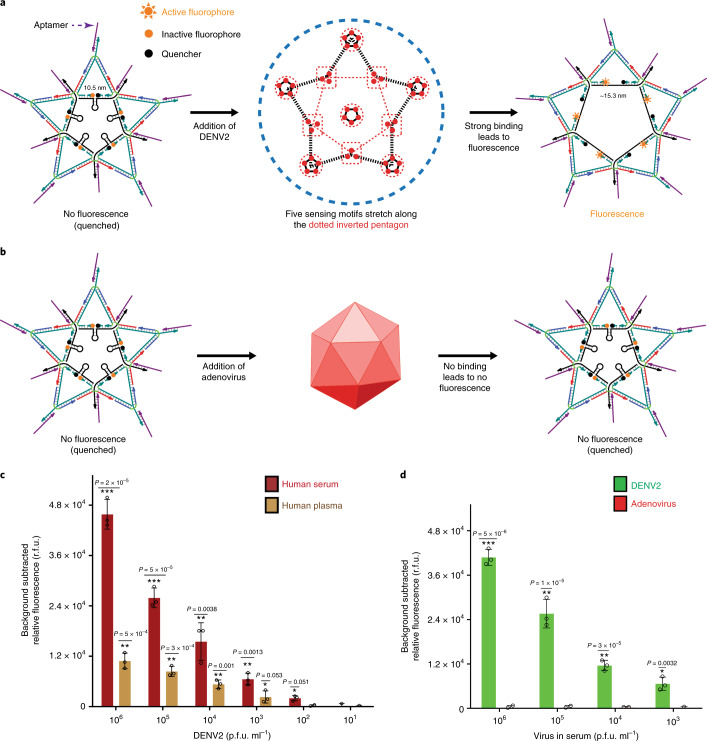
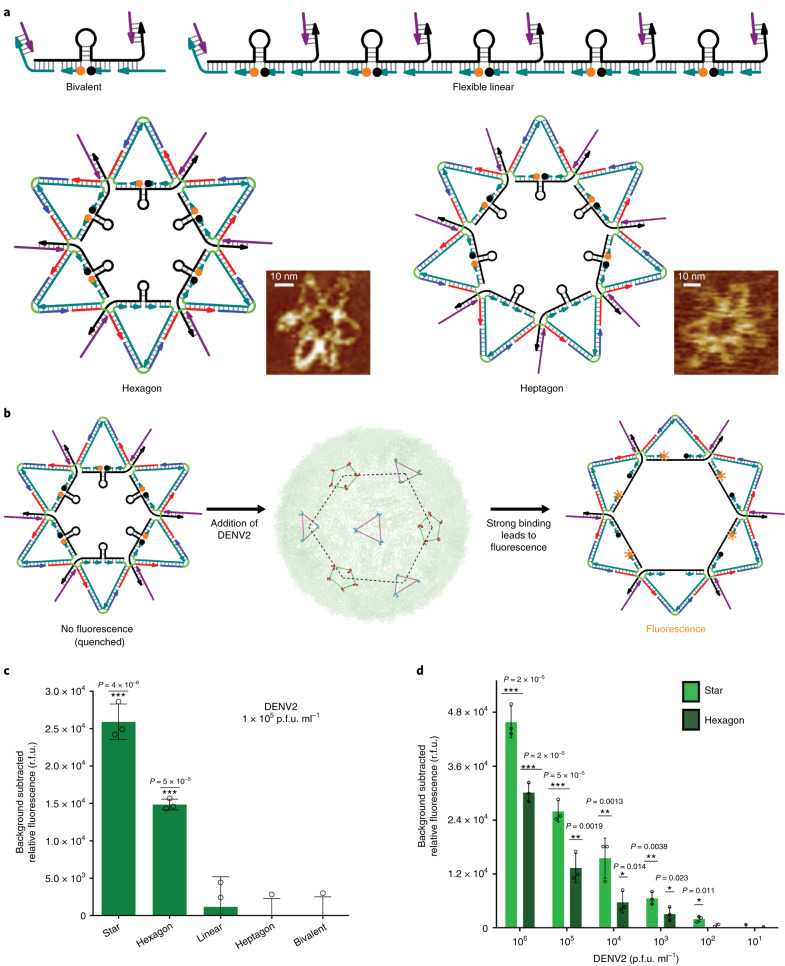
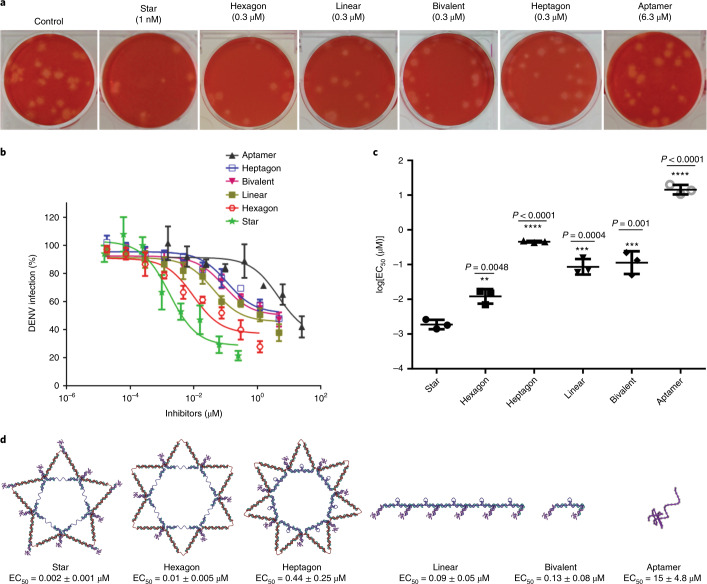
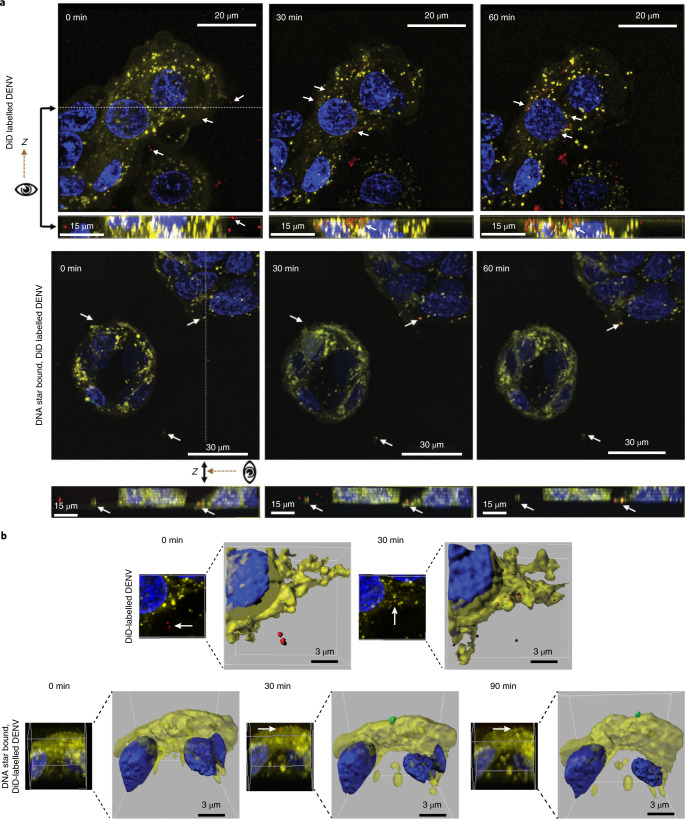
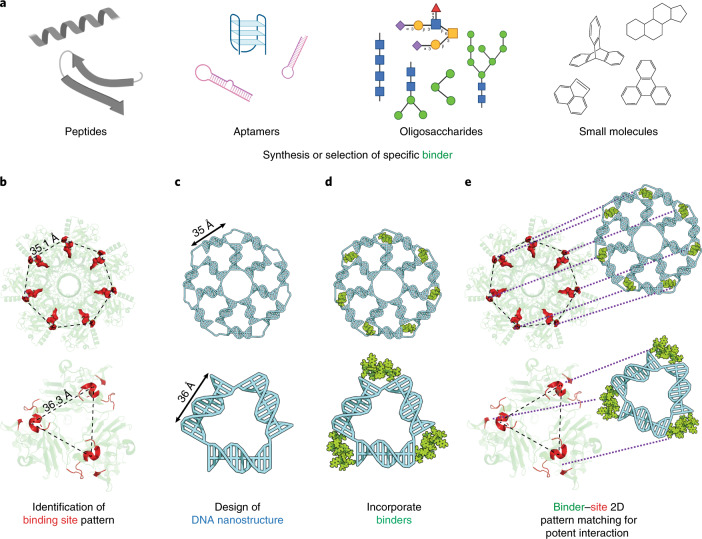
DNA, when folded into nanostructures with a specific shape, is capable of spacing and arranging binding sites into a complex geometric pattern with nanometre precision. Here we demonstrate a designer DNA nanostructure that can act as a template to display multiple binding motifs with precise spatial pattern-recognition properties, and that this approach can confer exceptional sensing and potent viral inhibitory capabilities. A star-shaped DNA architecture, carrying five molecular beacon-like motifs, was constructed to display ten dengue envelope protein domain III (ED3)-targeting aptamers into a two-dimensional pattern precisely matching the spatial arrangement of ED3 clusters on the dengue (DENV) viral surface. The resulting multivalent interactions provide high DENV-binding avidity. We show that this structure is a potent viral inhibitor and that it can act as a sensor by including a fluorescent output to report binding. Our molecular-platform design strategy could be adapted to detect and combat other disease-causing pathogens by generating the requisite ligand patterns on customized DNA nanoarchitectures.


Conflict of interest statement

The authors declare no competing interests.

Figures

Fig. 1
Fig. 1. Dimensional pattern analysis and scaffold design principle.
a, Distribution of DENV ED3 clusters. The diameter of a virion is 50 nm. Orthodromic distances between trivalent–trivalent and trivalent–pentavalent clusters are 15.3 nm and 14.3 nm, respectively. b, The DNA star scaffold is designed to match the pattern and spacing of ED3 clusters. Each DNA strand is represented by an arrow going from the 5′ end to the 3′ end. Non-hybridizing polyT regions are for angle formation between the edges. A 3D representation of the scaffold is also shown. c, A schematic of the partial or complete star complexes (left) and characterization of the DNA star structure using non-denaturing PAGE (right). Yields of the 1-triangle, 2-triangle, 3-triangle, 4-triangle, star and unclosed star complexes are 100%, 98.2%, 81.2%, 86.3%, 88.1% and 98.3%, respectively. Experiments were repeated independently three times, with similar results. d, Native structure of the star, consisting of five ‘scaffold’ strands (S-1 to S-5) to form the internal edges, ten ‘edge’ strands to connect internal and external edges, five ‘fix’ strands to connect the external edges and one ‘close’ strand to cap all the external edges of each triangle. Single-stranded regions of the scaffold’ strands form stem-loops. AFM confirmed the formation. Experiments were repeated independently three times, with similar results.
Fig. 2
Fig. 2. DNA star sensor.
a, 3′ overhangs on the DNA star allow aptamer incorporation. The 10 incorporated aptamers match the pattern and spacing of ED3 clusters. Five fluorophore–quencher pairs along the inner pentagon of the star remain in a quenching fluorescence resonance energy transfer until binding interactions between aptamers and ED3 domains unzip the hairpins into ssDNA, enabling a fluorescent readout. b, Schematic showing that the DNA star–aptamer complex will remain quenched if it does not recognize its target. In this case, the presence of another virus, the adenovirus, will not enable a fluorescent readout due to insufficient binding. c, A series of DENV concentrations were used to determine the LoD of the star sensor in human serum (1 × 102 p.f.u. ml−1) and human plasma (1 × 103 p.f.u. ml−1). Data are presented as mean ± s.d., n = 3 biologically independent samples. A two-sided t-test was performed to test significance against the background (*P < 0.1; **P < 0.01; ***P < 0.001). Individual data points below background are not shown but were involved in error calculation. d, The star sensor does not detect the presence of the adenovirus in serum. Data are presented as mean ± s.d., n = 3 biologically independent samples. A two-sided t-test was performed to test significance against the background (*P < 0.01; **P < 0.001; ***P < 0.00001). Individual data points below background are not shown but were involved in error calculation.
Fig. 3
Fig. 3. Evaluation of control sensors.
a, Schematic showing the design of bivalent, flexible, linear, hexagon-centred and heptagon-centred control sensors. AFM imaging verified formation of the 2D scaffolds. AFM experiments were repeated independently three times, with similar results. b, Schematic demonstrating that ED3 clusters show a hexagonal-shaped pattern when a trivalent ED3 cluster is centred. The pattern-matching hexagon scaffold allows aptamers to strongly bind the ED3 domains, enabling a fluorescent readout. c, At a DENV concentration of 1 × 105 p.f.u. ml−1, the DNA star and hexagon sensors exhibit good detection ability. The linear sensor exhibits poor detection ability. Heptagon and bivalent sensors show little to no sensing. Data are presented as mean ± s.d., n = 3 biologically independent samples. A two-sided t-test was performed to test significance against the background (***P < 0.0001). Individual data points below background are not shown but involved in error calculation. d, A comparison of the DNA star and hexagon sensors in DENV sensing capabilities. The hexagon sensor exhibits a LoD of 103 p.f.u. ml−1. Data are presented as mean ± s.d., n = 3 biologically independent samples. A two-sided t-test was performed to test significance against the background (*P < 0.05; **P < 0.005; ***P < 0.0005). Individual data points below background are not shown but were involved in error calculation.
Fig. 4
Fig. 4. Evaluation of inhibitors.
a, Representative plaque assays corresponding to the aptamer concentration and scaffold. The no-inhibitor treated control well is on the left, then the other wells are arranged from highest reduction to lowest reduction from left to right, regardless of 2D or 1D scaffolding. The experiments were repeated independently three times, with similar results. b, Dose-dependent, plaque-reducing inhibition curves for the monovalent aptamer (abbreviated as aptamer), heptagon, bivalent, flexible linear (abbreviated as linear), hexagon and star inhibitors. Inhibitor concentration was standardized through aptamer concentration. Data are presented as mean ± s.d., n = 3 biologically independent experiments. c, A comparison of each inhibitor’s fold change in EC50. Data are presented as mean ± s.d., n = 3 biologically independent experiments. A two-sided t-test was performed to test significance against the DNA star (**P < 0.005; ***P ≤ 0.001; ****P < 0.0001). d, A schematic representing the inhibitory nanostructures with their corresponding mean EC50 values ± s.d., n = 3 biologically independent experiments. The schematic for the star and hexagon show an unzipped hairpin region (as part of the dark blue strands), because potent pattern matching occurs. Other scaffolds represent the hairpins as stem-loop structures to indicate a lack of potent pattern matching.
Fig. 5
Fig. 5. Confocal imaging.
a, DENV virions (red), membrane bound structures (yellow) and cell nuclei (blue) were labelled with DiD, Dil and Hoescht stains, respectively. Due to the combined effects of fluorescence spillover and the merged red and green signals, co-localized DNA star-bound virions appear yellow. Representative viral particles are indicated with white arrows. Top row: viral accumulation over time for the no-inhibitor treated condition. Bottom row: viral entry inhibition over time during DNA star treatment. Each panel is accompanied by a cross-section of the same image (along the dotted lines in the main images). An eye symbol orients the viewing direction for the cross-sections reconstructed from Z stacks, with images taken at different focal planes. b, A volume reconstruction of a close-up confocal view shows unbound DENV particles (red spheres) accumulating in the cell (top panels) and a DNA star-bound DENV particle (green sphere) inhibited from cell entry (bottom panels). Each confocal experiment was performed in singlicate.
Fig. 6
Fig. 6. Design principle of DNA nanostructure-based method with pattern-recognition properties.
a, Selecting, synthesizing or evolving a specific binder. Binders can include, but are not limited to, peptides, aptamers, oligosaccharides or small molecules. b, Analysis of the spatial surface pattern of the binding sites. c, Designing a DNA nanostructure that mirrors the spatial surface pattern. d, Incorporating binders at appropriate locations onto the DNA. e, Adapting the potent, multivalent DNA nanostructure–binder complex for the intended application. Two more simple examples, where curvature is not accounted for, are used for illustration. be, Top: a heptagon-shaped DNA structure, containing a seven-arm junction, matches heptavalent binding sites on anthrax. Bottom: a triangle-shaped DNA structure matches haemagglutinin trimers on influenza virus.

Similar articles

Cited by

References

    1. Harrison SC. Virology: looking inside adenovirus. Science. 2010;329:1026–1027. - PubMed
    1. Krantz BA, et al. A phenylalanine clamp catalyzes protein translocation through the anthrax toxin pore. Science. 2005;309:777–781. - PMC - PubMed
    1. Bandlow V, et al. Spatial screening of hemagglutinin on influenza A virus particles: sialyl-LacNAc displays on DNA and PEG scaffolds reveal the requirements for bivalency enhanced interactions with weak monovalent binders. J. Am. Chem. Soc. 2017;139:16389–16397. - PubMed
    1. Mourez M, et al. Designing a polyvalent inhibitor of anthrax toxin. Nat. Biotechnol. 2001;19:958–961. - PubMed
    1. Rai P, et al. Statistical pattern matching facilitates the design of polyvalent inhibitors of anthrax and cholera toxins. Nat. Biotechnol. 2006;24:582–586. - PubMed

Publication types

MeSH terms