. 2019 Dec;21(12):1490-1503.
doi: 10.1038/s41556-019-0417-z. Epub 2019 Nov 25.

A Tppp3+Pdgfra+ tendon stem cell population contributes to regeneration and reveals a shared role for PDGF signalling in regeneration and fibrosis

Affiliations

A Tppp3+Pdgfra+ tendon stem cell population contributes to regeneration and reveals a shared role for PDGF signalling in regeneration and fibrosis

Tyler Harvey et al. Nat Cell Biol. 2019 Dec.

Abstract

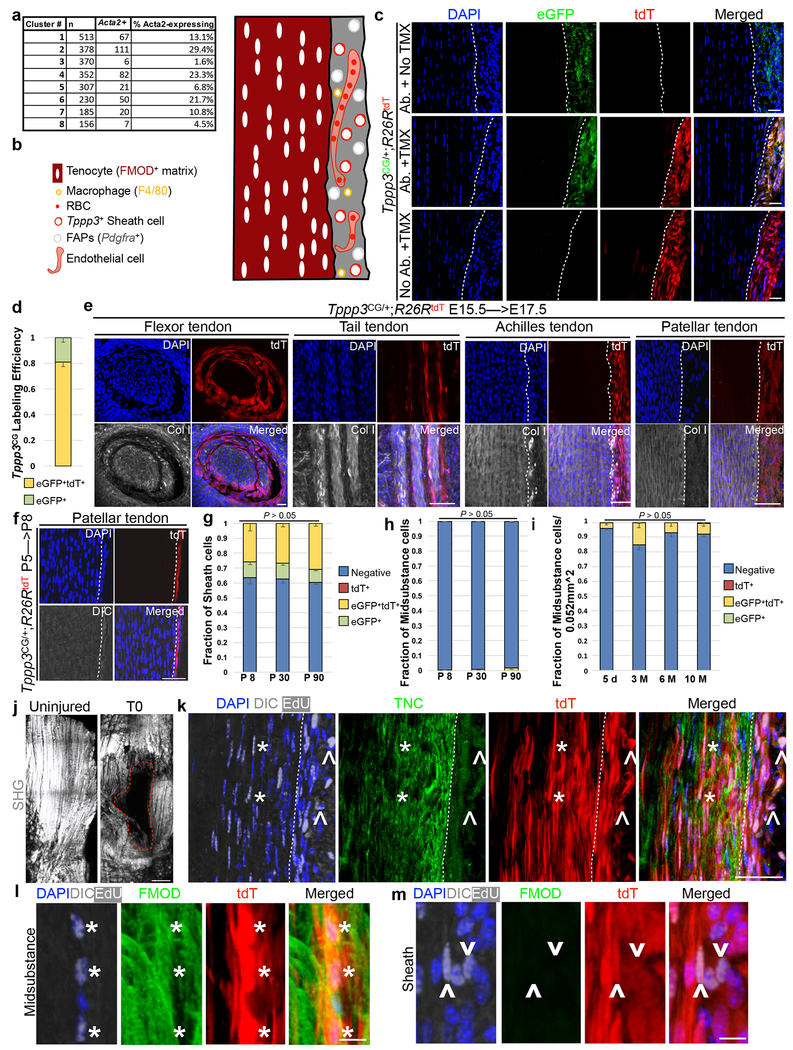
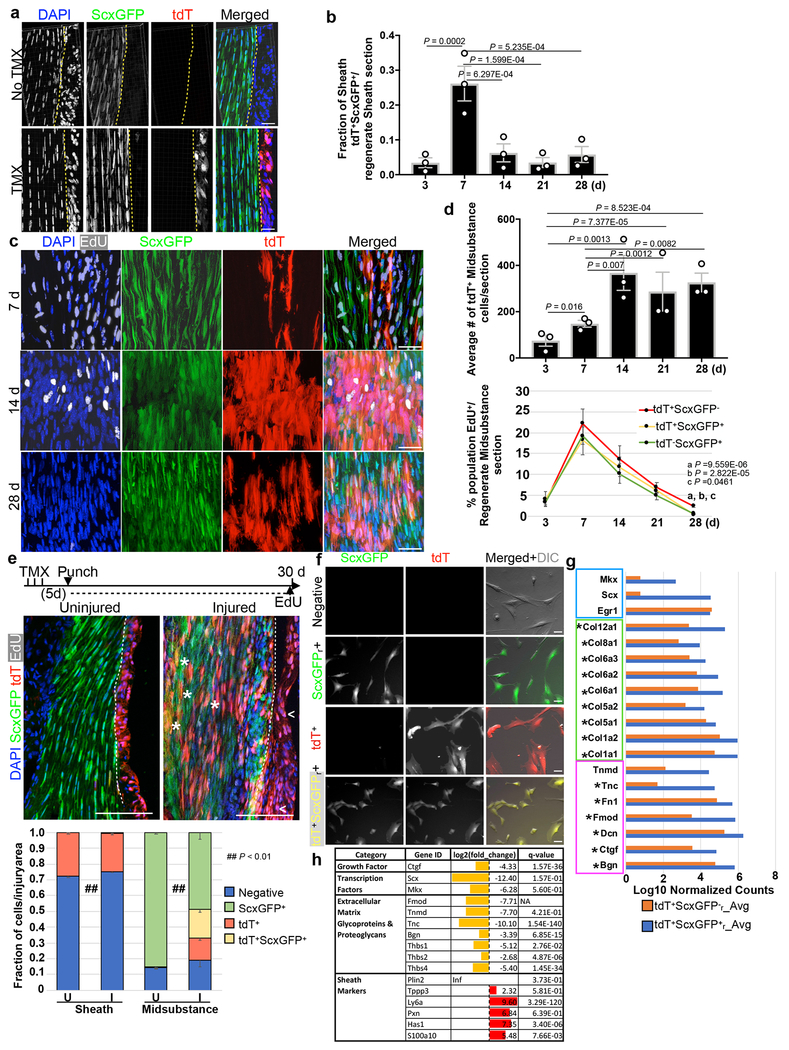
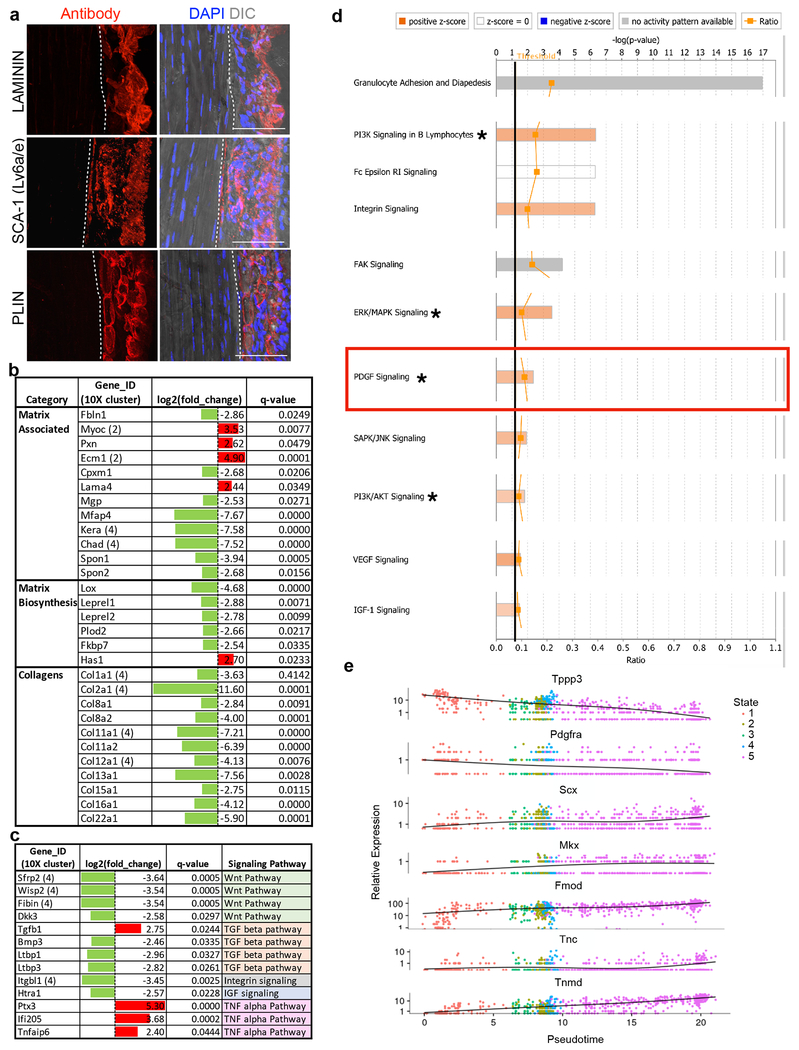
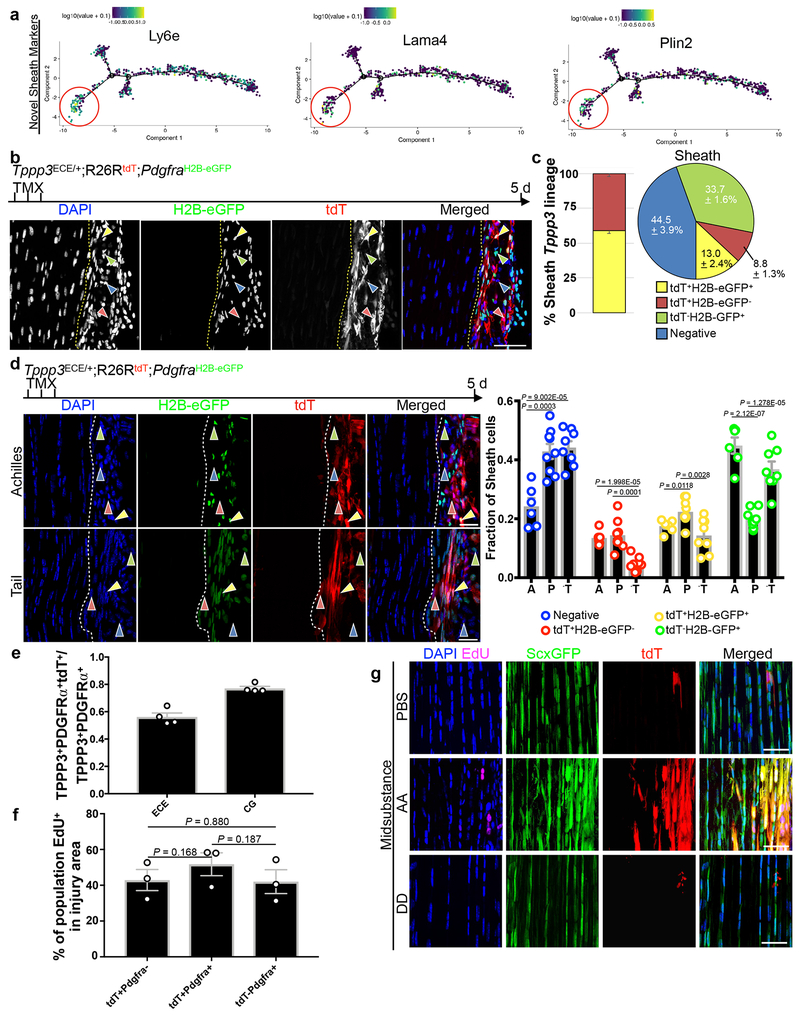
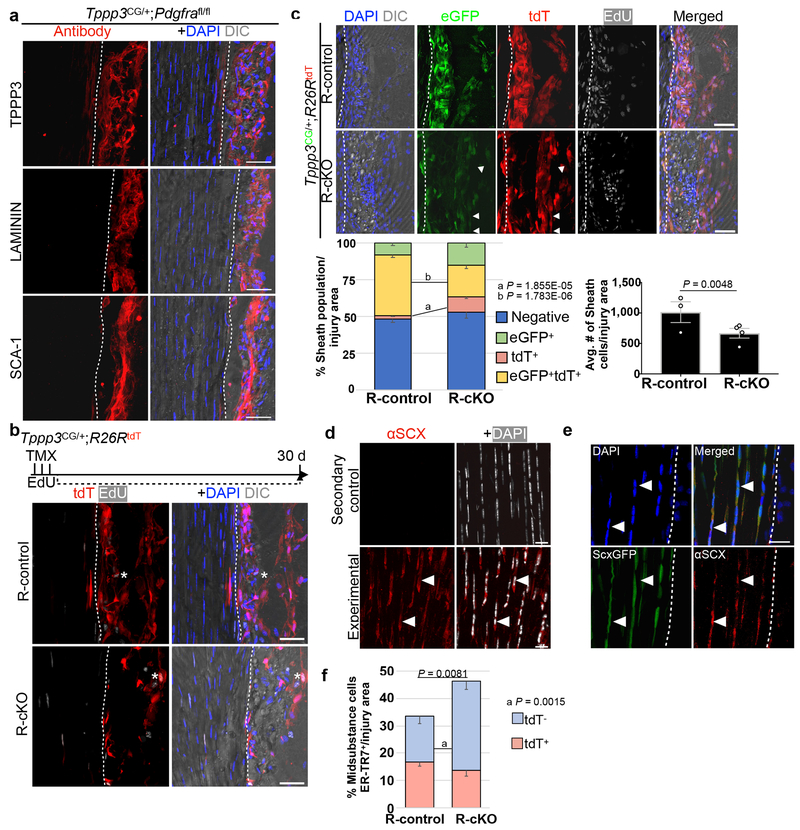
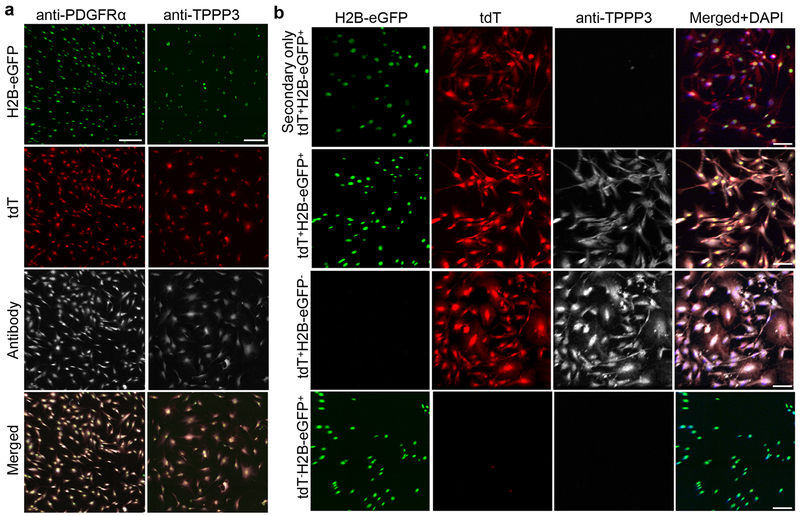
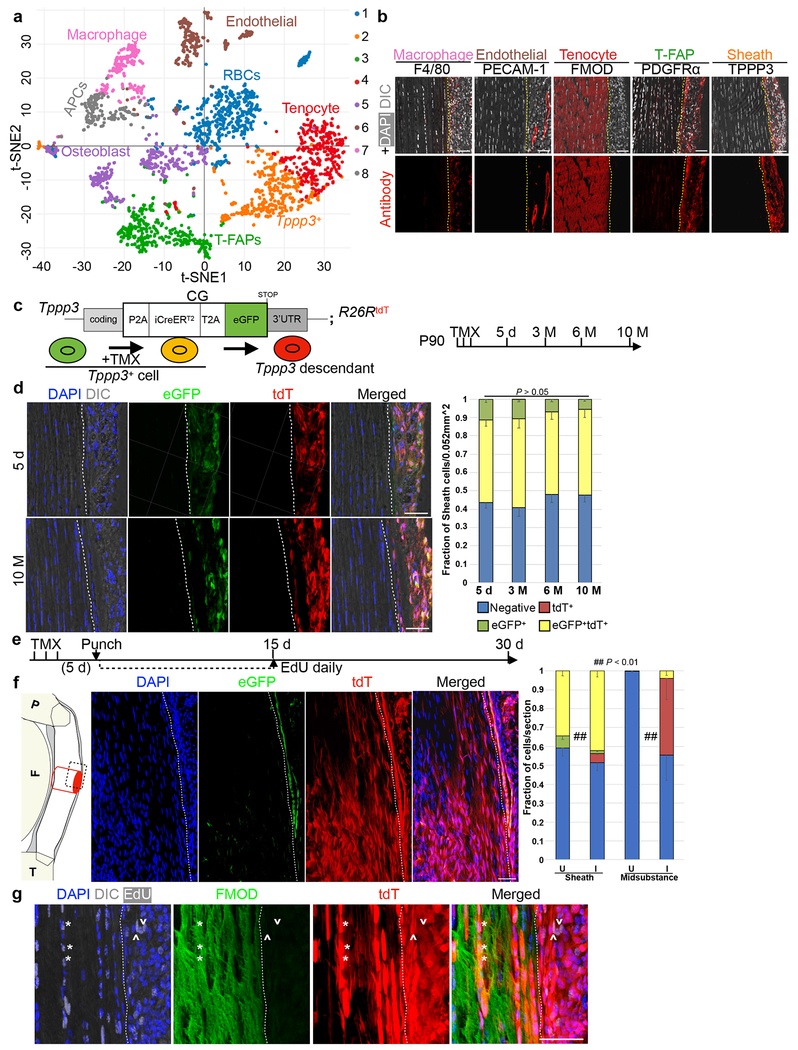
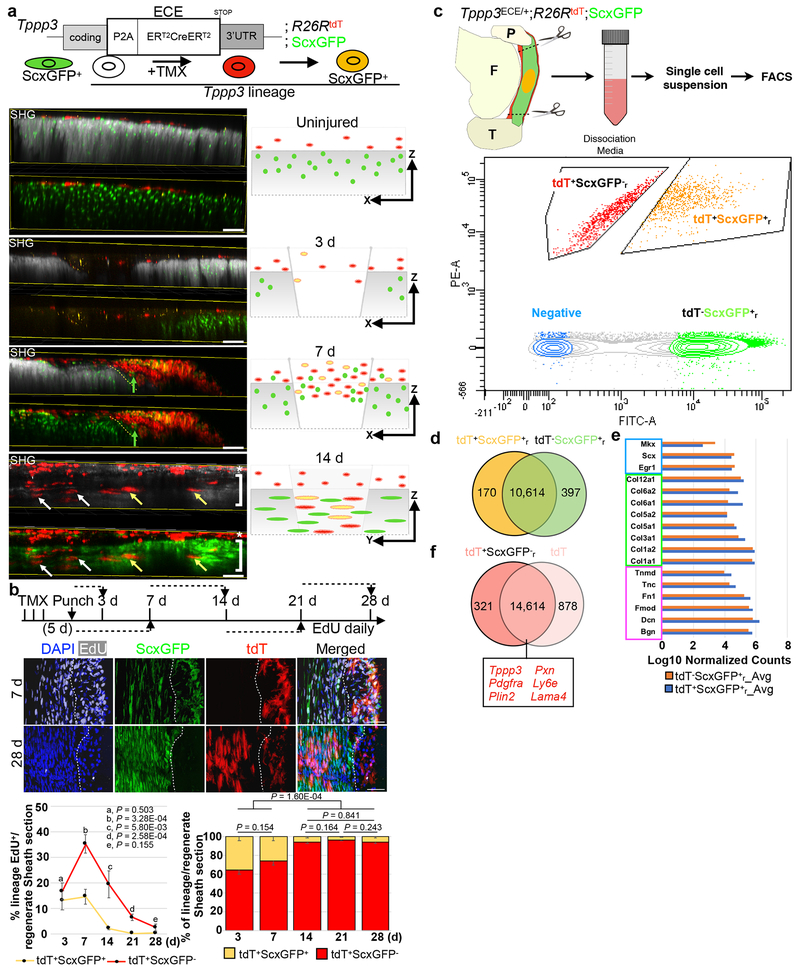
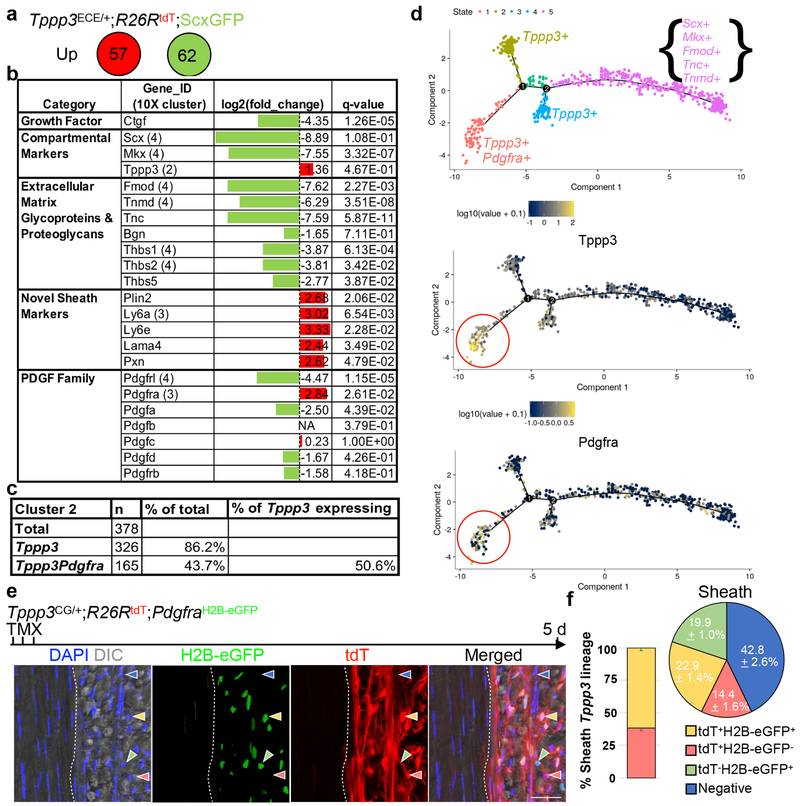
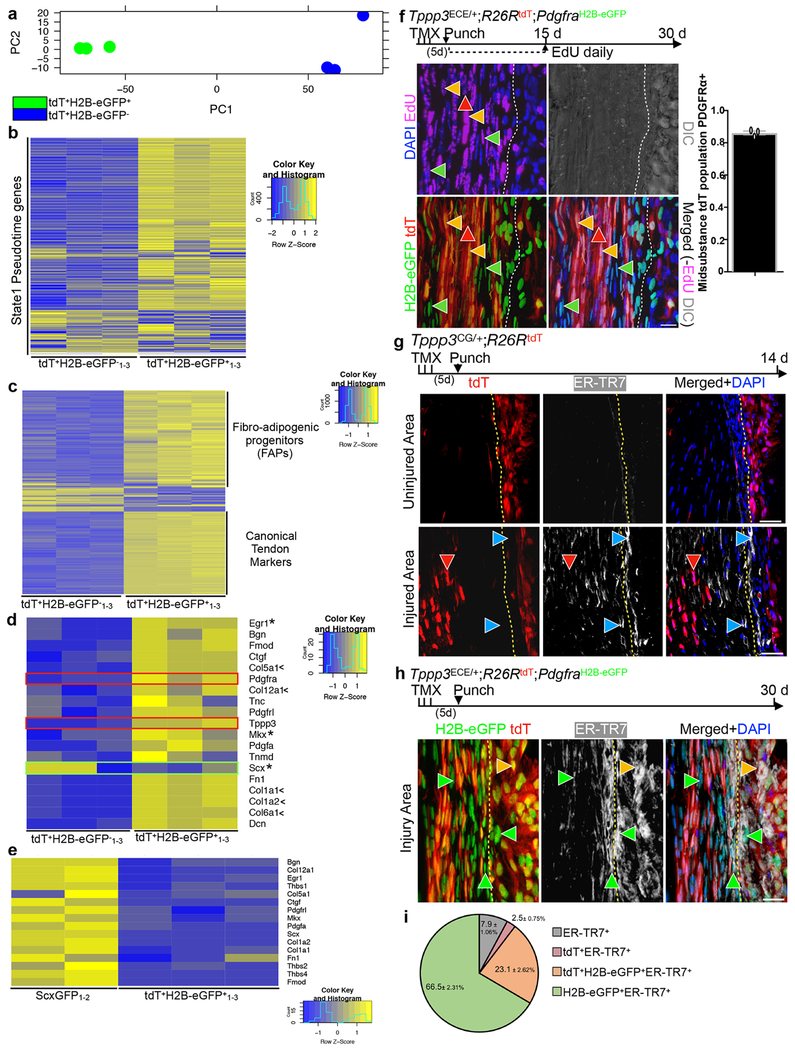
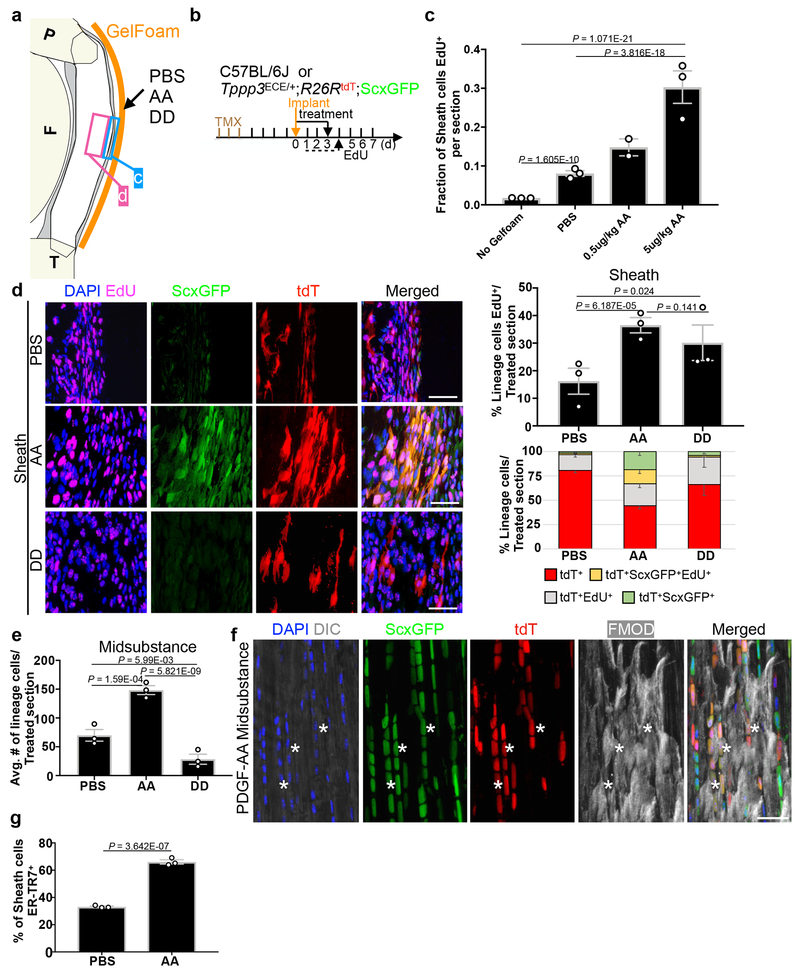
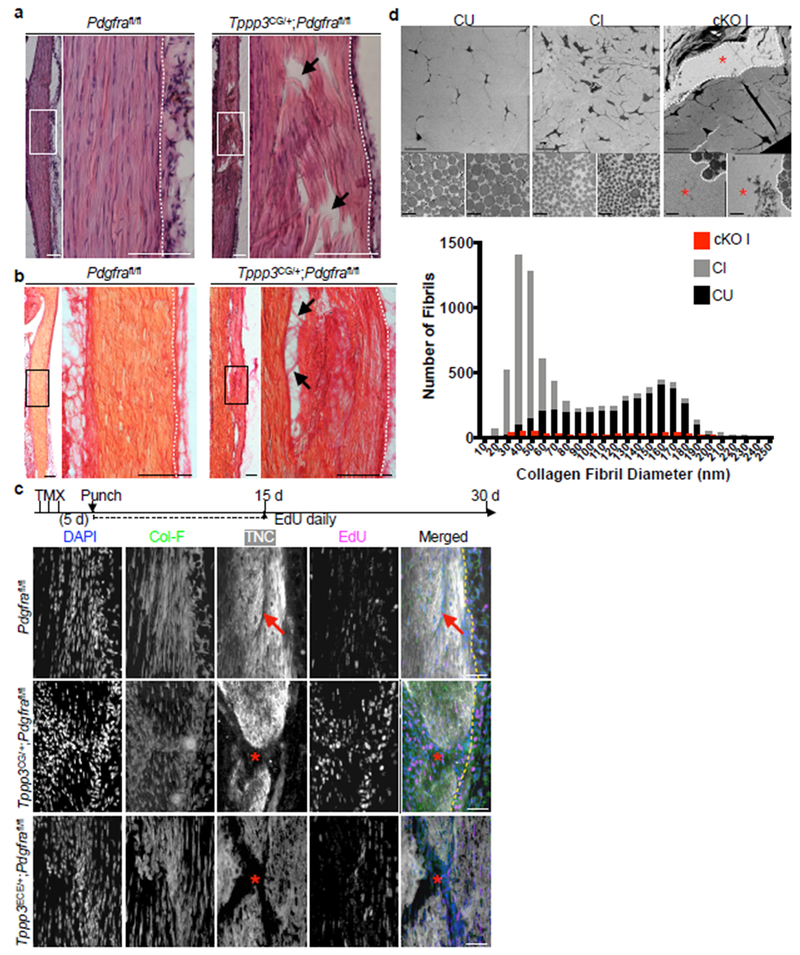
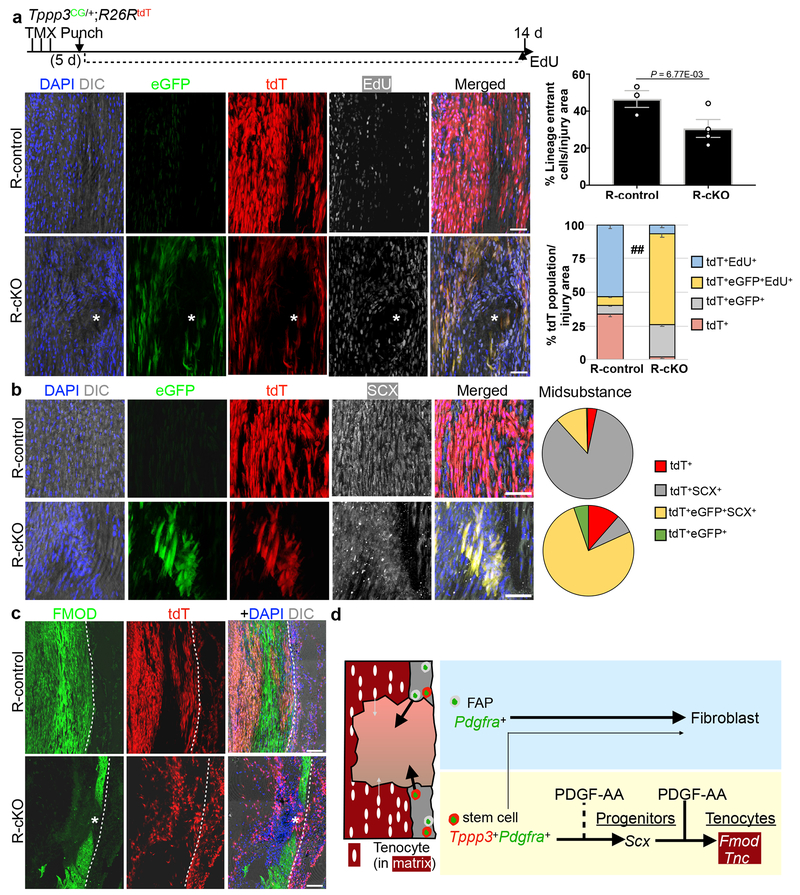
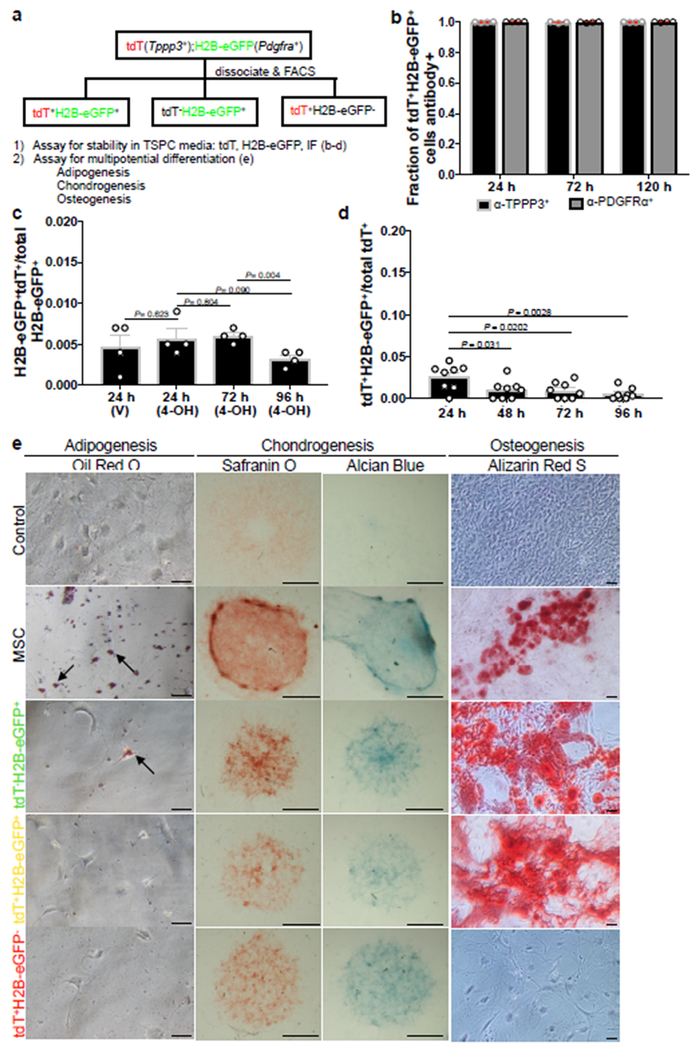
Tendon injuries cause prolonged disability and never recover completely. Current mechanistic understanding of tendon regeneration is limited. Here, we use single-cell transcriptomics to identify a tubulin polymerization-promoting protein family member 3-expressing (Tppp3+) cell population as potential tendon stem cells. Through inducible lineage tracing, we demonstrate that these cells can generate new tenocytes and self-renew upon injury. A fraction of Tppp3+ cells expresses platelet-derived growth factor receptor alpha (Pdfgra). Ectopic platelet-derived growth factor-AA (PDGF-AA) protein induces new tenocyte production while inactivation of Pdgfra in Tppp3+ cells blocks tendon regeneration. These results support Tppp3+Pdgfra+ cells as tendon stem cells. Unexpectedly, Tppp3-Pdgfra+ fibro-adipogenic progenitors coexist in the tendon stem cell niche and give rise to fibrotic cells, revealing a clandestine origin of fibrotic scars in healing tendons. Our results explain why fibrosis occurs in injured tendons and present clinical challenges to enhance tendon regeneration without a concurrent increase in fibrosis by PDGF application.


Conflict of interest statement

The authors declare no competing financial interests.

Competing Interests

The authors declare no conflicts of interest.

Figures

Extended Data 1
Extended Data 1. Tppp3CG driver is TMX dependent.
a, Cells expressing ≥1 UMI of Acta2 from (Fig. 1a). b, Cartoon summary (right) from cell atlas (Fig. 1a) and immunofluorescence (Fig. 1b); midsubstance (maroon), sheath (gray), and key (left). c, Fluorescence images of Tppp3CG/+;R26RtdT tendon; upper, no TMX control with anti-GFP antibody (Ab.); middle, +TMX and Ab.; lower, +TMX and no Ab. control–eGFP expressed by the Tppp3CG driver is only detectable with Ab. staining; n=3. Tppp3CG driver labels 38.3±2.6 (Mean±SEM)% of sheath cells. d, Tppp3CG driver labeling efficiency is 79.5±3.4 (Mean±SEM)%; n=3 animals; N=9 samples/n. e, Fluorescent images of Tppp3CG/+;R26RtdT tendons: digit flexor (leftmost), tail (left), Achilles (right) or Patellar (rightmost); TMX pulsed at embryonic day (E)15.5 and chased to E17.5; Col I, collagen-I antibody stained; dashed line, midsubstance-sheath boundary; n=3 animals/tendon. f, Fluorescent images of Tppp3CG/+;R26RtdT Patellar tendon; TMX pulsed at postnatal day (P)5 and chased to P8; dashed line, midsubstance-sheath boundary; n=3 animals. g, Sheath cell fractions (key; right) over time; n=3 animals/time point; N=3 samples/n; all ns; mean for (Negative, eGFP+, tdT+, and eGFP+tdT+) at specified time: (P8; 0.636, 0.104, 0, 0.260), (P30; 0.627, 0.104, 0, 0.269), (P90; 0.602, 0.089, 0, 0.308). h, Midsubstance cell fractions (key same as g) over time; n=3 animals/time point; N=3 samples/n; all ns; mean for (Negative, eGFP+, tdT+, and eGFP+tdT+) at specified time: (P8; 0.994, 0, 0, 0.006), (P30; 0.991, 0, 0.001, 0.008), (P90; 0.984, 0, 0.001, 0.015). i, Midsubstance cell fractions (key; right) over time; n=3 animals/time point; N=9 samples/n; all non-significant by Chi-square test; mean for (Negative, eGFP+, tdT+, and eGFP+tdT+) at specified time: (5d; 0.961, 0.004, 0, 0.035), (3M; 0.849, 0.003, 0, 0.148), (6M; 0.929, 0, 0, 0.071), (10M; 0.920, 0.009, 0, 0.071). j, Wholemount multiphoton images of uninjured and biopsy punched (immediately after (T0)) Patellar tendon; n=3; collagen fibers visualized by second harmonic generation (SHG). k, Regenerated tendon immuno-stained for Tenascin-C (TNC); asterisks, proliferated Tppp3-lineage cells in TNC matrix of midsubstance; ^, self-renewed Tppp3-lineage in sheath with lower TNC signal; n=3. (l, m) Zoomed in FMOD images from Fig. 1g; n=3 independent repeats; asterisks, proliferated Tppp3-lineage in midsubstance (l); ^, self-renewed Tppp3-lineage in sheath (m). Scale bar = 30 (c), 15 (flexor) 50 (tail, Achilles, Patellar) (e), 40 (f), 200 (j), 50 (k), 10 (l, m) μm. Error bars = SEM (g, h, i). Two-tailed Student’s t-test (g, h).
Extended Data 2
Extended Data 2. Tppp3ECE and ScxGFP allow for compartmental molecular characterization.
a, Tppp3ECE/+;R26RtdT;ScxGFP tendon showed TMX-dependent cell marking (tdT+) in sheath; n=3. Given the proportion of labeled sheath cells (22.7 ± 3.7 (Mean±SEM) %) relative to Tppp3CG, Tppp3ECE driver labeling efficiency is ~60%; dashed line, midsubstance-sheath boundary. ScxGFP signal was detected without antibody–not every midsubstance cell is ScxGFP+. b, Fractions of sheath tdT+ScxGFP+ cells at given dpi; n=3 animals/time point, N=3 samples/n; mean per time-point (3d, 7d, 14d, 21d, 28d) as follows: (0.034, 0.262, 0.062, 0.035, 0.058). c, Midsubstance images at specified regeneration windows related to Fig. 2b, n=3 independent repeats. d, Bar graph (top) for average number of midsubstance tdT+ cells at specified time point; mean at specified time-point (3d, 7d, 14d, 21d, 28d): (74.9, 148, 367.6, 387.1, 326.7). Line graph (bottom) for % of proliferated (EdU+) midsubstance Tppp3-lineage marked and ScxGFP+ cells (keys, upper right); n=3 animals/time point, N=3 samples/n; comparisons for a, tdT+ScxGFP vs tdT+ScxGFP+, b, tdT+ScxGFP vs tdTScxGFP+, c, tdT+ScxGFP+ vs tdTScxGFP+ at 28 d; all other time comparisons not-significant. e, Regeneration assay for 30 d with daily EdU throughout; n=3 animals/condition, N=3 samples/n: asterisks, tdT+ScxGFP+EdU+ cells in midsubstance; <, tdT+EdU+ cells in sheath. Below, quantified sheath and midsubstance cell fractions (key; right) in uninjured (U) and injured (I) conditions; Chi-squared test ## P < 0.01. t-test, in parentheses following specified cell fraction in paired order of Sheath Uninjured-Sheath Injured and Midsubstance Uninjured-Midsubstance Injured: Negative (P=0.0077, P=0.299), ScxGFP+ (P=0.332, P=3.63E-07), tdT+ (P=0.0022, P=8.32E-08), tdT+ScxGFP+ (P=0.068, P=3.06E-08). Mean for (Negative, ScxGFP+, tdT+, and tdT+ScxGFP+) fractions for specified condition as follows: (Sheath U; 0.723, 0, 0.277, 0), (Sheath I; 0.751, 0.001, 0.242, 0.006), (Midsubstance U; 0.145, 0.854, 0, 0.001), (Midsubstance I; 0.188, 0.485, 0.143, 0.184). f, Fluorescent images of FACS isolated cells from 30 d regenerated Tppp3ECE/+;R26RtdT;ScxGFP tendons related to Fig. 2c, n=3 independent repeats. g, Averaged, normalized log10 counts from DESeq comparison between tdT+ScxGFP+ and tdTScxGFPr+ cells: arranged in boxes by transcription factors (blue), collagens (green), and proteoglycans/glycoproteins (magenta); q-value < 0.05 (*). h, Table for selected gene categories: log2(fold-change) directionality of enrichment in tdT+ScxGFP+r (yellow) versus uninjured tdT+ (red) cells; n=2 samples. Unpaired two-tail Student’s t-test (b, d, e); error bars = SEM (b, d, e); scale bars= 30 (a, c), 50 (e, f) μm.
Extended Data 3
Extended Data 3. Novel sub-compartmental markers, pathway analysis, and additional pseudotime trajectories.
a, Immunofluorescence of novel sheath markers (LAMININ for Lama4; SCA-1 for Ly6a/e; PLIN for Plin2) identified in Fig. 3b; dashed line, midsubstance-sheath boundary; n=3 independent repeats; scale bar = 50 μm. b, Table for genes in selected matrix categories from Fig. 3a; same organization as for Fig. 3b, n=2 replicates. c, Table for differentially expressed signaling pathway genes from Fig. 3a, n=2 replicates. d, Canonical Pathways list generated by Ingenuity Pathway Analysis® (IPA) on DE analysis gene list filtered by q-value < 0.05; positive z-score (orange) indicates predicted activation; PDGF signaling (red boxed) and its downstream effector branches ERK/MAPK and PI3K/AKT are enriched (indicated by asterisks), n=2 replicates. e, Relative expression of genes (as indicated) plotted in pseudotime, colored by state, and with expression level trend (line), related to Fig 3d.
Extended Data 4
Extended Data 4. Tppp3+Pdgfra+ sub-population has tenogenic propensity.
a, Novel Sheath markers: Log10 gene expression level specified per individual cell plotted in pseudotime trajectory of cluster 2 and 4 cells. Red circles (enrichment in state 1), correlating with Tppp3 and Pdgfra (Fig. 3d), suggesting a unique role for state 1-Tppp3+Pdgfra+ cells (see Fig. 3d). b, Fluorescent images of Tppp3ECE/+;R26RtdT;PdgfraH2B-eGFP tendon 5 d after TMX-induced marking; n=3; dashed line, midsubstance-sheath boundary; yellow arrowheads, tdT+H2B-eGFP+ cells; red arrowheads, tdT+H2B-eGFP; green arrowheads, tdTH2B-eGFP+; blue arrowheads, negative; direct fluorescent imaging to visualize GFP signal from PdgfraH2B-eGFP. c, Relative cell fractions (keys; bottom) within Tppp3+(tdT+) population (bar graph) and within the sheath (pie chart) from data in (b); n=3 animals, N=3 samples/n; mean(%)=(tdT+H2B-eGFP+, 59.1; tdT+H2B-eGFP, 40.9). d, (Left) Fluorescent images of Tppp3CG/+;R26RtdT;PdgfraH2B-eGFP Achilles or tail tendon 5 d after TMX-induced marking; n=3 animals; dashed line, midsubstance-sheath boundary; arrowheads same code as b; direct fluorescent imaging to visualize GFP signal from PdgfraH2B-eGFP. (Right) Bar graph of fraction of sheath cell populations across respective tendon types; A, Achilles; P, Patellar; T, tail; circles represent individual n; mean per specified population (Negative, tdT+H2B-eGFP, tdT+H2B-eGFP+, tdTH2B-eGFP+) in tendon type (A; 0.242, 0.134, 0.175, 0.448), (P; 0.428, 0.144, 0.229, 0.199), (T; 0.442, 0.047, 0.143, 0.368). e, Stem cell (Tppp3+PDGFRα+) recombination efficiency per Tppp3 driver; Tppp3CG efficiency is 77.0±1.6 (Mean±SEM)% and Tppp3ECE efficiency is 56.1±2.9 (Mean±SEM)%; determined in situ by tdT+ co-localization with anti-TPPP3 antibody+PDGFRaH2BeGFP+ cells; circles represent n; n=4 samples. f, Bar graph of proliferation indices from entrant populations corresponding to Fig. 4f, all comparisons non-significant; circles indicate n; n=3 animals, N=3 samples/n; mean (%) per population (tdT+Pdgfra, 43.0 ; tdT+Pdgfra+, 51.8; tdTPdgfra+, 42.0). g, Fluorescent images of midsubstance with specified treatment on Tppp3ECE/+;R26RtdT;ScxGFP tendon; n=3 independent repeats. Error bars = SEM (c, d, e, f); scale bar = 30 (d, g), 50 (b) μm; two-tailed Student’s t-test (d, f).
Extended Data 5
Extended Data 5. PDGFRα signaling is required for regeneration but not for homeostasis.
a, Immunofluorescence for indicated sheath markers on Tppp3CG/+;Pdgfrafl/fl tendon with same experimental scheme as (Fig. 6c) except for without punch and EdU; n=3; dashed line, midsubstance-sheath boundary. b, Experimental scheme and fluorescent images of R-control, Tppp3CG/+;R26RtdT, and R-cKO, Tppp3CG/+;R26RtdT;Pdgfrafl/fl; chased 30 d after TMX; n=3-4/condition; EdU daily throughout; dashed line, midsubstance-sheath boundary; asterisk, tdT+EdU+ cell. c, Fluorescent images of Rcontrol and R-cKO of sheath compartment in regenerate area; harvested at 14 dpi and EdU daily throughout; n=3 (R-control), 4 (R-cKO) animals/condition; dashed line, midsubstance-sheath boundary; arrowheads, eGFPtdT+ cells. Stacked column for the distribution (in %) of various cell populations (keys at side); mean (%) for specified population (Negative, eGFP+, tdT+, eGFP+tdT+) as follows: (R-control; 48.3, 8.0, 2.2, 41.5), (R-cKO; 53.0, 15.1, 10.6, 21.2). Bar graph for average number of sheath cells per injury area; mean = (R-control, 1013; R-cKO, 667). d, Controls for SCX immunofluorescence; anti-SCX antibody reacts strongly to midsubstance cells (arrowheads); n=3 independent repeats. e, Fluorescent micrographs of ScxGFP tissue stained with anti-SCX antibody, 93.6±1.9 (mean±SEM) % of ScxGFP+ cells are anti-SCX+; n=3 independent repeats; dashed line, midsubstance-sheath boundary; arrowheads, anti-SCX+ScxGFP+ cells. f, Stacked columns for the distribution (in %) of various cell populations (keys at side); n=3 animals; mean (%) per population (tdT, tdT+) as indicated: R-control (16.7, 16.8), R-cKO (32.7, 13.8). Unpaired two-tail Student’s t-test (c, f); error bars = SEM (c, f); scale bar = 20 (d, e), 30 (b), 50 (a, c) μm.
Extended Data 6
Extended Data 6. Sheath subpopulations exhibit little conversion in vitro.
a, Fluorescent micrographs of purified tdT+H2B-eGFP+ cultured for 24 h in TSPC conditions stained with anti-PDGFRα or anti-TPPP3. b, Fluorescent micrographs of anti-TPPP3 antibody validation on cultured sub-populations. n=3 independent repeats (a, b). Scale bars = 100 (b), 200 (a) μm.
Extended Data 7
Extended Data 7. Example of FACS gating strategy
Cells were selected in FSC/SSC dot plot to remove debris; single cells were gated using the FSC-H/FSC-W dot plot. GFP+ (FITC-A), tdT+ (PE-A) cells were gated and compared with a control sample without tamoxifen induction or carrying ScxGFP. Tomato+-only cells were gated from tomato+GFP+ cells by population segregation.
Fig. 1 |
Fig. 1 |. Tendon harbors a self-renewing stem cell population.
a, tSNE plot for 2491 cells. Unsupervised clustering by Cell Ranger: keys to the clustering number to the right and cell type assignments on the plot. b, Immunofluorescence for indicated markers. Dashed lines indicate midsubstance-sheath boundary. c, Diagrams for Tppp3CG driver and experimental regimen: at P90, cells were marked by TMX for 3 d and chased to 5 d, and 3, 6, 10 M. d, Immunofluorescence images at 5 d and 10 M, and quantified cell fractions (keys at bottom); dashed line, midsubstance-sheath boundary; n=3 animals/condition; all ns by Chi-Square test; mean for (Negative, eGFP+, tdT+, and eGFP+tdT+) at specified time as follows: (5 d; 0.436, 0.113, 0, 0.451), (3 M; 0.410, 0.104, 0.0002, 0.104), (6 M; 0.479, 0.070, 0, 0.451), (10 M; 0.479, 0.057, 0, 0.465). e, Schema for tendon regeneration assay: same cell marking regimen as in (c), punch injury 5 d later and chased to 30 d; daily EdU for first 15 d. f, Diagram (left) of Patellar tendon at sagittal plane: P, patella; F, femur; T, tibia; midsubstance in white; sheath in gray; site of punch, red cylinder; imaged area, dashed box. Images in the middle and quantification to the right: U, uninjured; I, injured; examined cell groups same as (d); Chi-square test, ## p < 0.01; n=3 animals/condition; mean for (Negative, eGFP+, tdT+, and eGFP+tdT+) for specified condition as follows: (Sheath U; 0.608, 0, 0.051, 0.341), (Sheath I; 0.513, 0.015, 0.048, 0.424), (Midsubstance U; 1, 0, 0, 0), (Midsubstance I; 0.542, 0, 0.420, 0.038). g, High magnification of FMOD staining of 30 d regenerated tendons: *, proliferated Tppp3-descendant; ^, self-renewed Tppp3 lineage in sheath; 3 independent repeats; also see Extended Data 1k–m. Scale bars = 30 (a), 50 (d, f, g) μm.
Fig. 2 |
Fig. 2 |. Tppp3 stem cells amplify early and generate tenocytes by second week.
Diagrams for experimental design (a), and time course (b); daily EdU staggered in time windows (dashed line with arrow in b). Left bottom panels in (a) are whole mount 100 μm maximal projections at specified times in transverse views (except for 14 d, longitudinal view); 3-4 independent repeats: yellow arrows, tdT+ScxGFP+ cells; asterisks, tdT+ScxGFP sheath cells; white arrows, entrant tdT+ScxGFP; green arrows, entrant ScxGFP+ cells; dashed line, injury boundary; bracket, ScxGFP+ cells in SHG+ domain. Right bottom panels: cartoon summaries, axes indicated. Mid-panels in (b) are selected images at 7 d and 28 d; dashed lines, midsubstance-sheath boundary; n=3 animals/time point. Bottom left: line graph for % of EdU+ cells in specified population. Mean (%) per time stated for tdT+ScxGFP+ and tdT+ScxGFP. Bottom right: bar graph for the % of specified lineage in the total labeled population in the sheath; two-way ANOVA for interaction, df = 4, P = 7.602E-20; each population is also subjected to unpaired Student’s t-test in parentheses following specified lineage fraction in paired order of indicated time points for tdT+ScxGFP and tdT+ScxGFP+ (n=3 animals). Error bars = SEM. c, Schema for FACS isolation of marked cell population: sorted by FITC-A for tdTScxGFPr+ (tenocytes in regeneration environment) and by PE-A for tdTr+ScxGFP (renewed Tppp3 lineage); tdTr+ScxGFPr and tdT+ScxGFPr+ populations gated by population separation. d, Venn diagram from DESeq comparison between tdT+ScxGFPr+ and tdTrScxGFPr cells: # of transcripts labeled; 94.9% transcripts not differentially enriched (overlap region, q-value > 0.05 for cutoff). e, Averaged, normalized log10 counts of selected canonical tendon genes of the overlapped group in (d): blue box for transcription factors, green for collagens, and magenta for proteoglycans/glycoproteins. f, Venn diagram from DESeq comparison between tdT+ScxGFPr and tdT (quiescent Tppp3 cells): # of transcripts labeled; transcripts not differentially enriched (overlap region, q-value > 0.05 for cutoff); boxed genes represent genes found in overlap, sheath markers in red. Scale bars = 50 μm (a), 100 μm (b). Statistical analysis provided in source data for Figure 2.
Fig. 3 |
Fig. 3 |. Molecular characterization of tendon sub-populations.
a, Numbers of up-regulated genes by Cufflinks in uninjured FACS-isolated Tppp3+ (tdT+ScxGFP) and tenocyte (tdTScxGFP+) cells (duplicate); 5 FPKM cutoff in at least one population; false discovery rate (FDR) adjusted q-value < 0.05. b, Table for selected gene categories: log2(fold-change) directionality of enrichment in ScxGFP+ (green) versus Tppp3+ (red) cells (a): gene ID is followed by scRNA-seq cluster assignment in parentheses; n=2 replicates, pooled from 14 tendons; FDR adjusted q-values by Cufflinks package are shown. c, Table for number and % of cluster 2 cells in total, expressing Tppp3, and expressing both Tppp3 and Pdgfra; 1 UMI for cutoff. d, Top panel: Pseudotime trajectory of cluster 2 and 4 cells from scRNA-seq (Fig. 1a) re-plotted using top 1,000 genes by smallest q-value for ordering. Three Tppp3+ states were delineated with state 1 enriched for Pdgfra; keys to cell states at the top. Log10 expression level of Tppp3 (middle) and Pdgfra (bottom) per individual cell plotted in pseudotime trajectory of cluster 2 and 4 cells from scRNA-seq; their enrichment in state 1 is noted by red circles. e, Images of Tppp3CG/+;R26RtdT;PdgfraH2B-eGFP tendon, Images representative of 3 samples. TMX for 3 d and harvested 5 d later; dashed line, midsubstance-sheath boundary; yellow arrowheads, tdT+ H2B-eGFP+ cells; red arrowheads, tdT+H2B-eGFP; green arrowheads, tdTH2B-eGFP+; blue arrowheads, negative; direct fluorescent imaging to visualize GFP signal from PdgfraH2B-eGFP but not eGFP from Tppp3CG allele requiring antibody; scale bar = 30 μm. f, Relative cell fractions (keys at bottom) within Tppp3+(tdT+) population (left bar graph; mean (%) (tdT+H2B-eGFP+, 61.4), (tdT+H2B-eGFP, 38.6)) and within the sheath (right pie chart) from (e); n=3 animals. SEM = error bars or labeled.
Fig. 4 |
Fig. 4 |. Tppp3+Pdgfra+ cell gene signature and contribution during regeneration.
a, PCA plot from RNA-seq data of tdT+Pdgfra (tdT+H2B-eGFP1-3) and tdT+Pdgfra+ (tdT+H2B-eGFP+1-3) tendon cells from Tppp3CG/+;R26RtdT;PdgfraH2B-eGFP tendons; 3 samples. b, Heatmap of state 1 (from Fig. 3d)-enriched ordering genes (586 genes) used to generate pseudotime trajectory using tdT+Pdgfra (tdT+H2B-eGFP1-3) and tdT+Pdgfra+ (tdT+H2B-eGFP+1-3) cells (from a). c, Heatmap of top 1000 genes from triplicate RNA-seq of tdT+Pdgfra (tdT+H2B-eGFP1-3) and tdT+Pdgfra+ (tdT+H2B-eGFP+1-3) tendon cells with the genotype in (a); 47% of tdT+Pdgfra+ and 0.4% tdT+Pdgfra expressed genes overlap with top 500 FAP genes (GSE89633). d, Heatmap of canonical tendon markers from (b); asterisks, transcription factors; <, collagens; Pdgfra and Tppp3 (red boxes); Scx (green box). e, Heatmap of midsubstance markers in quiescent tenocyte (ScxGFP1-2) and tdT+Pdgfra+ (tdT+H2B-eGFP+1-3) cells. f, 30 dpi of Tppp3ECE/+;R26RtdT;PdgfraH2B-eGFP tendon; EdU daily for the first 15 d; yellow arrowheads, tdT+H2B-eGFP+; red arrowhead, tdT+H2B-eGFP; green arrowheads, tdTH2B-eGFP+; dashed line, midsubstance-sheath boundary; n=3 animals; bar graph for the fraction of midsubstance tdT population that is PDGFRα+, mean=86.2%. g, 14 dpi of Tppp3CG/+;R26RtdT tendon; 3 samples; upper panels, uninjured area; lower panels, injured area; blue arrowheads, ER-TR7+-only; red arrowheads, ER-TR7tdT+; dashed lined, midsubstance-sheath boundary. h, 30 dpi of Tppp3ECE/+;R26RtdT;PdgfraH2B-eGFP tendon; 3 samples; green arrowheads, ER-TR7+tdTH2B-eGFP+; yellow arrowhead, ER-TR7+tdT+H2B-eGFP+; dashed line, midsubstance-sheath boundary. i, Pie chart distribution of ER-TR7+ cells in injury area from h; n=3; key to the right. Error bars = SEM (f, i); scale bars = 20 (f, h), 40 (g) μm.
Fig. 5 |
Fig. 5 |. PDGF-AA drives Tppp3-lineage towards tenogenesis.
a, Diagram for PDGF-AA (AA), PDGF-DD (DD) and PBS treatment to tendon sheath via GelFoam (orange line); arrow, treatment site; blue ‘D’ and magenta ‘E’ boxes, sheath and midsubstance regions, respectively, for quantification in (d) and (e). b, Experimental scheme for (a): annotation same as previous schemes, plus GelFoam implant and protein treatment (solid line with arrow). c, Bar graph for fraction of sheath cells proliferated with two PDGF-AA concentrations using wildtype C57BL/6J mice; n=2 (0.5ug/kg) or n=3 (No Gelfoam, PBS, 5ug/kg) animals/condition; 15 samples/condition; No GelFoam and PBS, controls. d, Fluorescent images of sheath compartment with specified treatment on Tppp3ECE/+;R26RtdT;ScxGFP tendon; bar graph (upper right) for % of Tppp3-lineage proliferated in sheath per treatment; n=3 animals/condition; with 2 (PBS) or 3 (AA, DD) samples/condition. Percentages of various tdT+-lineage fractions (keys at bottom) in sheath (lower right): Distribution comparisons between PBS-AA, PBS-DD, and AA-DD pairs by Chi-square tests, all ## P < 0.01. Each cell fraction is also subjected to Student’s t-test in parentheses following specified cell fractions in paired order of (PBS-AA, PBS-DD, and AA-DD): tdT+ (P=1.01E-05, P=1.51E-02, P=1.1E-03), tdT+EdU+ (P=0.264, P=0.021, P=0.233), tdT+ScxGFP+ (P=5.26E-03, P=0.161, P=2.73E-03), and tdT+ScxGFP+EDU+ (P=8.95E-03, P=0.951, P=1.59E-03). e, Bar graph for average number of lineage cells in midsubstance; n=3 animals/condition. f, Zoomed in fluorescent images of PDGF-AA treated midsubstance (from e) stained for FMOD; asterisks, FMOD+tdT+ScxGFP+ cells; 3 independent repeats. g, Bar graph of percentage of ER-TR7+ sheath cells per treatment; n=3 animals/condition; 3 samples/n. Unpaired two-tailed Student’s t-test (c, d, e, f), error bars = SEM; scale bar = 30 (d, f) μm.
Fig. 6 |
Fig. 6 |. PDGFRα signaling is required in Tppp3+ cells for regeneration.
a, H & E histology of Pdgfrafl/fl (control) and Tppp3CG/+;Pdgfrafl/fl (cKO) at 30 dpi; white box, area of zoom in panels displayed to the right; arrows, matrix defects; dashed line, midsubstance-sheath boundary; 2 independent repeats. b, Picrosirius red histology of Pdgfrafl/fl (control) and Tppp3CG/+;Pdgfrafl/fl (cKO) at 14 dpi; black box, area of zoom in panels displayed on the right; arrows, matrix defects; 2 independent repeats. c, Experimental scheme and fluorescent images of Pdgfrafl/fl (control), Tppp3CG/+;Pdgfrafl/fl, and Tppp3ECE/+;Pdgfrafl/fl tendons at 30 dpi; 3 (control) and 4 (mutants) animals/condition; EdU for first 15 d; Col-F, collagen; TNC, antibody stained; dashed line, midsubstance-sheath boundary; arrow, regenerated tendon; asterisk, failed regeneration. d, TEM images of control uninjured (CU), control injured (CI), and cKO injured (cKO I) adult, tendon cross-sections of equivalent area. Upper panels are low magnifications of matrix architecture. Red asterisk indicates hole in matrix. White dashed line indicates the border of the injury where fibrils were counted for cKO I. Lower panels represent two images of fibrils per condition. Bar graph, aggregated distribution of collagen fibril diameters, using high magnification TEM images above from n = 4 mice/group (1000 fibrils/tendon for CU and CI, and at least 150 fibrils/tendon for cKO I on the edge of the injury hole). Average minimum feret fibril diameter across tendon types are as follows: 124.7±0.7 (CU), 55.3±0.5 (CI), and 110.6±2.2 (cKO I) (Mean±SEM) nm. Scale bars = 0.2 (d lower panels), 10 (d upper panels), 50 (a, b, c zoomed in panels on left) and 100 (a, b zoomed out panels on right) μm.
Fig. 7 |
Fig. 7 |. Tppp3+ mutant cells fail to differentiate following injury.
a, Pdgfra gene inactivation: Same TMX and injury scheme as before and harvested at 14 dpi; EdU daily throughout. Upper panels, images for Tppp3CG/+;R26RtdT (R-control) and lower panels for Tppp3CG/+;R26RtdT;Pdgfrafl/fl (R-cKO); asterisk, area of failed regeneration. GFP was detected by immunofluorescence. n=3 (R-control) and n=4 (R-cKO) animals/condition; 3 samples/n. To the upper right, quantification for lineage cells per injury area (unpaired two-tail Student’s t-test); mean(%)=(R-control, 46.6; R-cKO, 30.7). To the lower right, tdT lineage composition at bottom (Chi-square test ## p <0.01). Each cell fraction is also subjected to unpaired two-tail Student’s t-test in parentheses between R-control and R-cKO groups: tdT+ (P=8.00E-13), tdT+GFP+ (P=2.54E-08), tdT+GFP+EdU+ (P=3.59E-15), tdT+EdU+ (P=1.27E-12); mean(%) per cell fraction across groups (R-control, R-cKO) as follows: tdT+(33.8, 1.7), tdT+GFP+ (6.8, 24.6), tdT+GFP+EdU+ (6.5, 66.9), tdT+EdU+ (53.0, 6.8). b, SCX immunofluorescence organized as in (a); to the right, pie charts for lineage composition; two-way ANOVA, df = 3, P = 6.5776E-20; n=3 samples; 3 independent repeats. c, FMOD immunofluorescence organized as in (a); dashed line, midsubstance-sheath boundary; 3 independent repeats. d, Model: T-FAPs and stem cells reside in the sheath (gray) and tenocytes in the midsubstance (red). Following injury, PDGF signalling directs T-FAPs to elicit fibrosis and stem cells to produce new tenocytes. Tenocytes have limited repair (gray small arrow) and do not compensate without functional stem cells (R-cKO). Error bars = SEM (a); scale bar = 50 (a, b), 100 (c) μm.
Fig. 8 |
Fig. 8 |. Sheath subpopulations do not have identical properties in vitro
a, Schemes for in vitro experiments using cell subpopulations purified from Tppp3CG/+;R26RtdT;PdgfraH2B-eGFP Patellar tendon. b, Fractions of tdT+H2B-eGFP+ subpopulation that were TPPP3+ or PDGFRα+ at specified time intervals in TSPC culture; n=4 samples per time point; Mean per time point (24 h, 72 h, 120 h) indicated fractions of positive marker staining (TPPP3+; 0.997, 0.995, 0.997), (PDGFRα+, 0.999, 0.996, 0.998). c, tdTH2B-eGFP+ subpopulation at specified time intervals in TSPC culture; n=4 samples per time point; unpaired two-tail Student’s t-test p-values displayed on chart; mean per condition (24 h V, 24 h 4-OH, 72 h 4-OH, 96 h 4-OH) as follows: (0.005, 0.006, 0.006, 0.003). d, tdT+H2B-eGFP subpopulation at specified time intervals in TSPC culture; n=8 samples per time point; unpaired two-tail Student’s t-test significant p-values displayed on chart, all other comparisons are non-significant, p > 0.05; Mean per time (24 h, 48 h, 72, 96 h) as follows: (0.026, 0.010, 0.010, 0.005). e, Multipotent differentiation assay: control, non-differentiated murine mesenchymal stem cells (MSCs); scale bars = 50 μm (adipogenesis and osteogenesis), 1000 μm (chondrogenesis). 3 independent repeats. Error bars = SEM (b-d).

Similar articles

Cited by

References

    1. Elliott DH. (1965) Structure and Function of Mammalian Tendon. Biol Rev Camb Philos Soc. 40:392–421. - PubMed
    1. Voleti PB, Buckley MR, Soslowsky LJ. (2012) Tendon Healing: Repair and Regeneration. Annu Rev Biomed Eng 14: 47–71. - PubMed
    1. Jozsa L and Kannus P. Human Tendons: Anatomy, Physiology and Pathology. Champaign: Human Kinetics, 1997. Print.
    1. Harvey T and Fan C-M (2018) Origins of tendon stem cells in situ. Front Biol 13(4): 263–276. DOI:10.1007/s11515-018-1504-4 - DOI
    1. Howell K, et al. (2017) Novel model of tendon regeneration reveals distinct cell mechanisms underlying regenerative and fibrotic tendon healing. Sci Rep 7(45238): DOI: 10.1038/srep45238 - DOI - PMC - PubMed

Publication types

MeSH terms

Substances